

Abstract
Water use by plant communities across years of varying water availability indicates how terrestrial water balances will respond to climate change and variability as well as to land cover change. Perennial biofuel crops, likely grown mainly on marginal lands of limited water availability, provide an example of a potentially extensive future land cover conversion. We measured growing-season evapotranspiration (ET) based on daily changes in soil profile water contents in five perennial systems—switchgrass, miscanthus, native grasses, restored prairie, and hybrid poplar—and in annual maize (corn) in a temperate humid climate (Michigan, USA). Three study years (2010, 2011 and 2013) had normal growing-season rainfall (480–610 mm) whereas 2012 was a drought year (210 mm). Over all four years, mean (±SEM) growing-season ET for perennial systems did not greatly differ from corn (496 ± 21 mm), averaging 559 (±14), 458 (±31), 573 (±37), 519 (±30), and 492 (±58) mm for switchgrass, miscanthus, native grasses, prairie, and poplar, respectively. Differences in biomass production largely determined variation in water use efficiency (WUE). Miscanthus had the highest WUE in both normal and drought years (52–67 and 43 kg dry biomass ha−1 mm−1, respectively), followed by maize (40–59 and 29 kg ha−1 mm−1); the native grasses and prairie were lower and poplar was intermediate. That measured water use by perennial systems was similar to maize across normal and drought years contrasts with earlier modeling studies and suggests that rain-fed perennial biomass crops in this climate have little impact on landscape water balances, whether replacing rain-fed maize on arable lands or successional vegetation on marginal lands. Results also suggest that crop ET rates, and thus groundwater recharge, streamflow, and lake levels, may be less sensitive to climate change than has been assumed.
Export citation and abstract BibTeX RIS
1. Introduction
The fraction of precipitation returned to the atmosphere by evapotranspiration (ET) determines the balance that is available for groundwater recharge and runoff. Thus, how ET rates will respond to climate change and variability or land cover change has far-ranging consequences for groundwater availability, stream flows, and surface water levels. Across much of the world, land use and cover have been dramatically transformed by human activity in the past, and are expected to continue to change in the future as a result of intentional conversion (e.g., agricultural expansion) [1, 2] and changing climatic drivers [3].
Land conversion to biofuel production is an example of a potential large-scale land cover change. Purpose-grown perennial biomass crops for biofuel provide an attractive alternative to grain-based and fossil energy sources of liquid transportation fuel [4] but would require large amounts of arable land [5]. Growing such crops on marginal lands could avoid competition with food, indirect land use change effects, and local carbon debt [6–8]. Yet vegetation on marginal lands is often limited by water availability, and we lack a clear understanding of water demands by these perennial cropping systems in comparison to what they would replace, and how their water use will respond to climate variability and change.
Modeling studies suggest that perennial grass crops could draw down water tables and attenuate local streamflow by withdrawing more water than the annual crops that might otherwise be grown [9] or the unmanaged herbaceous community they might replace. However, water use by both annual and perennial crops in humid temperate climates may be similarly limited by a combination of decreasing soil water availability and the energy available to drive ET over the growing season. Most runoff and streamflow may be generated outside the growing season. To date, however, there have been no multiyear, comparative measurements of ET in annual and perennial cropping systems that are rainfed; those that exist have examined cropping systems on poorly drained soils where crops have additional water supply by access to high water tables [10, 11].
This knowledge gap exists for perennial vegetation in general in mesic environments, and has important implications for how landscape water balances will respond to climate change [12]. ET usually consumes more than half of the annual precipitation in vegetated landscapes [13]. In spite of decades of research, the responses of ET, and thus groundwater recharge and river discharge, to climate variability and change remain areas of significant uncertainty for hydrological modeling [14–16]. In the humid, temperate climate of the Laurentian Great Lakes region (Midwest US and Canada), for example, uncertainty in the partitioning of precipitation into ET, groundwater recharge, and runoff translates to widely divergent projections of responses of streamflow and lake levels to climate and land use change [17, 18].
Here we analyze water use (ET) and water use efficiency (WUE, the ratio of aboveground biomass production to ET) of five perennial systems as compared to continuous maize (hereafter referred to as corn; Zea mays) grown in the humid temperate climate of the US Midwest. The five perennial systems include switchgrass (Panicum virgatum), giant miscanthus (Miscanthus × giganteus), a five-species native grass assemblage ('native grasses'), an 18-species restored native prairie community ('prairie'), and hybrid poplar trees (Populus). These cropping systems were chosen to span a range of potential cellulosic biofuel feedstocks, with corn grown for comparison with the perennial systems. Continuous field observations of the drawdown of soil water by these systems—directly measured at multiple soil depths using time-domain reflectometry (TDR)—reveal their daily ET rates and growing-season water use efficiencies across four years of varying water supply, including a drought during the 2012 growing season that severely affected cropyields. Results of this study indicate the likelihood that deployment of perennial biofuel crops will adversely affect landscape water balances. In addition, they contribute to our understanding of how ET from annual and perennial vegetation responds to interannual variation in water availability, thereby informing models projecting hydrological responses of landscapes to climate variability and change as well as changes in land use.
2. Methods
Experimental sites were located in southwest Michigan, in the northeastern part of the US Corn Belt. The Biofuels Cropping System Experiment is part of the Great Lakes Bioenergy Research Center (GLBRC) and located at the W K Kellogg Biological Station (KBS) Long Term Ecological Research site (www.lter.kbs.msu.edu; 42.3956° N, 85.3749° W and 288 m asl). Mean annual air temperature is 10.1°C and annual precipitation is 1005 mm, 511 mm of which falls from May to September (1981–2010) [19]. Snowfall averages 1.3 m per year. A meteorological station (http://lter.kbs.msu.edu/datatables) located 1 km from the site monitored air temperature, relative humidity, precipitation, and solar insolation during the study. Soils are well-drained Typic Hapludalfs developed on glacial outwash [20], and the water table is approximately 12–14 m beneath the surface. Analysis of the water budget for the adjacent Augusta Creek watershed over three representative years indicated that 62% of the annual precipitation was returned to the atmosphere as ET, mainly during the growing season (May–September), with the balance supporting stream flow, about 75% of which was generated by groundwater discharge and 25% by surface runoff as well as direct capture by lakes and wetlands along the stream [21].
Soil water measurements were made in one of five treatment blocks, which consist of 28 × 40 m cropping system plots established in 2008 on land previously in row crop agriculture for many decades. The cropping systems analyzed here include (1) continuous no-till corn; (2) switchgrass, Panicum virgatum L. (variety Cave-in-Rock); (3) miscanthus, Miscanthus × giganteus; (4) a five-species native grass assemblage (Andropogon gerardii, Elymus canadensis, Panicum virgatum, Schizachyrium scoparium, and Sorghastrum nutans), four of which are C4 grasses; (5) an 18-species restored native prairie; and (6) hybrid poplar (Populus nigra × P. maximowiczii 'NM6'). Species planted in the prairie cropping systems are listed at http://data.sustainability.glbrc.org/protocols/144. Crops in each system were harvested annually except for the poplar, which was harvested following six years of growth after the 2013 growing season. By 2010 the miscanthus and switchgrass crops had attained yields within the range expected for this region, which typically peak three years after planting [22, 23], so here we present data from 2010 to 2013.
2.1. Soil water content measurements
Soil water profiles throughout the root zone were monitored hourly using permanently installed, horizontally inserted TDR [24] probes at depths of 20, 35, 50, 65, 90 and 125 cm as well as a vertically inserted probe at 0–10 cm depth. Depths were chosen based on knowledge of soil horizons and root distributions. A single profile was installed in each cropping system treatment. These depths span the root zone of the crops; few if any roots are found below ∼150 cm depth. We fabricated the two-wire stainless-steel TDR probes (4 mm dia.) to be 30 cm long and 4 cm apart. The probes were calibrated in excavated site soil that was oven-dried, then adjusted to a range of volumetric soil water contents (SWC, L water L−1 soil) from 0 to 40% and the responses were fit to a polynomial calibration function [25]; most probes were accurate to 1% before calibration. The probes were connected to Campbell Scientific TDR100 time-domain reflectometers. Each TDR profile was situated 5 m from the edges of the plots.
The SWC measurements were screened to eliminate occasional spurious values outside the plausible range of 0.05–0.50, then a 13-point running mean was calculated. Gaps, which were usually no more than a few days, were filled by linear interpolation. The median daily SWC was used in all subsequent calculations.
2.2. Soil water flux calculations
Crop water use was estimated at daily time steps during the growing season from the decrease in SWC as measured using TDR. On days when there was no SWC decrease because of rainfall or because the soil was at or above its water-holding capacity, crop water use was estimated using the SALUS model [26]. The model was driven by meteorological data and plot-specific data on soil texture, bulk density and organic matter, as well as management of each crop. The model was run with the same strata except it subdivided the 0–10 cm stratum into 0–2 and 2–10 cm intervals. On average the SALUS model was used to estimate ET for 29% of growing season days (figure S1 in the SI) and there was no correlation between the percentage of days using SALUS ET and the total ET.
The growing season was defined as beginning with the planting (annual crops) or leaf emergence (perennials) and ending at harvest or, in the case of poplar, autumn leaf senescence. Phenological observations as well as daily images taken by permanently mounted cameras indicated dates of emergence of significant foliage.
We estimated the lower limit (LL) of plant-extractable soil water (PESW) for each stratum of each TDR measurement profile as the minimum observed SWC, which occurred during the 2012 drought (e.g., figures 1(a)–(c)), when there was visible water stress in the crops. Soil profiles in this region fully recharge over winter. Therefore the drained upper limit (DUL) was estimated for each stratum of each TDR measurement profile in each year from TDR observations over the 30-day period preceding the first canopy development after screening out any dates with >5 mm rainfall and the three days after those rain events. The mean DUL for the four years of observation was used in subsequent calculations.
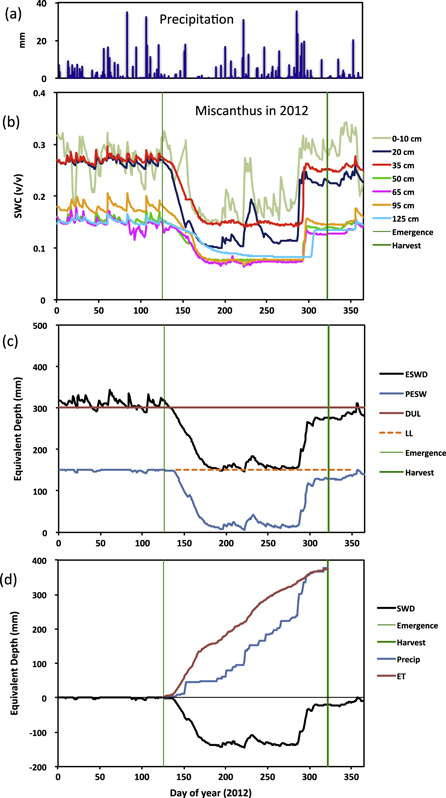
Figure 1. Example of the soil water data for miscanthus in 2012, showing precipitation events (a), soil water content (SWC) from TDR probes (b), the equivalent soil water depth (ESWD) in relation to the drained upper limit (DUL) and lower limit (LL) and plant-extractable soil water (PESW) (c), and the cumulative crop evapotranspiration and precipitation in relation to the soil water deficit (SWD) (d).
Download figure:
Standard image High-resolution imageSoil water content was multiplied by stratum depth to yield the Equivalent Soil Water Depth (ESWD) for each stratum represented at its midpoint by the TDR sensor depth, and the total ESWD was determined as the sum of the depths in each stratum (e.g., figure 1(c)). The lowermost TDR measurement (125 cm) was assumed to represent 110–150 cm.
The Soil Water Deficit (SWD) for the profile was calculated as the ESWD minus the DUL, and was thus negative when the profile SWC was below the DUL (e.g., figure 1(d)). An increase in the SWD (i.e., becoming more negative) over a daily interval indicated loss of water by ET. PESW was considered to be the difference between the mean DUL and the minimum observed LL over the four years of observations.
2.3. Water use efficiency
WUE was calculated for the maximum production of aboveground biomass, dividing biomass by crop water loss (ET) over the growing season up until the time of biomass measurement. Crop biomass was measured near its seasonal maximum (late summer or early fall depending on the crop: http://glbrc.kbs.msu.edu/protocols/117) and crop yield was measured upon harvest. For all cropping systems except poplar, maximum biomass was measured within quadrats, and yield was measured from the entire plot. Corn grain and cellulosic biomass were measured separately. Poplar woody biomass was measured annually by sacrificing several trees each year to develop a predictive relationship between stem diameter and woody biomass (http://data.sustainability.glbrc.org/protocols/156). Weeds and surface litter were quantified separately but are not included in the maximum poplar biomass measurements reported here.
3. Results
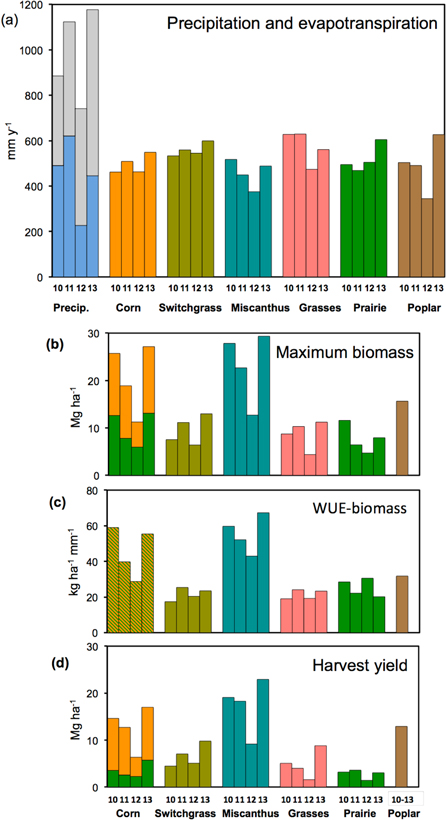
Growing season (May–September) rainfall over the 2010–2014 study period was close to normal (511 mm average for 1981–2010) for three of the years (500, 610, and 480 mm for 2010, 2011, and 2013) (figure 2(a), left bars). In 2012 drought developed by July, with a rainfall total of only 210 mm for the growing season.
Figure 2. Precipitation, cropping system water use, and production for each of the four study years (2010–2013): precipitation and crop evapotranspiration (a), maximum aboveground biomass (b), water use efficiency (WUE) for biomass production (c), and harvest yield (d). Precipitation is divided into the May–September growing season (blue) and the preceding October–Apr (gray). Corn biomass and yield are divided into grain (orange) and stover (green). Poplar was harvested at the end of the four-year interval (six years post-planting) and biomass production and WUE are annual means for 2010–13.
Download figure:
Standard image High-resolution image
By the beginning of each growing season, the water content of the soil profile (0–150 cm) was close to the DUL of water availability in each cropping system (figure S2). During the 2012 drought, soil water content was drawn down to a plateau that indicated the LL of PESW for each system (figures 1(b) and (c)). The difference between the DUL and the LL observed over the study is the PESW at the beginning of the growing season. Expressed as equivalent water depth and averaged across years by cropping system, PESW ranged from 143 to 223 mm across the cropping systems; in addition to growing-season rainfall, this soil water was available to support crop growth (figure S2).
Despite the marked reduction in water availability in 2012, ET was similar across years for corn, switchgrass, and prairie, although it was lower in 2012 for miscanthus, native grasses, and poplar (figure 2(a)). In the three years of relatively normal water availability (2010, 2011 and 2013), the ET of the perennial crops ranged from 449 to 629 mm, overlapping that of corn (462–549 mm). The length of the growing season varied across years, but was not consistently different between corn and the perennial crops, except that the poplar growing season was consistently the longest (figure S3).
Aboveground biomass production varied considerably among years and across cropping systems (figure 2(b)), resulting in similarly variable WUEs for biomass production (figure 2(c)). Total maximum biomass in corn (19–27 Mg ha−1 in the non-drought years) was close to but slightly lower than miscanthus (23–29 Mg ha−1 non-drought), whereas the other perennial cropping systems had considerably lower biomass production. The drought in 2012 resulted in the lowest biomass accumulation in all of the cropping systems; for example, corn reached only 11 and miscanthus 13 Mg ha−1. The woody biomass production and WUE-biomass of poplar over the four years, expressed as an annualized mean for comparison, was 16 Mg ha−1, lower than miscanthus and corn but higher than the switchgrass, native grasses, and prairie cropping systems.
Harvest yield was lower than maximum biomass observed during the growing season, particularly for native grasses and prairie, but tended to mirror interannual variation in maximum biomass (figure 2(d)). The annualized poplar woody biomass yield of 13 Mg ha−1 was lower than that for miscanthus (18–23 Mg ha−1 non-drought) but higher than those for the other perennial cropping systems, for which yields never exceeded 10 Mg ha−1.
4. Discussion
Water use (ET) by the perennial biomass systems was similar to that of corn. Over the four years, the mean (±SEM) of growing-season water use was 496 ± 21 mm for corn, compared to means of 559 (±14), 458 (±31), 573 (±37), 519 (±30), and 492 (±58) mm for the switchgrass, miscanthus, native grasses, prairie, and poplar systems, respectively (figure 2(a)). Crop water use was markedly lower in the drought year (2012) for miscanthus, native grasses, and poplar, but not for corn, switchgrass, and prairie, which seem to have had less difficulty recovering from the drought once it ended in mid-August. Differences in plant-extractable soil water at the beginning of the growing season (figure S2) do not explain the different responses of the cropping systems to the drought, and the rooting zone of all crops was far above the water table (as indicated by nearby water supply wells).
Our results are in broad agreement with empirical studies of ET in similar climates, mostly based on eddy covariance measurements in both annual crops and perennial grasslands. For example, our results plot close to the global Budyko trend line in a synthesis of ET studies [13]. For rain-fed corn, growing-season ET rates of 449–505 mm were reported in Nebraska (USA) [27], which compares well with our observed range of 462–549 mm (figure 2(a). However, few other studies compare measurements of crop water use by annual and perennial cropping systems in mesic environments, including prospective cellulosic biofuel crops [12, 28].
Our observations differ sharply from earlier modeled predictions [9] that ET will be 58% higher from miscanthus and 36% higher from switchgrass as compared to corn under the current climate of the Midwest US Similarly, other modeling studies [29, 30] but not all [31] have asserted that cellulosic biofuel crops will have substantially higher ET than corn. This is likely to be the case only if the growing season is considerably longer for the perennial crops, and soil water availability remains high [31]. With water freely available, perennial crops such as miscanthus would be expected to withdraw water until senescence in late fall, while annual crops like corn would have a shorter growing season. Higher ET of perennial grasses compared to annual corn appears to be the case at sites with high water tables and subsurface drainage, as shown by studies in central Illinois [10, 32, 33] and Iowa [11], both of which also have longer growing seasons than southern Michigan. Thus perennial crops in poorly drained soils will likely withdraw more water than corn, a consideration for the placement of perennial crops in future biofuel landscapes. However, marginal lands attractive for biofuel crop production are more likely to be excessively well drained than to either be irrigated or have high water tables managed by subsurface drainage systems.
Our measurements of similar ET rates in perennial crops versus corn are corroborated in a larger scale experiment nearby, where eddy covariance has been used to estimate ET in whole-field plantings of switchgrass, native prairie, and corn. While eddy covariance measures of ET are known to often be systematically lower, possibly owing to instrument limitations or scaling of turbulent fluxes [34, 35], overall trends were similar: ET rates across years in the two perennial systems were similar to those in continuous corn, in both normal and drought years [36].
That the ET for short-rotation poplar plantations did not differ greatly from the ET for perennial grasses contrasts with well-documented observations of substantially greater ET from trees than grasslands in warmer, more arid regions with strong wet–dry seasonality, such as South Africa [37] and Australia [38]. Trees in these climates actively transpire over considerably longer time periods than grasses and can be more deeply rooted. In contrast, prior work with hybrid poplar at KBS on the same soil series showed that most roots were in the Ap horizon (0–25 cm) [39], as is the case for our grass species (Sprunger et al, in preparation). Also, poplar has only a slightly longer growing season than the other cropping systems (figure S3).
The variation in water use efficiencies of our cropping systems was determined mainly by variations in aboveground plant production rather than ET (figures 2(a)–(c)). Miscanthus had the highest WUE for biomass production, followed by corn, whereas the native grasses and prairie systems had relatively low WUEs. Poplar WUE was slightly higher than the WUEs of the native grasses and prairie. Comparative studies of WUE of these cropping systems are uncommon, and some authors use annual rather than growing-season water loss. Comparable WUE values were cited in a review for rain-fed grain and forage crops [40]. The aforementioned studies in Illinois [10, 33] reported WUEs for corn, switchgrass, and miscanthus that are generally lower than our estimates, probably due mainly to the greater water supply and consequently higher ET rates.
In general, WUE at the leaf scale would be expected to be higher under more water-limited conditions. Contrary to that expectation, however, the 2012 drought year did not result in higher WUEs for biomass production, and in some cases they were lower. Research on wheat in Australia [41] indicates that WUE does not always increase with water limitation, particularly if that limitation arises during the latter part of the growing season, and also that increased WUE at the leaf scale does not always translate to increased WUE for biomass production.
5. Conclusions
A primary conclusion of this study—that perennial crops in rainfed mesic environments do not use more water than corn across years of either normal or very limited water availability—has implications for the anticipated expansion of cellulosic biofuel production in the Midwest and in regions with similar humid temperate climates. Whether annual or perennial, rainfed cropping systems in mesic environments tend to use most of the available soil water during the growing season—the sum of previously stored water and new rainfall that is retained in the root zone, and they do so at similar rates once their canopies are developed. Thus the deployment of rain-fed perennial biomass crops within landscapes should not much alter the landscape water balance unless they are planted in areas with high water tables. Prospective cropping systems differ greatly in yield and WUE, which should help guide selection of appropriate crops to optimize water use in specific settings.
Our results also help to inform uncertainty about the effects of a warming climate on groundwater and surface water recharge. Projections of future changes in Great Lakes water levels, for example, depend greatly on accurate estimates of ET in the annual crops and perennial vegetation that comprise much of the agricultural landscapes. Estimates that lake levels would fall by as much as 0.5 m or more in the coming century e.g., [42] have been recently revised using energy budget approaches [17, 43], suggesting the possibility for smaller decreases, if any. Our results showing relatively similar water use in diverse cropping systems across years of widely varying water availability and temperature are consistent with these conclusions, suggesting that crops and the early successional vegetation that make up much of the agricultural landscapes in this region will use whatever growing-season water is available, as they mostly do now. A warmer and longer growing season may therefore have smaller consequences for ET, and thus terrestrial runoff and river discharge, than climate-driven changes in other aspects of the water cycle such as increased intensity of rain events, less snow accumulation, and shorter periods of lake ice cover.
Acknowledgments
We thank M Abraha, P Jasrotia, S Bohm, J Bronson, K A Kahmark, C McMinn, J Simmons, S VanderWulp, and many others for field, laboratory, and data assistance. Financial support for this work was provided by the US Department of Energy through the Great Lakes Bioenergy Research Center (DOE BER Office of Science DE-FC02-07ER64494 and DOE OBP Office of Energy Efficiency and Renewable Energy DE-AC05-76RL01830), the US National Science Foundation (LTER program, DEB 10277253), and the Michigan Agricultural Experiment Station.