

Abstract
This study will use the Mann–Kendall (MK) non-parametric trend test to examine timing changes in spring (early May to the end of June) streamflow records observed by the Water Survey of Canada during 1985–2011 in an Arctic headwater basin in the Western Canadian Arctic. The MK test shows a general delay in the five timing measures of springtime streamflow, which are based on the 5 percentile (Q5), 10 percentile (Q10), 50 percentile (Q50), 90 percentile (Q90), and 95 percentile (Q95) dates of spring runoff, respectively. However, much stronger trend signals were clearly noted for the high percentiles than that for the low and middle percentiles, indicating different effects of hydroclimate processes working on the timing of springtime streamflow. In contrast, the earlier snowmelt onset derived from daily mean temperatures was found over the 27-year study period. In addition, multiple relationships were correlated between these five timing measures of spring runoff and five hydroclimate indicators (total snowfall, snowmelt onset, spring temperature fluctuation, spring rainfall, and spring rainfall timing) in order to identify possible causes on the changes of springtime streamflow timing. The results indicate that the differences are due to the contradictory effects of winter–spring air temperature changes, temperature fluctuation during the melting period, and spring rainfall to spring runoff. The earlier snowmelt onset, which is attributed to the winter–spring warming, and spring temperature fluctuation that works in the opposite way, result in the minor timing changes of Q5, Q10, and Q50. The increase in spring rainfall and its delayed timing have a significant impact on the dates of Q90 and Q95. Moreover, the decreased total snow accumulation over the winter season only has a minor influence on the timing of springtime streamflow.
Export citation and abstract BibTeX RIS

Content from this work may be used under the terms of the Creative Commons Attribution 3.0 licence. Any further distribution of this work must maintain attribution to the author(s) and the title of the work, journal citation and DOI.
1. Introduction
For Arctic catchments, snowmelt-dominated streamflow as a key hydrological event of the year, often accounts for over 65% of the annual streamflow and presents the maximum flow of the year. Changes in snowmelt runoff are believed to be very sensitive to changes in climate (Serreze et al 2000, Déry et al 2005, 2009, Burn 2008, Yang et al 2009, Wang et al 2011, Semmens and Ramage 2013). For instance, with well documented warming of the arctic climate (IPCC 2013), especially in winter and spring, one expected change is the earlier occurrence of spring streamflow. However, with simulataneous changes in air temperature (Serreze et al 2000, Hinzman et al 2005, Trenberth et al 2007, Screen and Simmonds 2010), precipitation (Groisman et al 1994, Serreze et al 2000, Yang et al 2003, Rawlins et al 2010, Brown and Robinson 2011, Shi et al 2011, 2013), vegetation (Hinzman et al 2005, Serreze et al 2009, Walker et al 2010), and active layer thickness (Hinzman and Kane 1992, Zhang et al 2001, Frauenfeld et al 2004, Romanovsky et al 2007), and complex interactions among these, the actual changes in both the timing and volume of spring streamflow may not be as simple as first expected (Hodgkins and Dudley 2006, Déry et al 2009). For example, some changes could be expected to result in earlier melt and runoff, while others would delay melt and/or runoff. Those advancing melt and runoff could include: (a) ealier snowmelt onset resulting from the warming winter/spring air temperature; (b) warmer soil temperature; and (c) shallow snowpack decreasing water storage supply. While those delaying melt and/or runoff could include: (a) increasing tundra shrub cover that would change snowcover distribution with deeper snow in shrub patches and shrub stems shading the surface and reducing wind speed at the snow surface; (b) deeper active layer resulting in greater soil mositure storage and therefore possibly delaying melt runoff. In addition, changing frequency and magnitude of rain-on-snow events, increases in end of winter snow temperature, hillslope runoff controlled by the refreezing of water in the active layer and the storage capacity of the active layer, and streamflow affected by the occurrence of snow dams (Woo and Sauriol 1981) in the stream channel could be other reasons. Therefore, we believe that there is a complex relationship between climate and snowmelt controlled streamflow and its timing. Unfortunately, there have been few studies documenting the overall effects of these changes on snowmelt and streamflow. Thus, little is known about the interactions among the dominating processes, and as a result our predictive ability is very low.
In this letter, we aim to consider the impact of observed and integrated changes on the timing of snowmelt-dominated streamflow for an Arctic headwater basin. We will use data from a long term research watershed in the western Canadian Arctic. In section 2, we describe the study area and observed datasets. In section 3, we focus on several methods on which our analyses are based. Subsequently, we explore the monotonic trends in the timing of snowmelt onset, spring rainfall, and associated springtime streamflow over the study period in section 4. Moreover, we also examine multiple correlations between several timing measures of streamflow and corresponding hydroclimate indicators in order to investigate possible controlling factors. In the final part of the letter, summaries and discussion are provided in section 5.
2. Study domain
2.1. Study area
The western Canadian Arctic, near Inuvik, Northwest Territories, Canada, has experienced well documented climate warming (Bonsal and Kochtubajda 2009, Burn and Kokelj 2009), as well as other related environmental changes, including decreasing precipitation (Bonsal and Kochtubajda 2009), cloud cover (Burn and Kokelj 2009), increasing shrub vegetation (Lantz et al 2012), decreasing snow cover (Lesack et al 2014), warming soil temperature and increasing active layer thickness (Burn et al 2009). However, little is known about the asscociated hydrological impacts. As a first step, this paper will consider changes in the timing of snowmelt dominated discharge in the area.
In this study, we will focus on a long-term headwater research basin—Trail Valley Creek (TVC) as shown in figure 1. TVC has among the longest records of discharge for such headwater basins in Arctic Canada, and also has many years of research data and analysis. TVC is located in an upland region east of the Mackenzie Delta and approximately 50 km north–north of Inuvik (Mike Zubko) Airport (NWT) (68°45' N, 133°30' W). It has a drainage area of 57 km2 (Marsh et al 2008), with the topography dominated by gently rolling hills and some deeply incised river valleys, with elevations ranging from 50 to 180 m above sea level (Marsh et al 2008). This watershed is dominated by tundra vegation (Marsh and Pomeroy 1996), with patches of shrubs and forest. Lantz et al (2012) has demonstrated that the shrub coverage has been increasing over the last few decades. The regional climate is characterized by short summers and long cold winters, and it is rare for air temperatures to rise above 0°C between November and mid-April (Marsh et al 2002). Much of the annual precipitation consists of snow that accumulates over the winter and melts during a brief 1–2 week period in mid-May to early-June (Pohl et al 2007), resulting in an approximately eight month snow covered period from early October to late May (Environment Canada 2012). Over late winter, air temperatures gradually increase and finally rise above 0°C for the first time in late April or early May. This rise above the freezing point is an important indicator as the beginning of the spring snowmelt and runoff period. However, the actual timing of snowmelt is controlled by the surface energy balance.
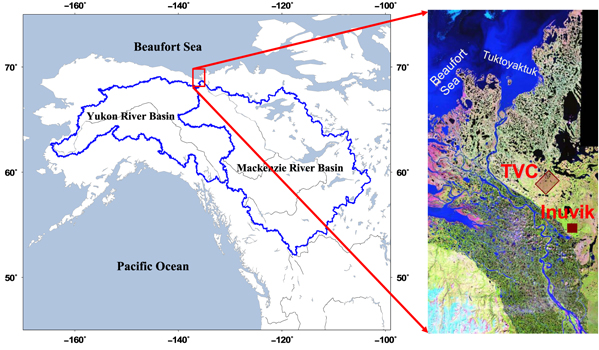
Figure 1. Trail Valley Creek (TVC) is located in an upland region east of the Mackenzie Delta and approximately 50 km north-northeast of Inuvik, Northwest Territories, Canada.
Download figure:
Standard image High-resolution imageAs illustrated in figure 2(a), the TVC annual flow regime is characterized by zero flow from late October to early May, where the stream channel is filled with ice and snow drifts. Flow begins during the spring melt sometime in May, with peak flow occurring in late May to early June. The rest of June is charaterized by reducing snow cover with snow patches removed by the end of June, and declining flows, with occasional rain induced flow events. Due to the thin unfrozen soil layer with high soil moisture typical in May and June, the soil water storage capacity is small and rain events often result in larger flow events than would occur for the same size storm later in the summer. As the soils dry in response to evaporation of July and early August, and changes in the storm patterns, summer streamflow events are typically small in size and occur infrequently (figure 2(a)). Due to the combination of increasing storminess, deeper active layer and decreased evaporation in August and September, larger flow events occur. As air temperature continues to decline, snow begins in mid to later September, the soils begin to freeze, and streamflow ceases during late September or October. As clearly shown in figure 2, the majority of annual streamflow occurs in the period from May 1 to June 30, with 67% of total annual runoff on average. As discussed by Marsh et al (2002), the annual maximum daily flow also always occurs during the May/June period. Flow during this brief period is dominated by snowmelt during the early stages of runoff, mixed snowmelt rainfall events during the middle stages, and rainfall in the later portions of June. As a first step in improving our knowledge of ongoing changes in arctic headwater stream discharge, and since runoff during the two-month snowmelt period dominates annual runoff in terms of both total flow and peak daily flow, this paper will focus on changes in the streamflow timing during this critical snowmelt period.
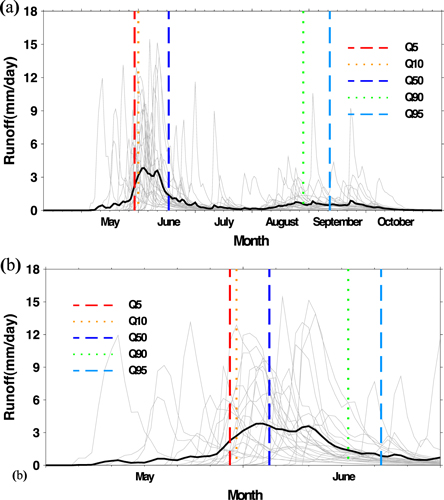
Figure 2. (a) Daily mean runoff (grey lines) in Trail Valley Creek for the study period of 1985–2011. Five streamflow timing measures (Q5, Q10, Q50, Q90, and Q95 for the annual streamflow) are shown for the long-term daily mean runoff (black line); (b) same as above, but for May and June, with the five streamflow timing measures only for this period of the annual discharge record.
Download figure:
Standard image High-resolution image2.2. Data sets
TVC discharge observations used in this study are from the Water Survey of Canada, the federal government agency responsible for streamflow observations in Canada (http://www.wsc.ec.gc.ca/), for the period from 1977 to 2011. Although hourly data are available for much of this period, we will use daily averages and will convert the daily discharge (m3 s−1) to daily runoff (mm) by using the basin area noted above. As there are significant periods of missing data from 1977 to 1984, we will focus on the 27-year period of 1985–2011. This is one of the longest in Arctic Canada and is sufficient to consider the impact of warming on the relationships between changes in climate (air temperature and precipitation) and streamflow timing, although it is a relatively short period of record.
Although the National Water Research Institute of Environment Canada has meteorological measurements at TVC, these are only available since 1992. As a result, we will use meteorological data from the Meteorological Service of Canada (MSC) Inuvik Airport station at approximately 68°45' N, 133°30' W, or 50 km to the South. These data have been shown to be representative of conditions at TVC (Marsh et al 2002, Pohl et al 2007). Routine meteorological measurements and snow survey data are available from this MSC station, including complete data records of air temperatures, precipitation, relative humidity, wind direction and speed, and snow on the ground from 1958 to 2011.
3. Methods
Several methods exist to detect changes in the timing of streamflow (Court 1962). Of these, we will use five robust timing measures (figure 2(b)) that are based on the day for a fixed quantile of spring runoff (May–June flows, not for the entire annual hydrograph) to occur (Moore et al 2007, Burn 2008). For example, the 5 percentile date (Q5) is the day by which the first 5% of spring runoff has occurred. The 10 percentile (Q10), 50 percentile (Q50), 90 percentile (Q90), and 95 percentile (Q95) dates are defined in an analogous manner. The Q50 is similar to the 'date of center of mass of flow' (i.e. centroid) (McCabe and Clark 2005, Stewart et al 2005, Hodgkins and Dudley 2006) that is often used. The dates of Q5 and Q10 are considered to capture changes in the early portions of spring runoff when snow covers much of the basin, while the Q50 date is used to represent mid season and still dominated by snowmelt. Q90 and Q95 include the last components of snowmelt as the final snow drifts are removed, as well as early summer rainfall.
In this study, we will define the onset of snowmelt as the first day after the last five consecutive days when the daily mean air temperature is lower than 0°C (Peterson and Folland 2000, Jiang et al 2011, Li et al 2013). This always occurs in late April or early May. For the timing of spring rainfall, the center of mass date (CMD) was defined as the Julian day on which 50% of the mass of the total May and June rainfall (McCabe and Clark 2005), which is equivalent to Q50 for discharge. To investigate the effect of changes in spring temperature fluctuation after the onset of snowmelt, we will use daily minimum temperature as an indicator of cold night time temperatures, with resulting snow surface freezing and delaying melt runoff after the start of the snowmelt. Such low temperatures have important control on snowmelt and can play an important role in delaying melt and therefore runoff timing (Cazorzi and Dalla Fontana 1986, Jin et al 1999).
To analyze long-term changes in the above noted discharge timing measures, the non-parametric Mann–Kendall (MK) trend test (Mann 1945, Kendall 1975), a rank-based method applicable for trend significance, is used. In addition, the Sen method (Sen 1968) is used to estimate their trend slopes. The MK trend test has been applied in many previous studies for identifying trends in meteorological and hydrologic variables (e.g. Lettenmaier et al 1994, Zhang et al 2001, Burn et al 2004, Déry and Brown 2007, Shi et al 2011, 2013), and has been found to be a reliable method. In this research, trend tests were performed for the timing of snowmelt onset, weekly spring rainfall, and five spring runoff percentiles. Moreover, a 5% significance level (two-sided test) was selected in the trend significance test.
The Pearson's product-moment correlation coefficient was used to assess relationships between five timing measures of springtime streamflow and their corresponding hydroclimate indicators. The correlation is statistically significant at a level of p < 0.025 when its absolute value is greater than 0.32, as the degrees of freedom are 25. Through correlation analyses, it is possible to identify the controlling factors from these corresponding hydroclimate indicators for observed changes in the springtime streamflow timing.
4. Results
4.1. Changes in the dates of snowmelt onset
As shown in Burn and Kokelj (2009), air temperature is increasing in the study region annually, as well as in the winter and in the spirng. An implication of this warming across the winter and spring is that the timing of snowmelt onset (table 1), as determined from the rise of air temperature above 0°C, has also occurred earlier, with an increase of −3.3 days per decade for the period of 1985–2011. This is a similar trend to that of previous studies (Stewart et al 2005, Moore et al 2007, Burn 2008) showing a trend towards earlier start of snowmelt. Over the study period, the total change in snowmelt onset is nearly nine days, and air temperature has a trend of 0.84°C/decade from April to May, with a total increase of 2.27°C.
Table 1. Monotonic trend, mean date, and standard deviation (SD) in snowmelt onset in Trail Valley Creek for the period of 1985–2011, as defined as the first day after the last five consecutive days from April to May with the daily mean temperature lower than 0°C. The significance level (p-value) achieved by two-sided Mann–Kendall test. (the unit is in day/decade for trend slope and in day for total change and SD).
| 1985–2011 | |
|---|---|
| P-value | <0.2 |
| Slope | −3.3 |
| Total change | −9.0 |
| Mean date | May 10th |
| SD | 12.6 |
4.2. Changes in the timing of springtime streamflow percentiles
Although the start of melt occurred earlier during the study period, the streamflow data shows a delay in all five timing measures (table 2 and supplementary figure 1)4 , with stronger trends for Q90 and Q95 than that for Q5–Q50 percentiles. For example, the timing measures of Q5, Q10, and Q50 were delayed from 0.5 to 0.7 days per decade, while the Q90 and Q95 dates were delayed by 1.7–1.8 days per decade, which are almost triple that of Q5, Q10, and Q50 in magnitude and also more significant statistically (p < 0.10). Given the documented warming of end of winter and spring melt air temperatures, these results are unexpected, and require further investigation to better understand the various hydroclimate factors (e.g. total winter snowfall, date of snowmelt onset, freeze thaw events over the melt period, spring rainfall, and spring rainfall timing) resulting in these changes in the timing of springtime streamflow in TVC. Since Q5, Q10, and Q50 are not significant, the data could be interpreted as showing no significant change in the timing of melt runoff. This is also contrary to the significant change towards earlier start of melt and unexpected, so it requires further analysis.
Table 2. Monotonic trends, mean dates, and standard deviations (SD) in five streamflow timing measures (Q5, Q10, Q50, Q90, and Q95) in Trail Valley Creek for the period of 1985–2011. The significance level (p-value) achieved by two-sided Mann–Kendall test. (the unit is in day/decade for trend slope and in day for total change and SD).
| Q5 | Q10 | Q50 | Q90 | Q95 | |
|---|---|---|---|---|---|
| P-value | <0.3 | <0.3 | <0.3 | <0.1 | <0.1 |
| Slope | 0.5 | 0.7 | 0.5 | 1.8 | 1.7 |
| Total change | 1.4 | 1.9 | 1.4 | 4.9 | 4.5 |
| Mean date | May 28th | May 29th | June 3rd | June 15th | June 20th |
| SD | 7.3 | 7.1 | 7.1 | 5.3 | 4.8 |
4.3. Changes in total winter snow and spring rainfall
The mean total winter snowfall from the first snowfall in late September or October until April over the period of 1985–2011 is 105.5 mm SWE. This is the largest water source for spring runoff, about four times the spring (May and June) rainfall (26.1 mm). The trend analysis reveals opposite changes in the total winter snowfall and spring rainfall during 1985–2011. The total snowfall has a statistically significant decreasing trend of 16.8 mm per decade at a significance level of p < 0.025, while spring rainfall has increased by 3.3 mm per decade at a non-significant level. A decrease in winter snowfall would be expected to result in earlier runoff due to both the earlier development of a patchy snowcover and hence higher melt rates earlier in the melt period, and wetting fronts reaching the base of the snowpack earlier in the melt period (Marsh and Woo 1984).
To identify the potential role of spring rainfall in the timing changes of spring streamflow more clearly, we examined the MK trends for weekly spring rainfall. Table 3 summarizes trends, means, and standard deviations of weekly rainfall from May to June in TVC for the study period. For the first four weeks (i.e. all of May or W1–W4), there are no trends and therefore no impact of rain-on-snow on the observed delay in melt runoff. In June, there is a decreasing trend in rainfall for the 5th week (W5), but increasing trends for the following two weeks (W6 and W7). The upward trend in the 7th week (W7) is statistically significant at a 5% significance level. The CMD analysis shows that mean date when 50% of the mass of the total spring rainfall occurred has been delayed about 14 days over the 27 years. This suggests that the change in the timing of streamflow (Q5–Q50) is not due to changes in rainfall, but must be due to changes in other factors controlling snowmelt and runoff. It is possible that the increase in rainfall for both W6 and W7, does affect the Q90 and Q95 flows.
Table 3. Monotonic trends, means, and standard deviations (SD) of weekly (W1–W8) spring rainfall in Trail Valley Creek for the period of 1985–2011. W1 starts on May 1 of each year. The significance level (p-value) achieved by two-sided Mann–Kendall trend test. (the unit is in mm/week/decade for trend slope and in mm/week for mean and SD).
| W1 | W2 | W3 | W4 | W5 | W6 | W7 | W8 | |
|---|---|---|---|---|---|---|---|---|
| P-value | <0.3 | <0.2 | <0.3 | <0.2 | <0.2 | <0.2 | <0.025 | <0.3 |
| Slope | 0.0 | 0.0 | 0.0 | 0.0 | −0.7 | 0.3 | 2.4 | 0 |
| Mean | 0.1 | 1.2 | 1.4 | 4.2 | 3.0 | 3.9 | 7.1 | 5.5 |
| SD | 0.2 | 3.3 | 2.0 | 8.7 | 3.0 | 5.8 | 6.9 | 8.2 |
4.4. Causes of the changes in spring streamflow timing
Figure 3 shows the correlations between the five streamflow timing measures (Q5, 10, 50, 90, 95) and four corresponding hydroclimate indicators (total snowfall, snowmelt onset, spring rainfall, and spring rainfall timing) in TVC for the period of 1985–2011. All the dates of spring runoff percentiles are correlated with the total snowfall, but are not statistically significant. Q5–Q50 are negatively correlated with the total snowfall, meaning that the lower snowfall as descibed in section 4.3 will result in earlier runoff. While Q90 and Q95 are positively correlated, indicating that lower snowfall could result in later runoff for these timing measures. In contrast, the date of snowmelt onset is positively correlated with the timing measures of Q5, Q10, and Q50. Moreover, the correlations (greater than 0.54) are statistically significant at a level of p < 0.025, which show that earlier melt is resulting in a samller runoff delay for Q5, Q10, and Q50. The relationship for snowmelt onset and Q90 is also positive, but not statistically significant. While for Q95, the relationship is negative and close to zero, which is not statistically significant as well. This shows that over the melt period, the relationship between the date of snowmelt onset and the date of streamflow timing changes from statistically significant positive (i.e. Q5, Q10 and Q50) to insignificantly negative (i.e. Q95) at the end of the melt period. This further shows that the earlier snowmelt onset resulted in the minor delay for timing changes of Q5, Q10, and Q50. In all cases, the strong advanced trends in the timing of snowmelt onset imply a consequence of winter–spring warming. Moreover, as shown in figure 3, the changes in spring rainfall and its timing have statistically significant positive correlations with the dates of Q90 and Q95 only. This shows that the increasing rainfall in late June is resulting in the delayed Q90 and Q95.
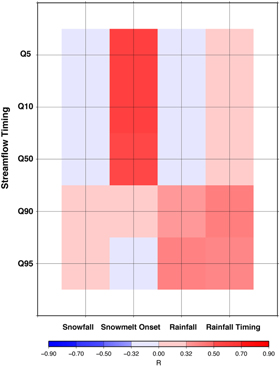
Figure 3. Correlations between five spring runoff timing measures (Q5, Q10, Q50, Q90 and Q95) and four hydroclimate indicators (total snowfall, snowmelt onset, spring rainfall, and spring rainfall timing) in Trail Valley Creek for the period 1985–2011. The correlation is statistically significant at a level of p < 0.025 when its absolute value is greater than 0.32.
Download figure:
Standard image High-resolution imageAlthough an earlier start to snowmelt would be expected to result in earlier runoff, it is possible that an increae in melt freeze events over the melt period, with cold night temperatures, could also delay melt despite an earlier start of the melt period. Table 4 summarizes the MK trends for both weekly mean and standard deviation of Tmin, which show upward or downward trends but are not statistically significant. As shown in table 4, the weekly mean of Tmin is higher than 4.9°C since the second week of June (W6), when snow has basically disappeared. Therefore, we only need to investigate the relationships between the streamflow timing measures and the first five weekly mean and standard deviation of Tmin (W1–W5). Figure 4 shows the correlations between the five streamflow timing measures and five weekly means and standard deviations of Tmin (W1–W5) in TVC for the period of 1985–2011. As showed in figure 4(a), the fluctuations in the weekly mean of Tmin (mainly decreased trends from W1–W4 as shown in table 4) result in a longer melting period, further delay the streamflow timing measures of Q5, Q10, and Q50. Thus, both early snowmelt onsets due to a warming climate and longer melting periods because of spring temperature fluctuation have a significant impact on Q5, Q10, and Q50. For Q90 and Q95, the effects of spring temperature fluctuation are offset due to the opposite trends (table 4) in weekly mean of Tmin for W4 and W5. Therefore, the major controlling factors for Q90 and Q95 are still the spring rainfall and its delayed timing. By comparing the correlations as shown in figures 3(a) and (b), we found that the effect of spring temperature fluctuation on streamflow timing during the snowmelt period is dominated by the weekly mean of Tmin, rather than the weekly standard deviation of Tmin.
Table 4. Monotonic trends and statistics for weekly mean and standard deviation (SD) of Tmin from W1 to W8 in Trail Valley Creek for the period of 1985–2011. W1 starts on May 1 of each year. The significance level (p-value) achieved by two-sided Mann–Kendall trend test. (the unit is in °C/week/decade for trend slope and in °C/week for mean and SD).
| W1 | W2 | W3 | W4 | W5 | W6 | W7 | W8 | ||
|---|---|---|---|---|---|---|---|---|---|
| Mean | −9.3 | −6.0 | −2.6 | 0.8 | 2.7 | 4.9 | 6.7 | 7.9 | |
| Tmin Weekly Mean | SD | 4.1 | 3.4 | 3.2 | 2.8 | 2.2 | 2.7 | 2.7 | 2.0 |
| P-value | — | — | — | — | — | — | — | — | |
| Slope | −0.04 | −0.19 | 1.16 | −0.02 | 0.40 | 0.57 | −0.68 | −0.33 | |
| Tmin Weekly SD | P-value | — | — | — | — | — | — | — | — |
| Slope | 0.004 | −0.125 | 0.175 | −0.117 | 0.142 | 0.200 | −0.200 | −0.086 |
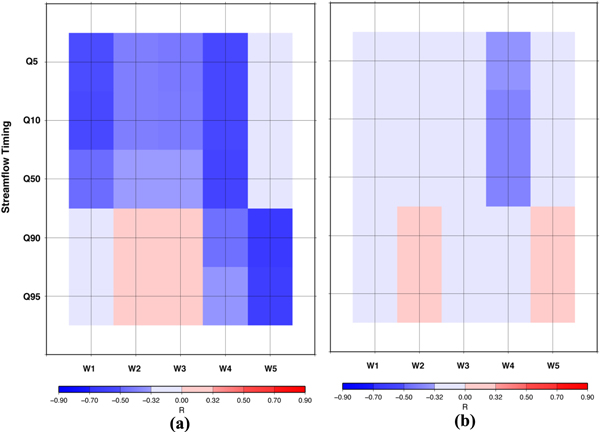
Figure 4. Correlations between five spring runoff timing measures (Q5, Q10, Q50, Q90 and Q95) and weekly (a) mean; (b) standard deviation of Tmin from W1 to W5 in Trail Valley Creek for the period 1985–2011. W1 starts on May 1 of each year. The correlation is statistically significant at a level of p < 0.025 when its absolute value is greater than 0.32.
Download figure:
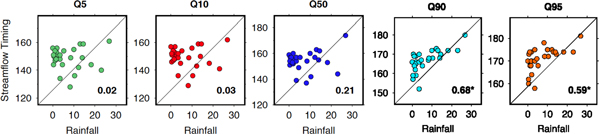
Standard image High-resolution imageIn addition, the scatterplots (figure 5) show the correlations between the five streamflow timing measures (Q5, Q10, Q50, Q90, and Q95) and W7, which dominates the rainfall changes in spring over the study period. Clearly, the W7 in spring has much stronger correlations with the timing measures of Q90 and Q95, which are statistically significant at p < 0.025 (two-sided test). There is no significant correlation between the timing of Q5, Q10, and Q50 and W7 in spring. These findings are consistent with our previous results as shown in figure 3.
Figure 5. Scatterplots of five streamflow timing measures (Q5, Q10, Q50, Q90, and Q95) versus the 7th week rainfall during spring in Trail Valley Creek for the period 1985–2011. (* the correlation with a significant level at p < 0.025).
Download figure:
Standard image High-resolution image
Through these analyses, we can identify a potential mechanism for the controlling factors on the timing changes in spring streamflow in TVC. For the low and middle percentiles of spring runoff, the earlier snowmelt onset and spring temperature fluctuation have statistically significant opposite effects, resulting in a smaller delay for Q5, Q10, and Q50 over the study period. However, this influence was reduced for the timing measures of high percentiles. For the dates of Q90 and Q95, there is a larger delay up to five days in 27 years, which is dominated by increased rainfall in June, rather than temperature fluctuation in spring. Hence, with the future changes in winter–spring air temperature and spring rainfall, this mechanism will hold and become severe with two contradictory directions, resulting in high percentile flows producing much later spring runoff, while low and middle percentile flows generating much earlier spring runoff in TVC.
5. Summary and discussion
As shown in previous studies, TVC has experienced climate warming as well as other related environmental changes, including rapidly changing vegetation with changes in shrubs and active layer depth. To our knowledge, there are no other small watersheds in the Western Canadian arctic with similar vegetation types and sufficient discharge or climate data to test the integrated effects of a warming and drying climate, deeper active layers, warmer soils, and increasing shrubs. Therefore, TVC is unique to consider the impact of these changes.
With the warming climate in TVC, there are unexpected changes in runoff occurring. Using the MK non-parametric trend test, the five timing measures of springtime streamflow from the Arctic headwater research basin have been examined for their long-term trends. As noted in section 4, the dates of Q5, Q10, Q50, Q90, and Q95 exhibit delayed trends for the study period of 1985–2011, demonstrating generally delayed occurrences of the events. However, there are stronger trend signals for the high percentiles (Q90 and Q95) of spring runoff than that for the low and middle percentiles (Q5, Q10, and Q50), indicating that different effects of hydroclimate indicators are working on the timing of springtime streamflow. Correlation analyses have revealed that the increase in spring rainfall and its delayed timing have a significant impact on the dates of Q90 and Q95. Insignificant delays in the Q5–Q50 percentile timing measures are highly related with both earlier snowmelt onset and increased temperature fluctuation in spring, which have opposite effects on the timing changes of Q5, Q10, and Q50. In addition, the total winter snow accumulation is not a controlling factor for the observed changes in the timing of springtime streamflow. Therefore, the earlier snowmelt onset and spring temperature fluctuation are the primary causes for those modest trends in the timing measures of Q5, Q10, and Q50, while the increase in spring rainfall and its delayed timing dominate the significant delay in the dates of Q90 and Q95 in TVC. Moreover, warmer spring air temperatures affect the timing of springtime streamflow through earlier snowmelt onset. All in all, the differences in the timing changes of springtime streamflow can be attributed to the earlier snowmelt onset due to winter–spring warming, temperature fluctuation during the melting period, statistically significant increasing W7 (spring rainfall), and delayed spring rainfall timing in the Arctic headwater basin.
The assessment in this letter has provided evidence for the timing changes in spring snowmelt and associated spring runoff, indicating related changes in air temperature and precipitation, which are causes for the flow regime and timing shifts. As we learned, Arctic air temperature has increased at almost double the global rate for the past several decades with more recent warming appearing strongest in winter and spring (IPCC 2013). Meanwhile, climate models project increases in average air temperatures of 3°C for the Arctic by 2040 (Adam et al 2009). In addition to climate, it would be expected that snowmelt derived streamflow would also be sensitive to a varity of other changes occurring across the arctic, including changes in active layer depth, soil temperature, and vegetation (Zhang et al 2001, Hinzman et al 2005, Romanovsky et al 2007, Serreze et al 2009). Especially, there are significant patches of shrubs and forest in TVC, although it is dominated by tundra (Marsh and Pomeroy 1996). Lantz et al (2012) has demonstrated that shrubs have expanded into tundra areas and the shrub coverage has increased dramatically from 12% to 20% between 1972 and 2004. Apparently, the changes in shrub have an important influence on snow, e.g. shrub patches acting as blowing snow traps and resulting in deeper snow in shrub patches; reduced snow in lee slope snow drifts; and decreased overall snow transport travel distance (less sublimation). So we will get relatively larger SWE, but different SWE distribution across the landscape. Moreover, the spring melt energy balance will be affected as well by increased net radiation at surface and decreased turbulent fluxes, resulting in more rapid snowmelt compared to tundra and bring more uncertainties to the snowmelt controlled streamflow. Thus, the effect of climate change is not the only dominated factor for the changes in spring streamflow regime, including timing. We also need to consider the vegetation change, which could be responsible for the observed changes in spring runoff. Therefore, it raises the question as to what extent the variable spring streamflow timing at TVC is climate-related, vegetation-related, or a combination of changes in climate and vegetation. To understand the complex relationships among climate, vegetation and spring runoff, our next step will focus on the modeling work to tease apart the impact of vegetation on spring streamflow changes using a high-resolution and physically based hydrological model by considering the integrated impacts of shrubs on snow accumulation, melt, and runoff.
Acknowledgments
This work was supported by the Program of Energy Research and Development (PERD) fund to Environment Canada, which is gratefully acknowledged. The authors thank Dr Liming Zhao at AMEC for the preliminary analysis of data used in this study.
Footnotes
- 4
Available at stacks.iop.org/ERL/10/064003/mmedia. Figures show the time series of five springtime streamflow timing measures (Q5, Q10, Q50, Q90, and Q95) and their corresponding trends in Trail Valley Creek for the period of 1985–2011