

Abstract
China's aquaculture industry accounts for the largest share of the world's fishery production, and provides a principal source of protein for the nation's booming population. However, the environmental effects of the nutrient loadings produced by this industry have not been systematically studied or reviewed. Few quantitative estimates exist for nutrient discharge from aquaculture and the resultant nutrient enrichment in waters and sediments. In this paper, we evaluate nutrient discharge from aquacultural systems into aquatic ecosystems and the resulting nutrient enrichment of water and sediments, based on data from 330 cases in 51 peer-reviewed publications. Nitrogen use efficiency ranged from 11.7% to 27.7%, whereas phosphorus use efficiency ranged from 8.7% to 21.2%. In 2010, aquacultural nutrient discharges into Chinese aquatic ecosystems included 1044 Gg total nitrogen (184 Gg N from mariculture; 860 Gg N freshwater culture) and 173 Gg total phosphorus (22 Gg P from mariculture; 151 Gg P from freshwater culture). Water bodies and sediments showed high levels of nutrient enrichment, especially in closed pond systems. However, this does not mean that open aquacultural systems have smaller nutrient losses. Improvement of feed efficiency in cage systems and retention of nutrients in closed systems will therefore be necessary. Strategies to increase nutrient recycling, such as integrated multi-trophic aquaculture, and social measures, such as subsidies, should be increased in the future. We recommend the recycling of nutrients in water and sediments by hybrid agricultural-aquacultural systems and the adoption of nutrient use efficiency as an indicator at farm or regional level for the sustainable development of aquaculture; such indicators; together with water quality indicators, can be used to guide evaluations of technological, policy, and economic approaches to improve the sustainability of Chinese aquaculture.
Export citation and abstract BibTeX RIS

Content from this work may be used under the terms of the Creative Commons Attribution 3.0 licence. Any further distribution of this work must maintain attribution to the author(s) and the title of the work, journal citation and DOI.
1. Introduction
Global fishery production, including both capture and aquaculture, has increased from 18 Tg in 1950 to 183 Tg in 2012 (figure 1(a)), accompanied by rapid growth of aquaculture production from 0.6 to 90 Tg (FAOSTAT 2013). However, more than 90% of aquaculture production occurs in Asia, and China itself has accounted for more than 60% of the global total aquaculture production since the 1990s (FAOSTAT 2013). As one of the greatest contributors to the world's fishery production, China's production increased from around 10% of the world's fishery production before the early 1980s to around 40% of the world's production in 2010, with much of the increase driven by aquaculture. Without the contribution from China's aquaculture industry, its contribution to global fishery production would be 30 percentage points lower than the current proportion, at around 10% of global production (figure 1(a)).
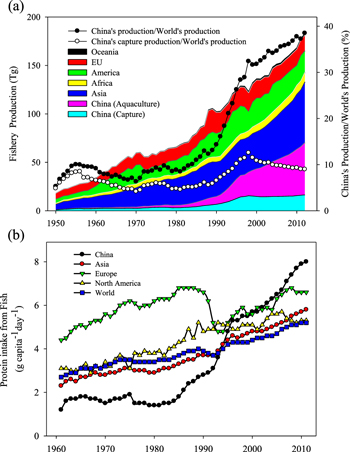
Figure 1. (a) Fishery production in China and the main regions of the world from 1950 to 2012 and (b) daily per capita protein intake from fish in China, Asia, Europe, North America, and the whole world from 1961 to 2011. (Source: www.fao.org/statistics/en/).
Download figure:
Standard image High-resolution imageFishery production contributed significantly to China's food security before the early 1980s, providing nearly one-third of China's dietary animal protein (FAOSTAT 2013). As China's aquaculture industry expanded rapidly, it became the major source of animal protein after 1985 both because it was an important component of the nation's food security plans and because it provided a rich source of high-quality protein, micronutrients, and essential fatty acids (Beveridge et al 2013, Wang et al 2014). Currently, the aquaculture industry accounts for 76% of China's total fishery production, making this industry a dominant actor both in China and on a global scale (CAP 2012). Being the most populous developing country, China's intake of dietary protein from fish, including shrimps, mollusks etc, increased from 1.2 to only 8.0 g capita−1 d−1 from 1961 to 2011 (figure 1(b)). The per capita protein intake from fish is currently 32 and 47% higher than the global and Asian average intakes, respectively. It exceeded the global average in 1994 and became the main driver of the per capita increase globally.
To sustain the rapid growth of this industry, it's necessary to obtain and use nutrient resources efficiently. Nutrient use efficiency, which mostly emphasizes the macronutrients nitrogen (N) and phosphorus (P), is defined as the proportion of all nutrient inputs that are removed in the harvested products, including both crop and animal products (Cassman et al 2002, Arriaga et al 2009, Oenema et al 2009). In general, nutrient use efficiency is much lower for animal products than for crops (Smil 2002, Ma et al 2010). No matter for crops or animals, unused nutrients can be lost to the soil, water, and atmosphere; common mechanisms include loss of N by means of ammonia volatilization, N2O emission, nitrate leaching, and runoff (Oenema et al 2009). Runoff of P is also a major source of non-point-source pollution of aquatic systems (Daniel et al 1998, Ulén et al 2007), which, together with N, can lead to potentially eutrophication of water bodies. Therefore, much attention has been paid to improving nutrient flows and nutrient use efficiency in agriculture, and the impacts of nutrients on the environment have been systematically studied (Rotz et al 2005, Sims et al 2005, Bouwman et al 2013).
However, levels of N and P leakage from aquaculture systems have been insufficiently investigated, although there have been a few studies of feed conversion rates and the associated environmental impacts (Islam 2005, Sarà 2007). Moreover, most of these stopped at the nutrient discharges to water bodies without further studies of gas losses like researches of cropping and animal production dwelling in the land-based systems (Reis et al 2009). Globally, more than 90% of aquacultural production is concentrated in Asia, and this industry plays an essential role in both food security and employment in developing countries (UNEP 2010). The contribution of aquaculture to the total Asian fishery production was more than 60% in 2011, versus values of 11%, 17%, and 15%, respectively, in the United States, Europe, and Oceania (FAOSTAT 2013). The large difference in these proportions means that people in developed regions focus more on the impacts of overfishing and on integrated management (Jørgensen et al 2012, Cohen et al 2013), whereas people in developing regions focus more on aquaculture production. Although the nutrient balances in aquaculture systems have been studied (Jackson et al 2003, Xia et al 2004, Guo et al 2009), the impacts of nutrient discharge from these systems, which represent important sources of non-point-source pollution, have been seriously underestimated (Bouwman et al 2012). It further results the lack of estimation of reactive nitrogenous gas emission happening in the aquacultural systems at the large scale calculations, especially in China which actually contributes more than half of the global production (Zhao and Wang 1994, Zheng et al 2004, Zhang et al 2011).
In China, mariculture in coastal regions and freshwater culture in the middle and lower reaches of the Yangtze River have become important components of aquaculture production (figure 2). The aquaculture area increased from 0.4 × 10⁶ ha in 1954 to 7.8 × 10⁶ ha in 2011, and now provides 50 Tg of products annually in 20% of the country's freshwater and coastal area (CAP 2012). This has greatly improved food security by expanding the aquaculture area and intensifying aquacultural production. Although preliminary studies on the environmental impacts of nutrients released by these systems have been conducted in China (Xia et al 2004, Xie et al 2004, Guo et al 2009, Wu et al 2014), nutrient discharges from aquaculture and their environmental impacts are still poorly understood at the national level.

Figure 2. Aquaculture production of every province in China in 2010, and locations of the aquaculture sites obtained from the research literature. Black dots (sites 1–20) represent mariculture; red triangles (sites 21–48) represent freshwater aquaculture.
Download figure:
Standard image High-resolution imageIn the present study, we performed a comprehensive review of the available studies on nutrient use efficiency in China's aquaculture systems. Our goal was to fully assess nutrient discharges from China's aquaculture systems into surrounding aquatic ecosystems. We also examined the nutrient concentrations in the water and sediments of aquaculture systems and compared these values with data from reference regions without aquaculture pollution to provide a preliminary assessment of the environmental risks of the associated nutrient loadings. The resulting insights will educate the public about the potential seriousness of this problem, and will guide policymakers to develop more sustainable aquaculture.
2. Materials and methods
2.1. Data sources
We obtained data on nutrient conditions in China's aquaculture systems from 51 peer-reviewed publications (supplemental references), which included 75 cases of nutrient use efficiency and nutrient discharge assessment from 26 publications (supplemental tables S1, S2), 240 cases of nutrient concentrations in the water column from 31 publications (supplemental table S3), and 60 cases of nutrient contents in sediments from 15 publications (supplemental table S4). The same results published in different sources (e.g., journals and graduate dissertations) were only cited once, and citations were prioritized in the following order: English journals, Chinese journals, and graduate dissertations. We applied the following criteria to select appropriate studies: (1) N or P inputs from fertilizer or feed and outputs from harvesting must be included in the study's nutrient use efficiency calculation. (2) N or P inputs from fertilizer or feed and outputs from water discharge must be included in the estimated amount of nutrients discharged. (3) We preferred comprehensive information on nutrient inputs and outputs (e.g., inputs from water pumped into the system, juveniles, and rainwater, and outputs from water discharged and harvesting), but did not require this if criteria 1 and 2 were met. The N input from rainfall was calculated based on N deposition data from the same region, which was based on data from Liu et al (2013). (4) Comparisons of nutrient enrichment between aquacultural areas and reference areas were conducted for both the water column and sediments. In this comparison, it was necessary for the study to include N or P concentrations in the water of both aquacultural and reference areas, or N or P contents in the sediments of both aquacultural and reference areas. In this context, 'reference area' refers to regions with environmental conditions similar to those in the aquaculture areas, but without aquaculture impacts; this data included nutrient concentrations in water and contents in sediments from the upper reaches of the rivers that supplied an aquaculture area or in reaches at least 100 m upstream from the aquaculture areas, with data obtained from the same publications.
We divided the case studies into two groups (mariculture and freshwater culture) and four sub-groups (shrimp, fish, mollusks, and crabs). Figure 2 shows the locations of all the data sites, including 20 and 28 sites for the mariculture and freshwater aquaculture included in this study, respectively. The sum of data sites doesn't match the total number of the peer-review publications or the total number of cases for overlaps of different case studies at same sites. We also defined three types of cultural systems: ponds, cages, and pens. Unlike the standard species classification, which uses the categories of crustaceans, fish, and mollusks, we defined four groups of species: shrimp (including prawns and lobsters), fish, crabs, and mollusks. We made this choice based on the availability of reliable Chinese data sources. This classification resulted in the following detailed system groups: shrimp production in ponds in both mariculture and freshwater culture; fish production in ponds or cages in both mariculture and freshwater culture; crabs in pens or ponds in freshwater culture; and mollusks in ponds in mariculture. In practice, mollusks are mainly reared using raft systems, but only data from pond systems were available, and we will discuss the limitations and uncertainties caused by this and other inconsistencies in the data later in the paper. All eight groups were included in our calculation of nutrient discharge, but in our comparison of nutrient concentrations in the water and sediments, only groups with valid data (i.e., data that met the fourth criteria described earlier in this section) were included.
2.2. Nutrient use efficiency
We defined nutrient use efficiency as the percentage difference between nutrients withdrawn from the system by harvesting and contents in the juveniles when they were first introduced into the system as a proportion of the total nutrient inputs. Nutrient inputs were defined as follows:
where It is the total input of N or P, If is the input from feed (fishmeal, forage for herbivores and omnivores, and insects, larvae and small fish for carnivorous fish) and fertilizer (chemical and organic fertilizers to promote plant and plankton growth), Ij is the input from juveniles, Ip is the input from water pumped into the system, and Ir is the input from rainfall, which were negligible for P. We then calculated the N use efficiency (NUE) and P use efficiency (PUE) as follows:
where E is the efficiency (NUE or PUE) and Oh is the output of the corresponding nutrient during harvesting. NUE and PUE were calculated for each case study (supplemental tables S1, S2), and table 1 summarizes the average values for each of the groups defined in section 2.1. All input and output units were obtained as kg ha−1, except for the groups of cages, for which the data was obtained as the kg per cage from the literature lacking of information to convert into the same unit as kg ha−1. But the results of NUE and PUE were not influenced for the percentages without units. It should be noted that NUE and PUE for mollusks were calculated for the whole system in which mollusks were cultivated because the available data was generally for polyculture systems (i.e., for production of more than just mollusks) (supplemental tables S1, S2); however, mollusks were the main species harvested from these systems.
Table 1. Nutrient use efficiency (NUE for N, PUE for P) and associated nutrient discharges in the different aquaculture systems. The raw data used in these calculations and the sources of the data are provided in supplemental tables S1 and S2.
| System | Species group | NUE | If/It for N | NDR | If/It for P | PUE | PDR | Production (Tg)a | Total discharge (Gg) | ||
|---|---|---|---|---|---|---|---|---|---|---|---|
| (%) | (%) | (kg t−1) | (%v) | (%) | (kg t−1) | N | P | ||||
| Mariculture | Pond | Shrimp | 22.3 ± 12.8 (n = 12) | 86.9 ± 9.1 (n = 12) | 35.7 ± 17.8 (n = 7) | 98.0 ± 2.9 (n = 12) | 11.1 ± 6.5 (n = 12) | 5.9 ± 3.6 (n = 7) | 0.9 | 32.0 | 5.3 |
| Fish | 26.9 ± 10.6 (n = 13) | 72.7 ± 24.2 (n = 13) | 8.1 ± 7.8 (n = 9) | 77.1 ± 17.7 (n = 13) | 21.2 ± 12.1 (n = 13) | 3.0 ± 1.2 (n = 13) | 0.5 | 4.2 | 1.6 | ||
| Mollusk | 27.7 ± 12.5 (n = 7) | 53.4 ± 17.7 (n = 7) | 5.4 ± 7.3 (n = 7) | 75.1 ± 25.4 (n = 7) | 18.1 ± 9.6 (n = 7) | 0.5 ± 0.3 (n = 7) | 11.5 | 62.3 | 5.8 | ||
| Cage | Fish | 13.5 (n = 1) | 80.9 (n = 1) | 137.2 (n = 1) | 87 (n = 1) | 8.7 (n = 1) | 14.9 (n = 1) | 0.4 | 60.4 | 6.6 | |
| Sub-total | 13.4 | 159.0 | 19.2 | ||||||||
| Sub-total based on scaled valuesa | 15.5 | 184.0 | 22.2 | ||||||||
| Freshwater Culture | Pond | Shrimp | 21.2 ± 9.1 (n = 7) | 77.5 ± 15.2 (n = 7) | 25.2 ± 17.5 (n = 5) | 87.1 ± 9.3 (n = 7) | 11.1 ± 5.1 (n = 7) | 6.1 ± 5.2 (n = 6) | 1.5 | 38.2 | 9.2 |
| Pond | Fish | 22.9 ± 11.2 (n = 19) | 84.0 ± 9.7 (n = 14) | 20.4 ± 32.1 (n = 17) | 91.0 ± 8.2 (n = 14) | 17.0 ± 7.8 (n = 19) | 3.2 ± 4.0 (n = 13) | 15.3 | 311.5 | 48.9 | |
| Pond or pen | Crab | 11.7 ± 6.0 (n = 10) | 72.6 ± 21.0 (n = 10) | 88.4 ± 176. (n = 10) | 93.2 ± 8.3 (n = 8) | 10.3 ± 16.0 (n = 10) | 11.1 ± 24.5 (n = 8) | 0.6 | 57.4 | 7.2 | |
| Cage | Fish | 24.7 ± 10.2 (n = 6) | 95.8 ± 3.2 (n = 4) | 77.8 ± 14.8 (n = 5) | 97.6 ± 1.8 (n = 5) | 10.0 ± 4.0 (n = 6) | 15.0 ± 13.1 (n = 5) | 4.6 | 360.6 | 69.5 | |
| Sub-total | 22.1 | 767.7 | 134.8 | ||||||||
| Sub-total based on scaled valuesa | 24.7 | 859.8 | 151.0 | ||||||||
| Total | 40.2 | 1043.9 | 173.2 | ||||||||
Note: If, inputs in feed or fertilizer; It, total input; NDR, N discharge rate; PDR, P discharge rate. aAquaculture production was obtained from CAP (2012). The sub-totals for the production of the mariculture and freshwater culture systems in the present study amounted to 86.5% and 89.5% of the total production statistics, respectively, since data for some species or aquacultural systems did not fall into the same categories that we defined in this table. The total nutrient discharge was scaled up using these percentages for species or aquacultural systems without information that met our criteria.
2.3. Nutrient discharge
We defined the nutrient discharge rate as the amount of nutrients discharged per unit of aquaculture production. The nutrient discharge from each of the systems shown in table 1 was calculated by multiplying the average nutrient discharge rate by the total aquaculture production for that system, and the total nutrient discharge from aquaculture equaled the sum of the nutrient discharge from each system:
where DR is the discharge rate for N (NDR) or P (PDR), in kg t−1; D is the output of N or P in water discharged from the system, in kg; and H is the aquaculture production (harvest), in t. Dt is the total discharge of N or P, in Gg; i is the aquaculture group (i.e., all eight systems defined in table 1), and DRi is the discharge rate for each nutrient (i.e., NDR or PDR) in group i. NDR and PDR were calculated for each case study (supplemental tables S1, S2), and table 1 summarizes the average values for each group. Dt for all aquaculture was calculated separately based on 2010 production data (CAP 2012). It should be noticed that the production totals of mariculture and freshwater culture equaled 86.5% and 89.5% of the statistical totals, respectively, which resulted from some species or aquacultural systems not falling into the categories defined in the study. The total nutrient discharge was scaled up using these percentages for species or aquacultural systems without information that met our criteria.
We calculated the two nutrient discharges directly instead of estimating the release based on a feed-conversion rate (Islam 2005, Bouwman et al 2012), because the aquaculture systems had nutrient inputs from multiple sources, and reliable conversion ratios are not available for all sources. We also calculated the ratios of inputs in feed to the total inputs, which ranged from 53% to 87% for N and from 61% to 98% for P (table 1). This suggests that estimating the nutrient release based only on feed inputs would underestimate the discharge budgets. In addition, it is difficult to estimate the rates of 'new nutrients' deposited in sediments and the rates of 'old nutrients' released from the sediments, and directly estimating nutrient discharges in aquaculture water resolved this problem.
2.4. Statistical analysis
We calculated and plotted the nutrient concentrations as total nitrogen (TN) and total phosphorus (TP) both in the water column (supplemental table S3) and in the sediments (supplemental table S4) for both aquacultural and reference areas for each of the systems shown in figures 3 and 4. We carried out Student's t-test for statistical significant differences between aquacultural and reference areas with significance at p < 0.05. Comparisons of nutrient use efficiencies and DRs between sub-groups were also performed by one-way ANOVA as t-test above. However, no significiant difference was found for the NUEs or PUEs of sub-groups.
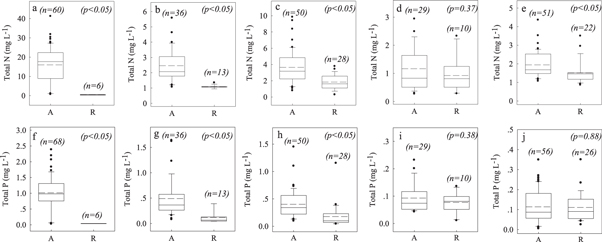
Figure 3. Comparisons of total N and total P concentrations in aquaculture water and reference water: (a), (f) mariculture shrimp pond; (b), (g) freshwater shrimp pond; (c), (h) freshwater fish pond; (d), (i) freshwater crab pens; (e), (j) freshwater fish cage. A = aquaculture; R = reference. Solid lines in the boxes represent median values; dashed lines represent mean values. Boxes represent the 25%–75% percentiles; range bars represent the 5% and 95% percentiles, and dots beyond these bars represent values outside the 95% confidence interval. p values of Student's t-test were listed in each graphs.
Download figure:
Standard image High-resolution image3. Results
3.1. Nutrient use efficiency of the aquaculture systems
Table 1 summarizes the nutrient use efficiency of the aquaculture systems for each group (table 1). NUE ranged from 11.7% to 27.7%, with higher values in mariculture mollusk and fish pond culture systems and lower values in freshwater pond and pen crab culture systems. For the shrimp and fish pond systems, NUE did not differ significantly between the mariculture and freshwater systems. But NUE of the cage systems were higher in freshwater culture than in mariculture. PUE ranged from 8.7% to 21.2%, with a higher value in mariculture fish pond systems and lower values in both mariculture and freshwater fish cage systems. PUE did not differ significantly between mariculture and freshwater culture for both shrimp and fish pond systems. However, unlike for NUE, we found no significant difference in PUE between mariculture and freshwater cage systems. The lowest values of both NUE and PUE were for freshwater crab pens and ponds, which supports our decision to provide separate data for shrimp and crabs (which are normally combined in the crustaceans group).
3.2. Nutrient discharge
Table 1 summarizes nutrient discharge rates for each group. We found significantly higher values of both NDR and PDR in cage systems and in freshwater crab systems, which showed lower values of both NUE and PUE. In the mariculture systems, we found significantly higher nutrient discharge in the mollusk pond and fish cage systems because of the high production for the former and the high DRs for the latter. In freshwater culture, the fish pond systems contributed 62% of the total production but only 36% and 32% of the TN and TP discharge, respectively, whilst the fish cage systems contributed 19% of the total production but 42% and 46% of the TN and TP discharge, respectively.
The TN discharge was 1044 Gg, with 18% (184 Gg) from mariculture and 82% (860 Gg) from freshwater culture. The total P discharge budget was 173 Gg, with 13% (22 Gg) from mariculture and 87% (151 Gg) from freshwater culture (table 1). However, the mariculture group accounted for 39% of total production, versus 61% for the freshwater group, suggesting more intensive nutrient discharge from the freshwater group of culture systems. The highest TN and TP discharges were generally from the cage systems in both mariculture and freshwater culture; the cage systems accounted for 40% of TN and 44% of TP in the total aquaculture nutrient discharge. However, mariculture mollusk pond systems and freshwater fish pond systems also contributed large proportions of the nutrient discharges, but this resulted from higher production rather than higher DRs.
3.3. Nutrient concentrations in aquaculture waters
Figure 3 compares the TN and TP concentrations in the water of the aquaculture systems and in corresponding reference areas. In this analysis, we had enough data to perform the comparison for three pond systems, one pen system, and one cage system. TN and TP in the water were significantly greater in all aquaculture systems than in the corresponding reference systems, except for TN and TP in the crab pen system and TP in the freshwater fish cage system (figure 3). The highest values of both TN and TP were found in the mariculture shrimp pond, with mean values of 16.0 mg N L−1 and 1.0 mg P L−1, respectively, which represented 36 and 26 times the corresponding reference values (figures 3(a) and (f)). TN and TP in the freshwater shrimp pond systems averaged 2.46 mg N L−1 and 0.49 mg P L−1, respectively, versus reference values of only 1.08 mg N L−1 and 0.12 mg P L−1 (figures 3(b) and (g)). TN and TP in the freshwater fish pond systems were similar to those in the freshwater shrimp pond system, at 3.6 mg N L−1 and 0.4 mg P L−1, respectively, versus corresponding reference values of 1.9 mg N L−1 and 0.2 mg P L−1 (figures 3(c) and (h)). TN and TP did not differ significantly from the reference values in the crab pen system (figures 3(d) and (i)). For the freshwater fish cage systems, TN but not TP differed significantly from the reference values (figures 3(e) and (j)).
3.4. Nutrient contents in aquaculture sediments
Figure 4 compares TN and TP in the aquaculture sediments with values in the corresponding reference sediments. We had enough data to compare the reference values with the values for mariculture fish cages, mariculture shrimp ponds, freshwater ponds (polyculture of fish, shrimp, and crabs), and freshwater fish cages. TN values in the sediments of cages systems were significantly higher than those in the reference sediments in ponds and pens systems (figures 4(a)–(d)). TP values in the sediments of all systems were significantly higher than those in the reference sediments excluding the freshwater ponds and pens systems for the only one sample in the reference group without Student's t-test (figures 4(e)–(h)). TN in the aquaculture sediments was 1.6–2.0 times that in the reference sediments, whereas TP in the aquaculture sediments was 1.7–6.4 times that in the reference sediments. The higher values of both TN and TP were found in the cage systems for both mariculture and freshwater aquaculture. TN and TP in the mariculture fish cage systems averaged 2200 mg N kg−1 and 2418 mg P kg−1, respectively, versus reference values of only 963 mg N kg−1 and 489 mg P kg−1 (figures 4(a) and (e)). TN and TP in the freshwater fish cage systems averaged 3023 mg N kg−1 and 657 mg P kg−1, respectively, versus reference values of only 1844 mg N kg−1 and 102 mg P kg−1 (figures 4(d) and (h)). The lower values of both TN and TP were found in the pond systems for mariculture and freshwater aquaculture. TN and TP in the costal shrimp pond systems averaged 443 mg N kg−1 and 627 mg P kg−1, respectively, versus reference values of only 261 mg N kg−1 and 188 mg P kg−1 (figures 4(b) and (f)). TN and TP in the freshwater ponds and pens systems averaged 1977 mg N kg−1 and 450 mg P kg−1, respectively, versus reference values of only 802 mg N kg−1 and 260 mg P kg−1 (figures 4(c) and (g)). These results were converse with the concentrations of TN and TP in water at aquaculture sites, which showed lower concentrations of both TN and TP in open systems such as cages and pens.
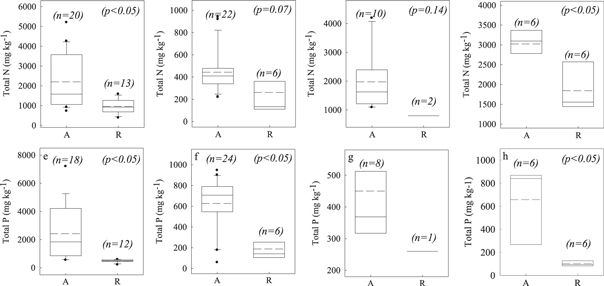
Figure 4. Comparisons of total N and total P contents in aquaculture sediments and the corresponding reference sediments: (a), (e) mariculture fish cages; (b), (f) coastal shrimp ponds; (c), (g) freshwater ponds and pens for fish, shrimp, and crabs; (d), (h) freshwater fish cages. A = aquaculture; R = reference. Solid lines in the boxes represent median values; dashed lines represent mean values. Boxes represent the 25%–75% percentiles; range bars represent the 5% and 95% percentiles, and dots beyond these bars represent values outside the 95% confidence interval. p values of Student's t-test were listed in each graph excluding figure 4(g) with only one sample in the reference group.
Download figure:
Standard image High-resolution image4. Discussion
4.1. Benefits of aquaculture for food security
Fish are excellent sources of protein, with higher protein contents than most other food sources (Beveridge et al 2013), and have high nutritional value. Aquaculture therefore contributes a significant amount of animal protein in many developing countries, especially in Asia (Ahmed and Lorica 2002, Murshed-e-Jahan et al 2010). Fish were the primary source of animal protein in Chinese diets in 1950s and early 1960s (figure 1), accounting for up to 30%–40% of animal protein intake during a period when China's per capita protein intake hadn't reached the lower limit recommended by the World Health Organization (WHO 2007). The consumption of fish protein decreased to around 20% of total animal protein after the late 1980s, but the total consumption tripled (Ghose 2014, Wang et al 2014). However, the proportion of fish protein in China is not as high as it is in other Asian countries such as Bangladesh, Cambodia, and Sri Lanka, where more than 50% of animal protein comes from fish (FAOSTAT 2013); nonetheless, the absolute per capita consumption was 35% higher than the average Asian consumption. Moreover, both the total production and the mean production per unit area of China's aquaculture systems are the highest in the world (Bostock et al 2010).
Fish consumption currently contributes 21% to the total Chinese consumption of animal protein, second only to pork (at 29% of the total); aquaculture contributes 16 percentage points of this 21%, which is comparative to the contribution of eggs and slightly more than the contribution of beef plus milk combined (figure 5). These proportions have potentially important environmental impacts. For example, aquaculture NUE was as high as 21.4%, 5–7 percentage points lower than those of China's main crops (figure 6), and higher than the NUE of livestock production. This means that that aquaculture is more efficient than livestock production in terms of the N consumption required to produce the same amount of animal protein, potentially leading to lower nitrogen losses into the environment. The PUE of both aquaculture and livestock production were higher than those of China's main crops (by more than 4–5 percentage points), but this doesn't mean that animal products use P more efficiently than crops because this estimate does not account for the nutrient use efficiencies of feed production (Smil 2002, Ma et al 2012). For example, the NUE and the PUE of China's fattening pig production was 28% and 27% in 2010, respectively, with about 33–47% feeds from crop products (Bai et al 2014). Considering 27% for the NUE and 12% for the PUE of the crop production (figure 6), the NUE and the PUE were only 7.6% and 3.2% for the chain from feeds to pig production without other feeds taking into account. It meant that the NUEs and the PUEs for both livestock and aquaculture production should be much lower with regards to the nutrient use efficiency of feed production. Although the NUE and the PUE of both livestock and aquaculture production in figure 6 have been overestimated because they do not account for flows of N and P through the whole food chain, these values nonetheless suggest that aquaculture products may be an environmentally superior source of animal protein.

Figure 5. Animal protein consumption as a percentage of the Chinese dietary intake in 2011. Source: FAOSTAT (www.fao.org/statistics/en/).
Download figure:
Standard image High-resolution image
Figure 6. Comparisons of nitrogen use efficiency (NUE) and phosphorus use efficiency (PUE) for the main food production systems in China. Crop nutrient use efficiencies were obtained from Zhang et al (2008); livestock nutrient use efficiencies were obtained from Ma et al (2012). The aquaculture nutrient efficiencies were calculated in the present study.
Download figure:
Standard image High-resolution image
Moreover, China's protein intake from fish increased from 1.7 to 8.0 g capita−1 d−1 in the last half century, and aquaculture increased to supply more than three-quarters of this consumption (FAOSTAT 2013). Considering the current protein intake of Chinese citizens, aquaculture therefore provides an average of 6.0 g protein capita−1 d−1, equivalent to 6.4% of the total daily protein intake (93.8 g capita−1 d−1), which means that aquaculture nourishes 6.4% of the total Chinese population (870 million people) if scaling up the personal daily average protein consumption to the national scale. The protein structure suggests that aquaculture is playing an essential role in China's food security. Simultaneously, the rapid growth of the aquaculture industry has also provided considerable employment and contributed to household income and food security (UNEP 2010, FAOSTAT 2013, Ghose 2014).
4.2. Impacts on eutrophication and related biogeochemical processes
Nutrient discharges from mariculture that we directly estimated based on concentrations in discharge water were consistent with the results modeled based on feed inputs by Bouwman et al (2012). However, there was no reference value available for nutrient discharges from freshwater aquaculture, which were 4.7 and 6.8 times the TN and TP discharges, respectively, in mariculture. In China's first national pollution-sources survey (MEP China's 1st national pollution sources survey (2010)), TN discharged from crop and livestock production totaled 1.60 Gg and 1.02 Gg, respectively; the corresponding TP discharges from the two systems were 0.11 Gg and 0.16 Gg, respectively (table 2). TN and TP discharges from aquaculture were 1.04 Gg and 0.17 Gg, respectively, which were comparable to the TN discharge from livestock production and higher than the TP discharge from both crop and livestock production. Based on the production values for the crop, livestock, and aquaculture systems, NDR of the aquaculture system was 19 and 4 times those of the crop and livestock systems, respectively, whereas PDR was 48 and 4 times the values of the crop and livestock systems. Actually, it could be explained by the difference of dwellings. The crop and livestock systems dwell in the terrestrial ecosystems, and the nutrient unused by harvested products is accumulated in the soil systems at first. Wang (2014) summarized nutrient use efficiency and losses of the cereal production in China in last 2000s, and found 34% of N recovered in the crops and 66% of N lost to atmosphere (mainly through ammonia volatilization and denitrification), water or accumulated in the soil, in which only 13 percentage points lost to the surface and underground water by leaching and runoff. In the livestock production in European Union, only 4% of N lost into water versus 26% lost into atmosphere (Jarvis et al 2011). Although there no gas loss of P, the proportion of P accumulated in the soil systems was 2–6 times that of P lost into waters (Sutton et al 2013). However, all the nutrients unused in the aquacultural systems is directly lost into the water without soil accumulation and gas losses occurring after the discharge. This means that aquaculture production discharged much more pollution into the surface water than the other systems, despite aquaculture's high nutrient use efficiencies. In the middle and lower reaches of the Yangtze River and in southeastern China, where aquaculture is concentrated, aquaculture contributed between 9% and 54% of TN and between 13% and 33% of TP in the total non-point-source pollution (Jiang et al 2006, Chen et al 2007, Huang et al 2008, Liu et al 2010, Ma et al 2013). These discharges directly increase the risks of eutrophication.
Table 2. Comparisons of total discharge and discharge per unit production by China's different agricultural systems.
| Agricultural system | Productionc (Gg) | TN | TP | ||
|---|---|---|---|---|---|
| Total discharge (Gg) | NDRd (kg t−1) | Total discharge (Gg) | PDRd (kg t−1) | ||
| Cropsa | 1161.8 | 1.60 | 1.38 | 0.11 | 0.09 |
| Livestockb | 148.3 | 1.02 | 6.91 | 0.16 | 1.08 |
| Aquaculture | 40.2 | 1.04 | 26.00 | 0.17 | 4.31 |
aCrops include cereals, fruits, and vegetables. bLivestock includes meat, milk, and eggs. cCrop and livestock production data were obtained from FAOSTAT (2013). dNDR, nitrogen discharge ratio; PDR, phosphorus discharge ratio.
Besides eutrophication, this nutrient enrichment could also create other environmental risks. In the cycling of reactive N, exchanges of N species occur both in separate layers, such as water and sediments, and at the water-atmosphere interface and the water-sediment interface, leading to losses of nitrogenous gases. Different with the gas losses occurring in the terrestrial ecosystems in cropping and livestock systems, N losses of aquacultural systems reach to waters at first with gas losses happening there after. Hu et al (2013) measured N2O emissions from an experiment with intensive aquaculture of Chinese catfish (Clarias fuscus), and found that 1.3% of the N input was lost in the form of N2O, which is produced by both nitrification and denitrification processes. This provides important support for the possibility that aquaculture may exacerbate climate change, since N2O is a powerful greenhouse gas. Thoman et al (2001) evaluated the N losses as N2 from denitrification in recirculating red drum (Sciaenops ocellatus) aquaculture systems, and found a potential loss of 9–21% of TN. Thus far, there has been no experimental proof of high levels of ammonia volatilization from aquaculture systems, but this could happen if the  concentration increases greatly and the temperature range and pH are suitable for promoting ammonia volatilization (Hargreaves 1998). Such losses of N as NH3 may be as high as 30% of TN in intensively managed shrimp ponds (Lorenzen et al 1997). Xia et al (2004) estimated N losses based on the difference between N inputs and outputs, and suggested that N losses through NH3 volatilization and denitrification in China's Taihu Lake could reach 62% of the TN input into the ponds. Although P cycling mostly happens in the sediment and water, without gaseous losses, the enrichment of P and N and their altered stoichiometry could further change ecosystem biomass production, structure, species richness, and even succession (Güsewell 2005, Lapointe et al 2005, Smith 2006, Verhoeven et al 2006, Sorrell et al 2011, Deegan et al 2012, Currie et al 2014). These changes will have additional, unforeseen effects that should be identified in future research.
4.3. Limitations and uncertainties of the present study
First, important uncertainties in our analysis result from a lack of adequate information due to the limited number of studies of nutrient cycling in Chinese aquaculture. Despite the seemingly large number of studies that we cited, we were not able to satisfactorily separate the data into relevant sub-groups based on the type of system (e.g., mariculture versus freshwater, different species groups). Nutrients discharged from cages in both mariculture and freshwater systems accounted for 45% of the TN and 49% of the TP, but these estimates were based on a limited number of case studies. Second, our study was limited to eight systems, divided into two categories (mariculture versus freshwater) of aquaculture system, and the production from mariculture and freshwater culture totaled only 87% and 90%, respectively, of the values in statistical databases. This means that the nutrient discharge rates were applied to the remaining 13% of the total mariculture and 10% of the total freshwater production. Much of this production would have occurred in creeks and paddy rice fields, for which we lack information on the fate of the nutrients. Third, information on mollusks was only available from polyculture pond systems that also included fish, shrimp, or seaweed cultivation. Mollusks are the main species in these systems, but the NUE and PUE were calculated for the whole system rather than independently for mollusks, which increased uncertainties in the estimates for mollusk aquaculture. In addition, raft systems contributed a large proportion of the production of mollusks, but we could not obtain reliable data on this system, leading to further uncertainties. Last, but not least, freshwater aquaculture in small lakes and reservoirs (areas usually ranging from 10 to 40 ha) without cages is a popular alternative to cage aquaculture. With direct inputs of feed and fertilizer into these lakes and reservoirs, a practice that is banned in some regions, nutrient release into the water and sediments may be more serious than in the cage aquaculture systems, although research will be required to support this hypothesis. Taken together, these uncertainties mean that it was difficult to accurately quantify the total nutrient discharges. This suggests that representative farms of production systems missing in this analysis need to be monitored during a full production cycle, as to fill in the gaps in the database.
4.4. Suggestions
It is predicted that aquaculture will continue to play an important role in securing China's food security, and may play an increasingly important role in the future (Delgado et al 2003, Bostock et al 2010, Merino et al 2012, Jones et al 2014, Wang et al 2014). However, negative effects related to the nutrient discharges described in the present study, such as eutrophication, emission of greenhouse gases, and other potential environmental impacts that we have not mentioned (e.g., effects on the biodiversity of aquatic species), should be taken into account. Therefore, one fundamental suggestion that arises from the present study is the need to develop more sustainable and environmentally friendly aquaculture by improving nutrient use efficiency and reducing the environmental risks, while simultaneously meeting challenges of both food security and employment. As China currently hosts the world's largest aquaculture industry, integrated management and proper policy development will be required to regulate this industry.
In open aquaculture systems, such as cage systems and systems based on lakes or reservoirs without cages, the use of highly digestible feed and a proper feeding strategy will be essential to control the sources of nutrient pollution. Under the Chinese national standards (http://cx.spsp.gov.cn/index.aspx?Token=$Token$&First=First), the lower limit for the N content in the formulated diets produced by the feed production industry for different fish and shrimp species average 5.3% and ranged from 4% to 7.5%, which are comparable to values in other countries (Gross et al 2000, Mazón et al 2007, Wasielesky and Abreu 2013). Thus, the N contents of formulated diets in the national standard guidelines appear to be suitable. However, the lower limits for P content are 1.2% and 1.0%, respectively, for mariculture and freshwater aquaculture, and these limits are 11 to 33% higher than the limits applied in other countries (Mazón et al 2007, Wasielesky and Abreu 2013). Therefore, it appears that there is considerable room to decrease the P content of aquaculture feed materials in China. In addition, large amounts of animal manure are applied by fish-farmers, even in reservoirs where this practice is forbidden by both national and local governments. Because there is little information available on fertilizer and manure inputs into aquaculture systems in China (Hall et al 2010), it has been necessary to rely on anecdotal evidence from experts. Based on this unreliable evidence, it is possible to provide a preliminary estimate that should be confirmed in future research. For example, chicken and pig manure are commonly used in these systems, and the N and P contents of these manures are about 2.2% and 1.6%, respectively (Li et al 2009). Moreover, P is less soluble in water than N and easily forms salts that precipitate at the bottom without gas losses like N by volatilization and denitrification. These may explain the large difference in P content in sediments between aquacultural and reference areas, and may explain why this difference is greater than that for N contents.
For closed aquacultural systems, such as ponds, nutrient retention and waste treatment will be more effective to reduce the direct discharge of nutrients. Modern technologies are available to improve water purification and waste treatment, such as recirculating aquaculture systems and closed-loop production systems, which can enable continuous water purification by filtering and recycling the wastewater, and these systems can also produce concentrated sludge that can be used as agricultural fertilizer (Martins et al 2010). Constructed wetlands are another option for processing aquaculture effluents, as these ecosystems have high nutrient capture and retention (Li et al 2011, Buhmann and Papenbrock 2013, Dunne et al 2013). For the solid wastes derived from aquaculture, up-flow geotextile filters can be applied to capture the nutrients, followed by treatment in denitrification reactors for N and by filtration through polymer filter for P (Verdegem 2013). In addition, there are many traditional hybrid agricultural-aquaculture models available in China, such as growing mulberry bushes in fish ponds, and cultivating fish in rice paddies and water lily ponds (Zhou et al 2004, Chen 2006, Wu 2012). These systems provide excellent nutrient capture and recycling models. However, these older systems have been gradually been abandoned as aquaculture shifted towards intensive production to increase yields and decrease labor costs.
In addition to improving feed quality and waste treatment, we strongly recommend increased adoption of aquatic polyculture, and especially forms such as integrated multi-trophic aquaculture (IMTA), in which management focuses on multiple trophic levels (plants, herbivores, and carnivores) simultaneously. In fact, polyculture began in China and is still in common use to achieve high aquacultural productivity by improving utilization of the available food sources and space (Romanowski 2006, Stickney 2013, Wang et al 2014). Chinese examples include mixtures of Chinese carp, fish or shrimp with seaweed, and shellfish with seaweed cultivation. However, IMTA goes beyond such traditional polyculture, which is limited to a single co-culture system. IMTA can include various combinations of fed species (fish and shrimp) with extractive species (mollusks and seaweed) in a serial connection, so that the wastes and other products of one component of the system become inputs for the other components. This can increase commercial harvest values and improve ecosystem health by developing a design that takes advantage of the biological and chemical processes that occur between the trophic levels of such artificial ecosystems (Barrington et al 2009, Troell et al 2009). Mollusks and seaweed can take up the nutrients discharged by the fed fish or shrimp, thereby reducing environmental risks by decreasing nutrient loss from the overall system (da Silva Copertino et al 2009, Sarà 2009, Domingues et al 2014). In China, there have been many explorations of the potential of IMTA (Zhou et al 2006, Mao et al 2009, Huo et al 2012, Shi et al 2013), but scientific research on these systems has been less popular than research on the polyculture systems currently being applied by farmers.
Last but not least, we recommend that technology groups work together with the policy-development community to develop more integrated approaches that provide fish-farmers with access to more modern technologies. Nutrient use efficiency represent the effective harvest of nutrients by cultured species, while DR represents ineffective harvest and discharge to the aquatic environment. Higher nutrient use efficiency values and lower DRs usually exist simultaneously, indicating less costs for both economy and environment. Therefore, nutrient use efficiency could be used as a powerful indicator to improve aquacultural production and reduce environmental pollution. It could also be used as a way to improve economic benefits for fish-farmers. Monitoring of the environmental impacts of aquaculture and trends in NUE and PUE should be promoted by the development and enforcement of appropriate legislation. The prohibition of manure and fertilizer use in reservoirs and lakes should be continued, but this will only be effective if the laws are enforced. Long-term monitoring of water quality should be implemented to detect nutrient overloading, and appropriate corrective measures, including punishments for violators of existing laws, should be implemented. More attention should be paid to developing aquacultural systems with higher nutrient use efficiency. It is not only limited by aquaculture industry, but also at farm or regional level, such as building up agricultural-aquacultural systems, which could reuse the nutrients by recycling water and sediments. Subsidies should be considered to compensate fish-farmers for the cost of adopting improved technologies to protect the environment. Demonstrations of technologies that balance economic and environmental benefits can be an effective way to transfer knowledge and technologies to fish-farmers, and should be widely implemented in China's main aquaculture regions. Good examples would include demonstrations of hybrid agricultural-aquacultural models that emphasize the nutrient reuse and the production of high-value species, combined with organic production systems and tourism activities, particularly if the models can decrease labor costs or improve yield and income. In general, a combination of economic, technical, and social strategies will be important to encourage sustainable development of China's aquaculture industry by encouraging widespread participation by fish-farmers.
Acknowledgments
We thank Dr Andre Clewell, formerly of Florida State University, for his comments and assistance reviewing a previous version of this manuscript, and the two anonymous reviewers for their valuable comments and suggestions that have greatly improved the manuscript. This study was supported by the International Science & Technology Cooperation Program of China (2012DFA91530), the Fundamental Research Funds for the Central Universities (TD-JC-2013-2; BLX2012022), and the 1st Youth Excellent Talents Program of the Organization Department of the Central Committee of China.