

Abstract
In the Arctic, climate change manifests with the strongest warming trends on the globe, especially in the cold season. It is under debate if climate extremes change similarly strong. Our study provides detailed regional information about two selected temperature extreme indices in the Arctic, namely warm and cold spells in winter and summer. We analyze their temporal evolution and variability from 1979–2013, based on daily station data and ERA-Interim reanalysis. Calculated trends from both datasets suggest a widespread decrease of cold spells in winter and summer of up to −4 days/decade, with regional patches where trends are statistically significant throughout the Arctic. Winter trends are spatially heterogeneous, the reanalysis also shows small areas with statistically significant increases of cold spells throughout Siberia. Calculated changes in warm spells from both datasets are mostly small throughout the Arctic (less than ±1 day/decade) and statistically not significant. Remarkable exceptions are the Lena river basin in winter with a statistically significant decrease of up to −1.5 days/decade and areas in Scandinavia with statistically significant increases of up to 2.5 days/decade in winter and summer (again from both datasets). From the analysis of spell lengths, we find that there are no shifts from longer to shorter spells or vice versa with time, but long cold spells (events lasting for more than 15 days) disappear almost completely after the year 2000. There is a distinct inter-annual and decadal variability in the spells, which hinders the detection of significant trends for all spell categories in all regions.
Export citation and abstract BibTeX RIS

Content from this work may be used under the terms of the Creative Commons Attribution 3.0 licence. Any further distribution of this work must maintain attribution to the author(s) and the title of the work, journal citation and DOI.
1. Introduction
Driven by multiple positive feedbacks within the Arctic climate system, climate warming there is stronger than the global average (Serreze and Barry 2011, Stroeve et al 2012). This phenomenon, called Arctic Amplification, is prominent in the annual and seasonal near-surface air temperature increase. Mean annual near-surface air temperature in the Arctic is now more than 1.5 °C higher than the 1971–2000 average, which is more than two times of the global warming during the same period (Overland et al 2013).
This warming is not spatially homogenous; air temperature trends vary enormously with geographic location. Bekryaev et al (2010) made a huge effort to create an extensive station data set of homogenized monthly near-surface air temperature for the Arctic. Their results show temperature trends between −2 °C/decade and +2 °C/decade for the period 1979–2008, depending on geographical location and season. Similarly, analysis of near-surface temperature trends from satellite data (Comiso and Hall 2014) and from reanalysis (Simmons et al 2014) emphasize that Arctic temperature trends are spatially very heterogeneous.
However, climate change is not restricted to mean temperature but also expresses itself in changes of temperature extremes. Knowledge about Arctic extremes themselves and their development are of high societal relevance. For example, changes of ice-free periods, storminess and associated wave heights (e.g., Khon et al 2014) impact coastal erosion, navigation and on/off-shore engineering. Changes in extreme temperature and precipitation (e.g., Matthes et al 2009, Rinke et al 2012, Glisan and Gutowski 2014) impact permafrost conditions, erosion and related infrastructure. Still, regional trends of Arctic weather and climate extremes are largely unknown.
The most common assessment of extreme events follows the climate extreme indices defined by the Expert Team on Climate Change Detection and Indices (ETCCDI; http://etccdi.pacificclimate.org/). Calculation of these indices requires the use of daily minimum and maximum temperature data, which are even less available than monthly averages of daily mean temperature in the data-sparse Arctic. Global analysis of temperature extremes is based on gridded observational data sets such as HadEX2 (Donat et al 2013). HadEX2 data have rather coarse resolution (2.5° × 3.75°). In the Arctic, they are difficult to interpret and may be biased since most stations are located in coastal areas. Sillmann et al (2013a) investigated additionally to HadEX2 a set of reanalysis data (ERA-40: 2.5° × 2.5°, ERA-Interim: 1.5° × 1.5°, NCEP/NCAR: 2.5° × 2.5°), which also have quite coarse resolution. Thus, while such global studies can estimate changes in Arctic extremes using regional averages over high northern land (such as over Greenland, Alaska, Northern Europe, North Asia; Sillmann et al 2013a, Sillmann et al 2013b), the important aspect of reliable regional-scale information cannot be provided.
The aim of our study is to deliver detailed regional information about two selected temperature extreme indices in the Arctic, namely changes in warm and cold spells, which can cause severe ecological disturbance with great challenges for infrastructures (Rennert et al 2009, Hansen et al 2013). Our focus is on the two extreme seasons, on winter where Arctic amplification is greatest and thus we might expect pronounced changes in extreme weather events, and on summer where Arctic amplification is modest in contrast. Warm spells are calculated as warm spell duration index (WSDI) and cold spells as cold spell duration index (CSDI). Covering the time period from 1979 to 2013, we present regional patterns and trends of WSDI and CSDI, consistently calculated based on a circum-Arctic station data set and ERA-Interim reanalysis. Specifically, the following questions are addressed: Have warm and cold spells changed over the past 35 years? What are the characteristics of their changes (frequency of occurrence, length and severity)? Are the changes spatially homogeneous? Are warming/cooling trends coherently represented in both extremes? Do the trends in these extremes agree with the trends in mean temperature?
2. Data and method
2.1. Datasets
For the analysis of warm and cold spells, the station dataset 'Global Summary Of the Day' (GSOD) from the National Climatic Data Center (http://www.ncdc.noaa.gov/) is used. It provides homogenized data of daily mean, minimum and maximum temperatures from more than 9000 stations around the world. We use 1304 of those stations situated on land north of 60° N (supplementary figure S1). Some of them provide only a single season within our analysis period from 1979–2013, others contribute several or even the complete 35 years.
To supplement the station data and provide enhanced spatial coverage in the data-sparse Arctic region, we use the ERA-Interim atmospheric reanalysis from the European Centre for Medium-range Weather Forecasts (Dee et al 2011, http://www.ecmwf.int/en/research/climate-reanalysis/era-interim) in its native resolution (ca. 0.75° or 80 km; T255 spectral). The direct comparison of ERA-Interim with station data allows us to assess the ability of the reanalysis to capture warm and cold spells, therefor it is possible to conclude where the reanalysis can complement the station data. As our focus is on 2 m air temperatures over land, we consider ERA-Interim the most valid reanalysis dataset, as it is the only one that directly assimilates station-based 2 m air temperature measurements. Other key advantages include the improved model physical parameterisations, a better hydrological cycle, four-dimensional variational data assimilation and bias correction of satellite radiance data. ERA-Interim depicts more realistic Arctic tropospheric temperatures and probably suffers less from spurious trends than any previous reanalysis data sets as discussed by Screen and Simmonds (2010). As shown by Chung et al (2013), ERA-Interim biases in the Arctic concerning surface and upper air temperatures are comparable to other reanalysis products.
2.2. Extreme Temperature Indices
In the following analysis we use two climate indices defined by the ETCCDI. Warm spell duration index in a specific season is defined as the sum over the number of consecutive days where the daily maximum temperature exceeds TX90, with a minimum length of six days. TX90 is the 90th percentile calculated from a five-day running mean of the daily maximum temperature of the reference period 1980–2010. Cold spell duration index in a specific season is defined as the sum over the number of consecutive days where the daily minimum temperature is below TN10, with a minimum length of six days. TN10 is the 10th percentile calculated from a five-day running mean of the daily minimum temperature of the above mentioned reference period.
2.3. Analysis method
For the purpose of this study, we consider the Arctic to be the region north of 60°N. Warm and cold spells are calculated for each grid cell of the ERA-Interim data and for each station for the period of 1979–2013 for winter (December, January, February) and summer (June, July, August). Only individual seasons with full daily data coverage were included during the station analysis. From the resulting time series, trends are calculated using least-squares regression. As the time series from station data contain missing years, calculated trends may be biased due to an uneven data distribution in the time series (e.g. all years with data could be within the first 15 years of the time series). To avoid this, the full period is divided into two sub-periods, 1979–1995 and 1996–2013, and a trend for a station is shown only if both periods contain at least 5 years of data each. This amounts to around 250 stations for both seasons and indices. Station trends may then still be biased as they are in the most extreme case based on a subset of only 10 out of 35 possible years. A bootstrapping approach according to Kiktev et al (2003) is applied for evaluating statistical significance of the obtained trends, with significance assigned to the 95% confidence level (supplementary A). In addition to the magnitude of significant trends, the 95% confidence interval (2.5% and 97.5% percentiles) is given. In the following, the term significance always refers to statistical significance.
In addition to the spatial results, we analyze the time series of the spells for 4 different geographical sub-domains: (i) Northwestern Eurasia (Northern Europe and Northern Russia west of the Ural Mountains; including islands in the Arctic Ocean east of 10°W and west of 60° E), (ii) Northeastern Eurasia (Northern Eurasia east of the Ural Mountains), (iii) Alaska, and (iv) Canada (continental Canada and the Canadian Archipelago). All occurring spells from stations in a specific geographical subdomain and a specific year are sorted into categories depending on their length (see below) and the sums are then divided by the number of contributing stations. Results for a specific year are shown if at least 10% of the stations in the region have data. No weighting was applied accounting for heterogeneity in the distribution of stations in the subdomain. The resulting time series is therefore geographically biased towards areas with high station density. Spell events are sorted into three categories: short events (6–10 days), medium events (11–15 days) and long events (longer than 15 days). Trends are calculated for each category separately. As for the spatial analysis of spells, bootstrapping is used to determine significance of the calculated trends at the 95% confidence level. To assess the changes in the variability of the spells, we also calculate the coefficients of variation (CV) for the time series of all events relative to an 11-year running mean. Resulting values are assigned to the window center. The result is shown if at least 6 years within the 11-year window have data. The temporal evolution of those CV gives an estimate of the decadal variability of the spells.
3. Results
3.1. Spatial patterns of trends in spells
3.1.1. Cold Spells (CSDI)
Winter trends in CSDI mostly show a decrease (i.e. a perceived warming) throughout the Arctic, with maximum changes of −4 days/decade (figure 1(a)). The high 'warming' trends over Scandinavia (Norway, Sweden), Canada and Central Siberia (highest trends near the Lena river basin) are statistically significant based on ERA-Interim and station data. In northern Alaska, strong significant warming trends occur from ERA-Interim data. The changes in many other regions are smaller (up to −2 days/decade) and statistically insignificant. In general, trends derived from both datasets have the same sign. Figure 1(a) suggests that the spatial extension of significantly diminished cold spells over Central Siberia and near the coasts of East Siberia and Alaska in the ERA-Interim data set is larger than seen from station data. Furthermore, southern Central and East Siberia are characterized by a significant increase in cold spells (2–2.5 days/decade) based on ERA-Interim. Due to the sparse data availability, these 'cooling' trends cannot be confirmed by station data.
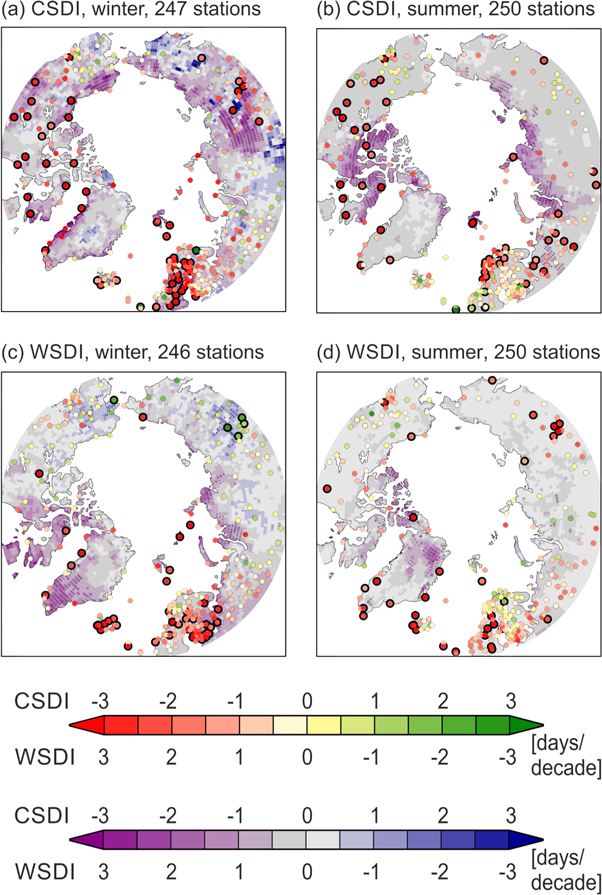
Figure 1. Trends in cold spell days (CSDI; top row) and warm spell days (WSDI; bottom row) for winter (left column) and summer (right column) over the time period 1979–2013. Colored circles show results from GSOD station data, associated color-coding is explained in the top color bar. Shading shows results from ERA-Interim data, associated color-coding is explained in the bottom color bar. For both color bars the numbers on the top refer to CSDI, numbers on the bottom refer to WSDI. Stations with trends found significant at the 95% confidence level are marked with a black circle around the colored station circle, while significant trends from ERA-Interim are marked with black dots. Only stations with data coverage of at least 5 years within 1979–1995 and at least 5 years within 1996–2013 are used for this figure (see section 2.3).
Download figure:
Standard image High-resolution imageIn summer (figure 1(b)), calculated trends suggest a general decreases in cold spells over the Arctic both from station data and ERA-Interim. Based on the reanalysis, the strongest and significant CSDI decrease occurs over the coastal areas in Siberia and the Canadian Archipelago, with trends of up to −2.5 days/decade, which is supported by the station data. Additionally, the station analysis shows significant warming trends over continental Canada. The reduction of cold spells over Scandinavia is much less pronounced in summer than in winter (again from station and reanalysis data) and only statistically significant for some stations in northern Norway. Central and southern Siberia do not show significant changes. Similarly to winter, station data show a small (insignificant) increase of cold spells over parts of Alaska.
3.1.2. Warm spells (WSDI)
Station data (colored circles, figures 1(c) and (d) suggest that in winter and summer, warm spells increase for most of the European and western Russian stations, with trends of up to 2.5 days/decade and statistically significant trends over Scandinavia. Additionally, a statistically significant increase in warm spells is found over southern Siberia (Lena river basin, 4 stations) in summer. Contrary, a statistically significant decrease of warm spells of up to −2.5 days/decade is found there in winter (4 stations). Stations in the western Arctic show both increases and decreases in warm spells with strong regional variation for both seasons and both datasets, trends are mostly not statistically significant.
In the eastern Arctic, the ERA-Interim trends (shading in figures 1(c) and (d)) for warm spells capture the significant increase in northern Russia and decrease in southern Siberia in winter shown in the station data. A larger area of significantly decreasing warm spells over Alaska is suggested. ERA-Interim data-derived trends suggest that warm spells have not changed in summer throughout most of the Arctic, with trends between −0.5 days/decade and +0.5 days/decade. The only exceptions are parts of the Canadian Archipelago and northern Greenland, with significant increases in warm spells of up to 2 days/decade. The station-derived positive trends indicating an increase of warm spells over large parts of Scandinavia, most of western Russia and southern Siberia are not reproduced by ERA-Interim.
3.2. Temporal evolution of spells
In the following, the GSOD based time series of the averaged number of cold spells (figure 2) and warm spells (figure 3) for winter and summer for the 4 chosen geographic regions are discussed. Figure 4 shows the coefficients of variations for warm and cold spells for analysis of their temporal variability.
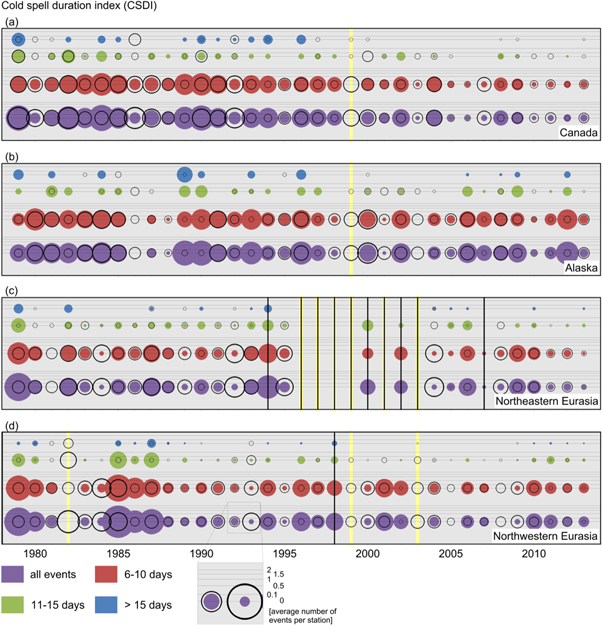
Figure 2. Time series of cold spell days (CSDI) for the four geographic regions Northwestern Eurasia, Northeastern Eurasia, Alaska and Canada for winter and summer. The four categories of CSDI events are color-coded for winter. The same categories are depicted by open black circles for summer. The radii of the circles represent the average number of events per station; horizontal lines refer to 0, 0.1, 0.5, 1, 1.5 and 2 average number of events per station for the categories all events and short events. Lines at 1, 1.5 and 2 average number of events per station are omitted for medium and long events. Years with missing values are marked with vertical yellow lines for winter and vertical black lines for summer.
Download figure:
Standard image High-resolution image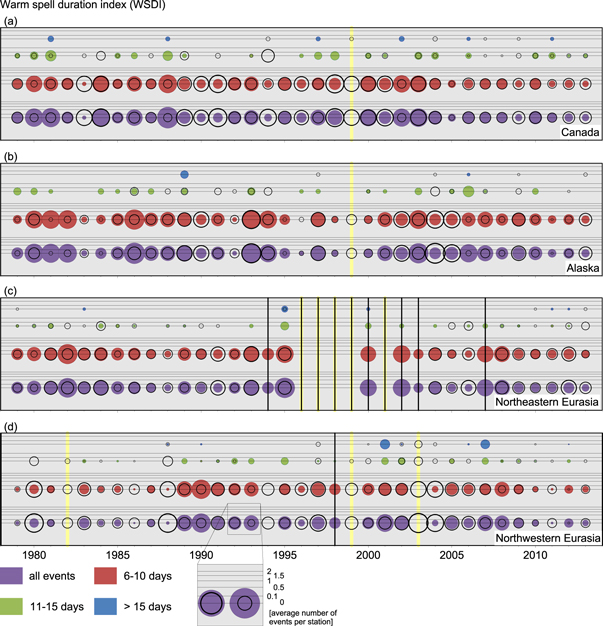
Figure 3. As figure 2, but for warm spell days (WSDI).
Download figure:
Standard image High-resolution image
Figure 4. Variability of cold spell days and warm spell days in winter (colored bars) and summer (open black bars) for the four geographic regions Northwestern Eurasia, Northeastern Eurasia, Alaska and Canada. Bars represent the coefficient of variation (CV) of a 11-year window centered at the respective year. Years with more than 5 years of missing data in the 11-year window are not shown and marked with a yellow (black) vertical line for winter (summer).
Download figure:
Standard image High-resolution image
3.2.1. Cold spells (CSDI)
In winter, all regions show similar occurrences of cold spell events in all categories (table 1), with climatological means considering all events ranging from 0.44 to 0.53 average number of events per station (abbreviated as events/station from here on). Figure 2 indicates that the events per station ranges across the regions and within the 35-years from zero to 0.5 for long cold spells (blue circles, figure 2), from zero to 0.6 for medium cold spells (green circles, figure 2) and from zero to 1.5 for short cold spells (red circles, figure 2), respectively. A general decline of cold spell events for all categories in the Arctic is obvious. Calculated trends are negative for all regions in all spell categories (table 2). Considering all events, trends range from −0.09 ± 0.04 (Northeastern Eurasia) to −0.24 ± 0.08 (Canada) average events per station/decade and are found statistically significant for all regions. The geographical regions show distinct features in the specific spells categories decline. Especially long cold spells (blue circles, figure 2), disappear almost completely with the beginning of the 2000 s. Medium and short cold spells (green and red circles, figure 2) decline strongly (and mostly statistically significant) over Northwestern Eurasia and Canada, while the decline is less pronounced over Northeastern Eurasia and Alaska. All regions show a pronounced decadal variability of cold spells (figure 4). An increase in variability is found for Canada (figure 4(a)).
Table 1. Climatological mean (1979–2013) of the average number of events/station.
| Cold spell days (CSDI) | ||||||||
|---|---|---|---|---|---|---|---|---|
| winter | summer | |||||||
| all events | 6–10 days | 11–15 days | >15 days | all events | 6–10 days | 11–15 days | >15 days | |
| Canada | 0.50 | 0.40 | 0.07 | 0.04 | 0.41 | 0.32 | 0.06 | 0.02 |
| Alaska | 0.53 | 0.41 | 0.07 | 0.04 | 0.30 | 0.27 | 0.03 | 0.01 |
| NE Eurasia | 0.46 | 0.36 | 0.08 | 0.02 | 0.38 | 0.33 | 0.05 | 0.01 |
| NW Eurasia | 0.44 | 0.35 | 0.07 | 0.01 | 0.29 | 0.24 | 0.04 | 0.01 |
| all Arctic | 0.40 | 0.32 | 0.06 | 0.02 | 0.31 | 0.25 | 0.04 | 0.01 |
| Warm spell days (WSDI) | ||||||||
| winter | summer | |||||||
| all events | 6–10 days | 11–15 days | >15 days | all events | 6–10 days | 11–15 days | >15 days | |
| Canada | 0.33 | 0.28 | 0.05 | 0.01 | 0.36 | 0.32 | 0.04 | 0 |
| Alaska | 0.37 | 0.33 | 0.04 | 0 | 0.26 | 0.23 | 0.03 | 0 |
| NE Eurasia | 0.31 | 0.29 | 0.02 | 0 | 0.30 | 0.25 | 0.04 | 0 |
| NW Eurasia | 0.23 | 0.20 | 0.02 | 0.01 | 0.30 | 0.26 | 0.03 | 0.01 |
| all Arctic | 0.24 | 0.21 | 0.02 | 0 | 0.25 | 0.21 | 0.03 | 0 |
Table 2. Trends for the period 1979–2013 in average number of events per station/decade. Significant trends (95% confidence level) are marked with an asterisk. Numbers behind significant trends refer to the 95% confidence interval (2.5% and 97.5% percentiles).
| Cold spell days (CSDI) | ||||||||
|---|---|---|---|---|---|---|---|---|
| winter | summer | |||||||
| all events | 6–10 days | 11–15 days | >15 days | all events | 6–10 days | 11–15 days | >15 days | |
| Canada | −0.24 ± 0.08* | −0.17 ± 0.06* | −0.05 ± 0.04* | −0.03 | −0.17 ± 0.06* | −0.12 ± 0.05* | −0.04 | −0.02 |
| Alaska | −0.1 ± 0.05* | −0.07 | −0.01 | −0.02 | −0.05 ± 0.05* | −0.05 | −0 | −0 |
| NE Eurasia | −0.09 ± 0.04* | −0.06 | −0.02 | −0.01 | −0.08 ± 0.04* | −0.07 | −0.01 | −0 |
| NW Eurasia | −0.19 ± 0.06* | −0.14 | −0.05 ± 0.05* | −0.01 | −0.1 ± 0.05* | −0.06 | −0.02 | −0.01 |
| all Arctic | −0.16 ± 0.05* | −0.12 ± 0.05 | −0.03 | −0.01 | −0.1 ± 0.04* | −0.07 | −0.02 | 0 |
| Warm spell days (WSDI) | ||||||||
| winter | summer | |||||||
| all events | 6–10 days | 11–15 days | >15 days | all events | 6–10 days | 11–15 days | >15 days | |
| Canada | −0.06 ± 0.06* | −0.05 ± 0.04* | −0.01 | 0 | −0.01 | −0.01 | −0.01 | 0 |
| Alaska | −0.06 ± 0.04* | −0.05 | −0.01 | 0 | −0.03 | −0.03 | −0 | 0 |
| NE Eurasia | −0.03 | −0.03 | −0 | 0 | −0.03 | −0.02 | −0.01 | 0 |
| NW Eurasia | −0.02 | −0.01 | −0 | 0.01 | −0.01 | −0.01 | −0 | 0 |
| all Arctic | −0.01 | 0.01 | −0.01 | 0 | 0 | 0 | 0 | 0 |
In summer, cold spells are less frequent than in winter for all regions and categories of spells (table 1). Figure 2 shows that long cold spells (black circles on blue circles) occur very rarely in summer; only Canada and Northwestern Eurasia (figure 2(a) and (d)) show a distinct number of years where such events occur (up to 0.3 events/station). Medium cold spells (black circles on green circles, figure 2) occur in all regions and range from zero to 0.55. Like in winter, short cold spells (black circles on red circles, figure 2) occur most often. The average number of events per station ranges from zero to 0.75. All regions show similar ranges for the frequency of these events. The decline of cold spell events for all categories is as obvious as in winter. Again, trends considering all events are found statistically significant in all regions (ranging from −0.05 ± 0.05 in Alaska to −0.17 ± 0.06 in Canada events per station per decade; table 2), but are smaller than winter trends. The number of long cold spells clearly declines for both Northwestern Eurasia and Canada, but changes are hard to report over Northeastern Eurasia and Alaska, also due to limited occurrence of these events. Calculated trends are not statistically significant (table 2). Cold spells of medium length also decrease except for Alaska (no trend), but again, trends are not statistically significant. Short events become less frequent for all regions, with the strongest and only statistically significant reduction occurring for Canada. Similar to winter, all regions show a pronounced decadal variability of cold spells (figure 4) with no obvious tendencies of increasing or decreasing variability except for Northeastern Eurasia. There, an increase in CV is found.
3.2.2. Warm spells (WSDI)
In winter, the occurrence of warm spells is decidedly less frequent than the occurrence of cold spells for all regions. The climatological mean ranges from 0.23 (Northwestern Eurasia) to 0.37 (Alaska) events/station considering all events (table 1). Long warm spells are extremely rare for all regions. They occur in only 2–7 out of 35 years (blue circles, figure 3). The number of events per station ranges from zero to 0.18, with Northwestern Eurasia being the only region with larger events (0.18 in 2001 and 0.16 in 2007). Medium warm spells (green circles, figure 3) regularly occur over all regions. Their numbers range from zero to 0.24 average events/station. Short warm spells (red circles, figure 3) occur most often with events/station between zero and 0.8. All regions show similar ranges for the occurrence of such events. In the Arctic as a whole, the changes in the occurrence of warm spells are decidedly smaller than for cold spells (table 2). In winter, no changes for long warm spells can be detected in any region. The year-to-year variability of short and medium length spells is large throughout the whole time series. The calculated small trends are positive for Northwestern Eurasia and otherwise negative; only the short warm spells trend for Canada is found statistically significant (with −0.05 ± 0.04 events per station/decade). While in general the variability of warm spells in summer is similar in all regions (figure 4), decadal variability is especially pronounced in Northwestern Eurasia (figure 4(d)). This region exhibits a strong decline of the CV until 1998 which is then followed be a slight increase until the end of the time series.
In summer, the characteristics of long warm spells (open black circles on blue circles, figure 3) are the same as in winter. They are rare (occur in 4–7 out of 37 years) and the number of events per station is small (0–0.12). Medium warm spells (open black circles on green circles, figure 3) occur more often than in winter for all regions except Alaska and cover a range between zero and 0.35 events/station, with similar ranges in frequency for all regions. Short warm spells (open black circles on red circles, figure 3) occur in all years and for all regions and can reach a maximum occurrence of 0.71 events/station. Northeastern Eurasia (figure 3(c)) experiences a smaller inter-annual variability in the occurrence of short warm spells than the other regions. Calculated trends are very small for all categories of events (between −0.01 and 0.03 events per station/decade, table 2) for all regions; positive and negative trends occur, none of the trends are found statistically significant. Variability of warm spells in summer is comparable to the variability in winter (figure 4). Decadal variability is larger for Alaska (figure 4(b)) and Northwestern Eurasia (figure 4(d)) then for Canada (figure 4(a)) and Northeastern Eurasia (figure 4(c)). For Northwestern Eurasia, the same decadal-scale variability as in winter is found (decrease of variability in the first 3 decades and then an increase until 2013).
4. Discussion and conclusions
For both warm and cold spells, significant warming and cooling is found over the period 1979–2013, from station data and ERA-Interim reanalysis. In the following discussion, statements refer to station data as well as reanalysis data if not stated otherwise.
In summer, 'warming trends' (decrease of cold spells, increase of warm spells) are more moderate than in winter. From the reanalysis data, the trends are more regionally heterogeneous in winter than in summer for both warm and cold spells. While the summer is dominated by 'warming trends' in both extremes, significant regional 'cooling trends' (increase of cold spells, decrease of warm spells) are found in winter. The ERA-Interim data show significant winter 'cooling' for warm and cold spells over regions of Siberia and for warm spells over Alaska. Those trends are confirmed by station data for WSDI, although they are not statistically significant. The regional patterns of 'warming' and 'cooling' trends are neither similar between warm and cold spells (considering a specific season) nor between winter and summer (considering one index). This emphasizes the complexity of the temporal development of the spells in the Arctic.
Considering the Arctic mean temperature development for 1979–2013, warming is stronger in winter (up to 2 K/decade) than in summer (up to 1 K/decade, supplementary figure S2). Our finding of less pronounced summer 'warming' compared to winter 'warming' in warm and cold spells is in accordance with both the mean temperature trends and the finding that cold extremes are warming faster than extreme warm temperatures (Screen 2014). In summer and winter, the 'warming trends' (decrease) in cold spells are stronger than the 'warming trends' (increase) in warm spells in accordance with the stronger rise in Arctic minimum temperatures compared to maximum temperatures. Further, the observations show a regional cooling over Northeastern Eurasia in mean temperature in winter in recent years (up to −2 K/decade for 1979–2013, supplementary figure S2). This cooling has been discussed to be associated with the recent Arctic summer sea-ice decline (see reviews of Vihma 2014 and Cohen et al 2014). Our identified areas of decreasing warm spells in winter correlate well with the region of cooling from mean temperatures. By contrast, the regions with increasing cold spells are shifted geographically in comparison to the mean temperature cooling. It is also apparent that the recent winter cooling is stronger for cold spells (larger increase) than for warm spells (smaller decrease).
In the analysis of averaged time series of cold and warm spells for four different geographical regions, warm spells are in general found to be less frequent than cold spells, especially in winter. As warm and cold spells are calculated from similar 'extremes' of the temperature distribution, namely the 90th and the 10th percentiles, this means that extremely cold days cluster more frequently than extremely warm days. This may be due to the fact that persistent high pressure systems in the winter Arctic may cause extremely cold temperatures (e.g. Cohen et al 2001, Jeong et al 2011), while extremely warm temperatures in winter are caused by travelling cyclones on decidedly shorter timescales (e.g. Zhang et al 2004, Francis and Vavrus 2012, Screen et al 2013). In accordance, the time series analysis shows that in summer, the occurrence of cold spells depends stronger on the geographical region than in winter (table 1) when high pressure persistently dominates over the land. This is in contrast to the rather homogeneous spatial summer and heterogeneous winter trend patterns of CSDI, and indicates that the occurrence of cold spells is dominated by regional circulation patterns like the storm tracks in Northwestern Eurasia and Alaska.
In the Arctic as a whole, the changes in the occurrence of warm spells are decidedly smaller than for cold spells in winter and in summer. The decline in cold spells considering all spell events is found statistically significant for all regions and both seasons, while few sub-categories (short cold spells in Canada in summer and winter, medium cold spells in Northwestern Eurasia and Canada in winter) show significant negative trends. The occurrence of warm spells has not remarkably changed within the last 35 years for both seasons and all regions. Small increases or decreases in spell events are found for specific event categories and regions, but there are no uniform tendencies. The only significant trends considering all events occur in winter for Alaska and Canada, and both indicate 'cooling' (decrease of warm spells). We quantified the changes in the frequency of occurrence of both cold and warm spells, but we could not detect any changes in their severity. There are no regions (neither for cold nor for warm spells) where within the categories, significant trends with different signs are found. Therefore we conclude that there are no shifts from longer to shorter events or vice versa with time.
The variability analysis of warm and cold spells shows comparable variability for all regions in both spells. With the exception of Alaska, warm spells CV are somewhat larger in winter than in summer. Cold spells behave differently. Additionally, there is pronounced decadal variability for all regions and seasons in both spells. A distinct tendency in the temporal evolution of the CV throughout the whole time series is only found for winter cold spells in Canada and summer warm spells in Northwestern Eurasia, indicating that for most regions, changes in the spells themselves have not led to changes in variability.
Conclusively, we find that spells show pronounced inter-annual and decadal variability, which complicates the analysis of their trends. Even though the changes in warm and cold spells show similarities to changes in mean temperatures, they cannot be deduced from those changes. Thus their separate analysis is important when discussing changes in extreme temperature events.
Acknowledgments
This work was supported by the Helmholtz Climate Initiative REKLIM. We acknowledge the European Centre for Medium-Range Weather Forecast (ECMWF) for providing the ERA-Interim reanalysis. We thank the two anonymous reviewers for their valuable comments that helped to improve our manuscript.