

Abstract
Climate models indicate a future wintertime precipitation reduction in the Mediterranean region but there is large uncertainty in the amplitude of the projected change. We analyse CMIP5 climate model output to quantify the role of atmospheric circulation in the Mediterranean precipitation change. It is found that a simple circulation index, i.e. the 850 hPa zonal wind (U850) in North Africa, well describes the year to year fluctuations in the area-averaged Mediterranean precipitation, with positive (i.e. westerly) U850 anomalies in North Africa being associated with positive precipitation anomalies. Under climate change, U850 in North Africa and the Mediterranean precipitation are both projected to decrease consistently with the relationship found in the inter-annual variability. This enables us to estimate that about 85% of the CMIP5 mean precipitation response and 80% of the variance in the inter-model spread are related to changes in the atmospheric circulation. In contrast, there is no significant correlation between the mean precipitation response and the global-mean surface warming across the models. It follows that the uncertainty in cold-season Mediterranean precipitation projection will not be narrowed unless the uncertainty in the atmospheric circulation response is reduced.
Export citation and abstract BibTeX RIS

Content from this work may be used under the terms of the Creative Commons Attribution 3.0 licence. Any further distribution of this work must maintain attribution to the author(s) and the title of the work, journal citation and DOI.
1. Introduction
Mediterranean countries critically depend on the rainfall falling during the cold season for their agricultural and societal needs. This makes the region prone to water stress conditions, and highly susceptible to rainfall deficits in the year to year variability. This precarious hydrological balance is projected to further deteriorate because of anthropogenic climate change, as climate models indicate a future reduction in Mediterranean precipitation and increased soil aridity in response to increasing greenhouse gas concentrations (Giorgi and Lionello 2008, Alessandri et al 2014). Furthermore, gauge-based reconstructions indicate that a negative wintertime precipitation trend has already occurred in the 20th century (Hoerling et al 2012). However, the extent that anthropogenic climate change has contributed to the observed trend is still unknown due to uncertainties in the observational record in the early part of the century and limited knowledge of the amplitude of internal climate variability on multi-decadal to centennial timescales (Hoerling et al 2012, Kelley et al 2012a, 2012b, Mariotti et al 2015).
Adaptation planning to this scenario of increasing water stress conditions would be made much easier and less costly if there was increased confidence in the amplitude of the Mediterranean precipitation reduction. However, different global climate models project substantially different precipitation responses to a given scenario of future greenhouse gas concentrations and this constitutes the largest source of uncertainty in the Mediterranean precipitation projections by the end of the 21st century (Giorgi and Lionello 2008). Reducing this uncertainty ultimately requires a better understanding of the mechanisms controlling Mediterranean precipitation under climate change.
The thermodynamic increase in lower tropospheric specific humidity due to surface global warming is expected to directly impact moisture fluxes and precipitation regardless of any changes in atmospheric circulation. In particular, this thermodynamic mechanism generally leads to wet regions getting wetter and dry regions drier (Held and Soden 2006). However, changes in atmospheric and oceanic circulation can also globally impact precipitation, for example by affecting the location of extratropical storm tracks, the meridional extent of the Hadley cell circulation or by altering sea surface temperature patterns (e.g. Seager et al 2010, Chadwick et al 2013). Climate model projections indicate a future increase in the Mediterranean mean surface pressure, an increase in the frequency of anticyclonic circulation, and a weakening of the local Mediterranean storm track (Lionello and Giorgi 2007, Rojas et al 2013, Seager et al 2014, Zappa et al 2015a). These changes suggest that the atmospheric circulation response to climate change might lead to a future reduction in Mediterranean precipitation, which was supported by analyses of the Mediterranean moisture budget (Seager et al 2014) and of the precipitation change associated with Mediterranean cyclones (Zappa et al 2015a). Consistently, Polade et al (2014) notes that it is a change in the number of dry days, rather than in the mean precipitation per rainy day, which most contributes to the precipitation reduction in the subtropics, including most of the Mediterranean area.
This work explores the potential to use the atmospheric circulation response to climate change to estimate the Mediterranean precipitation response in individual climate models. This enables us to evaluate the role of atmospheric circulation as a source of uncertainty in the Mediterranean precipitation projections. In particular, for each model participating in the fifth phase of the Coupled Model Intercomparison Project (CMIP5), we investigate the relationship between Mediterranean precipitation and atmospheric circulation in the inter-annual variability, and use this relationship to estimate the precipitation change related to the atmospheric circulation response. A similar approach has already been applied to evaluate the role of atmospheric circulation for the wintertime precipitation response in California (Chang et al 2015) and for the summertime European precipitation response (Bladé et al 2012, van Haren et al 2015), but it has not previously been applied to analyse the Mediterranean area in the cold season.
2. Data and methods
35 CMIP5 coupled climate models (Taylor et al 2012) are analysed in this study (see table 1). For each model, the climate change response is evaluated as the difference between a 30-year time mean in the RCP8.5 scenario (2070–2099) minus a 30-year mean in the historical simulation (1976–2005), and all the available ensemble members are considered in order to better sample the model climate statistics. The European Centre for Medium Range Weather Forecasts Interim Reanalysis (ERA-Interim) and the Global Precipitation Climatology Project (GPCP) dataset are used to characterize the monthly mean atmospheric circulation and precipitation in the real world, both for 1979–2013.
Table 1. List of CMIP5 models considered in the study. For each model the number of analysed runs in the HISTORICAL (HIST) and RCP8.5 simulations are indicated.
| Basic information | # runs | |||
|---|---|---|---|---|
| Model name | Institution | HIST | RCP8.5 | |
| 1 | ACCESS10 | CSIRO-BOM, Australia | 1 | 1 |
| 2 | ACCESS13 | 3 | 1 | |
| 3 | BCC-CSM1-1 | BCC, China | 3 | 1 |
| 4 | BCC-CSM1-1m | 3 | 1 | |
| 5 | BNU-ESM | BNU, China | 1 | 1 |
| 6 | CCSM4 | NCAR, USA | 6 | 6 |
| 7 | CESM1-CAM5 | NSF-DOE-NCAR, USA | 3 | 3 |
| 8 | CESM1-WACCM | 4 | 3 | |
| 9 | CMCC-CESM | CMCC, Italy | 1 | 1 |
| 10 | CMCC-CM | 1 | 1 | |
| 11 | CMCC-CMS | 1 | 1 | |
| 12 | CNRMCM5 | CNRM, France | 5 | 3 |
| 13 | CSIRO-mk360 | CSIRO, Australia | 10 | 10 |
| 14 | CanESM2 | CCCma, Canada | 5 | 5 |
| 15 | EC-EARTH | European Consortium, Europe | 5 | 5 |
| 16 | FGOALS-G2 | LASG, China | 4 | 1 |
| 17 | FIO-ESM | FIO, China | 3 | 3 |
| 18 | GFDL-CM3 | GFDL, USA | 5 | 1 |
| 19 | GFDL-ESM2G | 1 | 1 | |
| 20 | GFDL-ESM2M | 1 | 1 | |
| 21 | GISS-E2H | NASA GISS, USA | 5 | 1 |
| 22 | GISS-E2R | 5 | 1 | |
| 23 | HadGEM2-ES | MOHC, UK | 4 | 4 |
| 24 | HadGEM2-CC | 3 | 3 | |
| 25 | INMCM4 | INM, Russia | 1 | 1 |
| 26 | IPSL-CM5A-LR | IPSL, France | 5 | 4 |
| 27 | IPSL-CM5A-MR | 3 | 1 | |
| 28 | IPSL-CM5B-LR | 1 | 1 | |
| 29 | MIROC-ESM | MIROC, Japan | 3 | 1 |
| 30 | MIROC-ESM-CHEM | 1 | 1 | |
| 31 | MIROC5 | 5 | 3 | |
| 32 | MPI-ESM-LR | MPI–M, Germany | 3 | 3 |
| 33 | MPI-ESM-MR | 3 | 1 | |
| 34 | MRI-CGCM3 | MRI, Japan | 3 | 1 |
| 35 | NORESM1-m | NCC, Norway | 3 | 1 |
The time mean zonal wind velocity at 850 hPa (U850) is used to quantify the climate change response in the atmospheric circulation. U850 is linked to the eddy driven jet and storm track activity (Woollings et al 2008) and, as shown in this paper, it well characterizes the atmospheric circulation associated with wintertime Mediterranean precipitation. Both the climate change response and the relationship between U850 and precipitation in the internal climate variability are evaluated for the 6-month November–April time mean. Zappa et al (2015b) show that this temporal average is optimal to maximize the ratio of the U850 climate change response (the signal) to the noise due to internal climate variability in the Euro-Atlantic sector in the cold season, as well as that of precipitation over the Central European and Mediterranean regions. Zappa et al (2015b) also show that the climate change response (in 30-year means) in these fields relative to 1960–1990 will emerge within the next decade (by 2025) according to the models with a strong response. All the data has been first interpolated to a common low resolution T42 grid, using bilinear interpolation for U850 and using a conservative remapping method (Jones 1999) for precipitation.
3. Results
Figure 1(a) shows the extended winter (November–April) mean precipitation response to climate change in the CMIP5 multi-model mean. As in previous analyses (e.g. Collins et al 2013), precipitation is projected to increase in Europe north of the Alps, and to decrease in most of the Mediterranean area, particularly close to Gibraltar and in the East Mediterranean region, e.g. Southern Turkey and the Middle-East. Both the increased precipitation to the north and the reduced precipitation to the south are robust in terms of inter-model agreement, with at least 90% of models showing a response of the same sign (stippling). However, models show substantial differences in the amplitude of the precipitation reduction. To visualize these differences, figures 1(b) and (c) show the multi-model mean precipitation response of the 20% of models with the largest and smallest precipitation change area-averaged within the box indicated in figure 1(a). A factor of about 3.5 is found on average between the Mediterranean precipitation response in the two sets of models. As will be shown in figure 4(b), the differences in the model responses mainly represent differences in the forced response rather than the effect of internal climate variability.
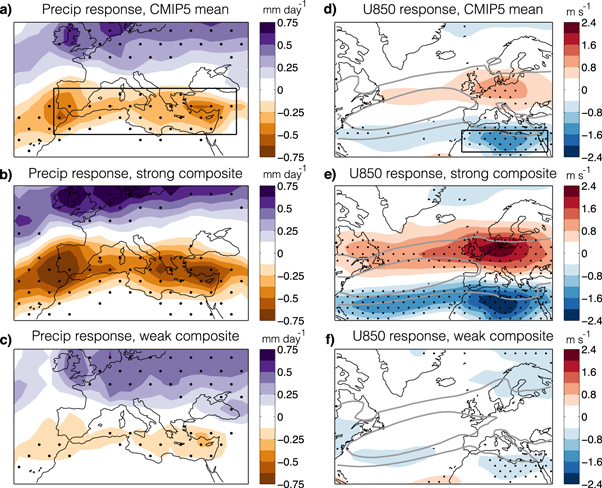
Figure 1. (a) Multi model mean CMIP5 end-of-century precipitation response (RCP8.5-Historical) in NDJFMA. (b), (c) as (a) but for the mean precipitation response of the 20% of models with the largest (b) and smallest (c) precipitation reduction area-averaged in the Mediterranean area (see box in (a)). (d)–(f) as in (a)–(c) but for the mean response in the zonal wind velocity at 850 hPa (U850). In each panel, stippling indicates 90% inter-model sign agreement on the direction of change. In (d)–(f) the grey contours show the 4 (outer) and 8 (inner)  isotachs of the zonal wind at 850 hPa in the mean of the historical simulations (1976–2005).
Download figure:
Standard image High-resolution imageFigure 1(d) shows that the multi-model mean U850 response in the extended winter is characterized by a dipole between Central Europe, where the westerly zonal wind tends to increase, and North Africa, where it tends to decrease. Note that this zonal wind response implies an increased anticyclonic and/or decreased cyclonic mean circulation in the Mediterranean area (Rojas et al 2013, Seager et al 2014). High inter-model agreement (stippling) on the direction of change is found in North Africa and, to a lesser extent, in Central Europe. By stratifying the models according to their Mediterranean precipitation response, figure 1(e) shows that the mean of the models with a strong Mediterranean precipitation reduction (as defined in figure 1(b)) is characterized by a U850 response with a pattern similar to that of the multi-model mean but twice the amplitude, and by more extended inter-model agreement. In contrast, figure 1(f) shows that the models with a weak Mediterranean precipitation response (as defined in figure 1(c)) have on average a very weak U850 response to climate change, with high inter-model agreement limited to the westward wind change in North Africa. This association in the inter-model spread between the Mediterranean precipitation and U850 responses is consistent with an influence of atmospheric circulation on future cold season Mediterranean precipitation (Hoerling et al 2012, Seager et al 2014, Zappa et al 2015a).
The westward wind change in North Africa is the only U850 multi-model mean signal which persists in the mean of the CMIP5 models with a weak Mediterranean precipitation reduction (figure 1). This suggests that U850 in North Africa might be dynamically linked to Mediterranean precipitation and a useful diagnostic to explain the precipitation change. To test this, we evaluate the impact that U850 circulation anomalies in North Africa have on Mediterranean precipitation in the inter-annual variability. In particular, we define  as the area-averaged Mediterranean precipitation (see box in figure 1(a)) in year i and model m, and we define
  as U850 area-averaged in North Africa (see box in figure 1(d)), both in the historical simulations. Therefore, the inter-annual anomalies in the present day climate are given by


where the overbar is the time mean in the historical period (1976–2005).  is plotted against
  for all the CMIP5 models and years pooled together in the scatterplot of figure 2(a) (black dots). The two quantities are found to be strongly related (r = 0.86), with higher Mediterranean precipitation falling in the years characterized by more westerly zonal winds in North Africa. Furthermore, a similar relationship between Mediterranean precipitation and U850 in North Africa is also found in the real world data (figure 2(b)).
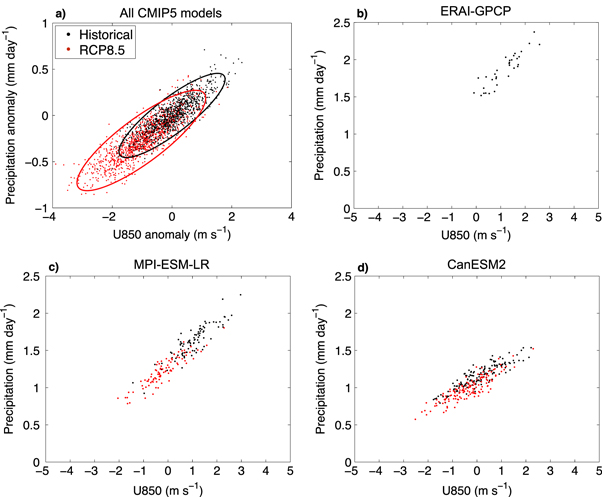
Figure 2. (a) Scatter plot of the yearly anomalies in the NDJFMA area-averaged Mediterranean precipitation versus the yearly anomalies in U850 area-averaged in North Africa for all the CMIP5 models pooled together. The anomalies are presented for the historical (black dots) and future climate (red dots) simulations, both relative to the mean climate in the historical period (1976–2005). Only one ensemble member is used here for each model. The ellipses show the 90% confidence region estimated by modelling the data with a bivariate normal distribution. (b) As in (a) but for the yearly Mediterranean precipitation and U850 in North Africa (not their anomalies) in the observational datasets, i.e. ERA-Interim reanalysis for U850 and the GPCP dataset for precipitation. (c)–(d) as in (b) but for all the ensemble members of the MPI-ESM-LR model (c) and the CanESM2 model (d).
Download figure:
Standard image High-resolution imageInterpreting this relationship requires caution as Mediterranean precipitation is not physically generated by zonal winds in North Africa, but primarily by the development of synoptic scale cyclones in the Mediterranean region (Zappa et al 2015a). However, it is well known that the development of Mediterranean storminess and precipitation are strongly associated with the Euro-Atlantic low-frequency atmospheric circulation (Eshel and Farrell 2000, Quadrelli et al 2001, Dunkeloh and Jacobeit 2003, Xoplaki et al 2004, Krichak and Alpert 2005). The 850 hPa zonal wind velocity in North Africa is an excellent diagnostic of these atmospheric conditions and, consistently, we find it is strongly associated with the area-averaged Mediterranean precipitation for timescales longer than about 20 days in both the models and the observations (not shown). The choice of this simple circulation index is also motivated by the finding that the cold season Euro-Atlantic U850 response does not strongly project on any single teleconnection pattern. For example, we find that the spatial correlations of the U850 multi-model mean response (figure 1(d)) with the first two modes of Euro-Atlantic atmospheric variability1 in U850, which broadly correspond to the North Atlantic Oscillation and the East Atlantic patterns, are 0.1 and 0.4 respectively. This differs from the warm season atmospheric circulation response which is instead well described in terms of a shift in the summer North Atlantic Oscillation (Bladé et al 2012).
A similar relationship between Mediterranean precipitation and U850 in North Africa is also found in the future climate simulations. In particular, the yearly precipitation and circulation anomalies in the future time period (2070–2100) relative to the present day (1976–2005) climatology are given by


and their association for all the CMIP5 models pooled together is presented as red dots in figure 2(a). Note that subtracting the historical climatologies implies that the year to year future climate precipitation ( ) and circulation (
 ) anomalies also include the contribution from the forced climate change response.
By comparing the red and black dot distributions in figure 2(a), we find that the shift toward less Mediterranean precipitation and weaker westerlies in North Africa in the future climate is qualitatively consistent with the association between the two quantities in the year to year present day climate variability. This behaviour can also be identified in most of the individual climate models (see for example figure 2(c)), and it suggests that the Mediterranean precipitation response to climate change depends on atmospheric circulation in a manner similar to that found in the year to year variability. However, thermodynamic effects or residual dynamical influences not captured by U850 in North Africa can also affect the Mediterranean precipitation response. For example, the CanESM2 climate model (see figure 2(d)) shows a future reduction in Mediterranean precipitation in spite of little changes in U850 in North Africa. Nonetheless, all the models with a large U850 circulation response show a behaviour similar to figure 2(c) (not shown).
These results suggest that the mean precipitation change associated with the atmospheric circulation response to climate change ( ) can be estimated, for each model, by exploiting the relationship between Mediterranean precipitation and zonal wind in North Africa found in the internal climate variability. In particular

where  is the U850 response in North Africa and
  is the slope of the regression between the area-averaged Mediterranean precipitation and U850 in North Africa in the present day climate inter-annual variability, for model m.
The values of the slopes  found in the individual climate models and in the real world data are reported in figure 3. With one exception, the slopes of the CMIP5 models range between 0.15 and 0.3
  The best estimate of the slope in the real world data is about 0.3
  which implies that many CMIP5 climate models tend to underestimate the sensitivity of Mediterranean precipitation to zonal wind changes in North Africa. A physical interpretation is that when the large-scale atmospheric conditions favourable to Mediterranean storminess develop, too little precipitation is generated by the Mediterranean storms. Consistently, we find that the bias in the slope and in the mean precipitation are associated: the models with reduced slope tend to have reduced mean area-averaged Mediterranean precipitation (r = 0.79). This suggests that predictions of precipitation change based on equation (5) might tend to be biased low compared to what would happen in the real world for the same circulation change. It also implies that simulating the 20th century Mediterranean climate well is pre-requisite for being able to make credible predictions and projections of precipitation in this region.

Figure 3. Slope of the regressions  between NDJFMA Mediterranean precipitation and U850 in North Africa identified in the inter-annual variability in the individual CMIP5 models. For each CMIP5 model (see table 1 for the label), the black dot indicates the slope of the regression in the present day climate, and the error bar the 95% confidence interval on the slope of the regression. The size of the confidence intervals mainly reflect the number of ensemble members available for each model. The models have been ordered according to the slope in the present day climate simulations. The blue dot and error bar to the right refer to the slope of the same regression but using the observational datasets. The inset shows a histogram of the standardized change (RCP8.5–HIST) in the slope in the CMIP5 models, and the distribution of changes expected due to sampling uncertainty alone, as estimated from the normal distribution (red line).
Download figure:
Standard image High-resolution image
Figure 4. (a) Frequency distributions of the yearly NDJFMA precipitation anomalies in the present day climate  (black line), in the future climate
  (red line), and the estimate of the future precipitation anomalies based on the U850 circulation response
  (red dashed line). All the CMIP5 models are pooled together as in figure 2(a). (b) Scatterplot of the precipitation response in the individual CMIP5 models (
 ) against the estimated precipitation change from the U850 response (
 ). Note that the spread in the model responses is much larger than the 95% confidence intervals (vertical and horizontal error bars) associated with internal climate variability.
Download figure:
Standard image High-resolution image
We find no evidence to suggest that the slope of the regression  is affected by climate change. In particular, the slope is nearly unchanged between the present and the future climate simulations in the multi model mean (change of 0.3%), and the variations between present and future climate in the individual climate models are consistent with the fluctuations expected from sampling uncertainty alone (see inset in figure 3). This justifies the use of present day climate simulations to infer the slope used in equation (5).
Figure 4(a) presents the frequency distribution of the present day ( black line) and future climate (
 red line) yearly precipitation anomalies for all the models and years pooled together. As expected, it shows a shift toward reduced future precipitation. We find that this shift can be well captured by adding the estimated precipitation change associated with the atmospheric circulation response to the present day climate inter-annual precipitation anomalies (
 red dashed line). In particular, 85% of the change in the mean of the distribution between
  and
and  is captured by
  This indicates that the atmospheric circulation change, as diagnosed by U850 in North Africa, contributes to most of the area-averaged Mediterranean precipitation change in the mean of the CMIP5 models.
To further test the ability of equation (5) to estimate the Mediterranean precipitation change, figure 4(b) compares the precipitation response in each model ( ) against the precipitation response estimated from the circulation change (
 ). The results show that
  has, on average, good ability to predict the precipitation change in the individual models, although, as expected from figure 4(a), there is a tendency to underestimate the response. When the circulation response is large (models in the bottom-left part of figure 4(b)) the difference between the estimated and effective response is relatively small (
 ), although when the circulation response is weak (top-right part of figure 4(b)) the error incurred by using equation (5) can be substantial. Nonetheless, there is high correlation (r = 0.9) in the inter-model spread between the estimated precipitation response and the effective precipitation response. This implies that the uncertainty in cold-season Mediterranean precipitation projection will not be narrowed unless the uncertainty in the atmospheric circulation response is reduced.
4. Conclusions and discussion
By analysing CMIP5 climate model output, this study has quantified the role of atmospheric circulation in the Mediterranean precipitation response to climate change in the cold season (November–April). The main findings of this study are the following:
- A simple index of atmospheric circulation, the 850 hPa zonal wind (U850) in North Africa, well describes the impact of atmospheric circulation on the area-averaged Mediterranean precipitation in both inter-annual variability and enhanced greenhouse gas climate change. Under climate change, the westerly zonal wind in North Africa and Mediterranean precipitation are both projected to decrease, and their reduction is consistent with the relationship between precipitation and U850 in North Africa found in the year to year variability. This is consistent with previous findings that cold-season Mediterranean precipitation change cannot be solely explained by thermodynamic, wet get wetter, dry get drier arguments.
- Using the relationship found in the year to year variability, we quantify that 85% of the area-averaged Mediterranean precipitation reduction projected by the mean of the CMIP5 models depends on the atmospheric circulation response, as described by U850 in North Africa. Furthermore, we quantify that 80% of the variance of the CMIP5 inter-model spread in the area-averaged Mediterranean precipitation future responses is related to uncertainties in the atmospheric circulation response to climate change. In contrast, there is no significant correlation (r = −0.2, p-value = 0.24) between the mean precipitation response and the global-mean surface warming across the models.
- Models generally tend to underestimate the ratio of the precipitation to circulation change in the year-to-year variability, although some models are realistic in this respect. This suggests that the CMIP5 model mean may underestimate the precipitation reduction for a given change in circulation, and it highlights the importance of using models able to simulate the Mediterranean climate well in order to have realistic projections.
Although this study has focused on the overall Mediterranean precipitation response, figures 1(a)–(c) suggest that local precipitation changes tend to scale with the area-averaged Mediterranean precipitation response. This implies that constraining the area averaged response would also have the benefit of reducing part of the uncertainty in the local precipitation responses. On the other hand, other processes, not captured by the scaling approach presented here, are also likely to be important in shaping the pattern in the precipitation response. For example, Zappa et al (2015a) finds that the weak mean precipitation response in the North Mediterranean area (just to the north of the box analysed in this study) is the result of a compensation between a reduction in the number of Mediterranean cyclones but an increase in the precipitation generated by each cyclone. This suggests that changes in the moisture environment in which cyclones grow also need to be taken into account to explain the spatial distribution of the precipitation response across the Mediterranean region.
A number of physical processes might determine changes in the Mediterranean atmospheric circulation and precipitation under climate change. An increase in the tropical sea surface temperature has been shown to force an increasing anticyclonic circulation in the Mediterranean area (Hoerling et al 2012), but the atmospheric mechanisms involved and its relevance for the end-of-century climate change response have not yet been clarified. An expansion of the Hadley circulation (e.g. Lu et al 2007), changes in the structure of stationary waves (e.g. Brandefelt and Körnich 2008) or changes in the North Atlantic sea surface temperature and stormtrack (e.g. Woollings et al 2012) might all be important. The identification of the role of these or other processes, and their quantitative contribution to the climate-change response, will be crucial to increase confidence in future projections of wintertime Mediterranean climate. Furthermore, understanding the interaction between the Mediterranean mean state (Seager et al 2014) and storm track (Zappa et al 2015a) in driving changes in the Mediterranean hydro-climate will need to be addressed in future research.
Acknowledgments
We acknowledge the two reviewers for their useful comments. We also thank the European Centre for Medium Range Weather Forecasts for the ERA-interim reanalysis and the NASA Goddard Space Flight Center's Laboratory for Atmospheres for the GPCP combined precipitation data. CMIP5 data has been downloaded from the British Atmospheric Data Centre archive, and we acknowledge the World Climate Research Programme Working Group on Coupled Modelling, which is responsible for CMIP, and the modelling groups listed in table 1 for producing the simulations and making available their output. This study is supported by the 'Understanding the atmospheric circulation response to climate change' (ACRCC, ERC Advanced Grant) project.
Footnotes
- 1
The teleconnection patterns have been simply evaluated from ERA-Interim as the first two EOFs of the inter-annual variability of U850 in the Euro-Atlantic sector (280W–40E, 20N–75N) in NDJFMA.