


Abstract
Managing and identifying the sources of anthropogenic stress in coastal wetlands requires an in-depth understanding of relationships between species diversity and human activities. Empirical and experimental studies provide clear evidence that coastal reclamation can have profound impacts on marine organisms, but the focus of such studies is generally on comparative or laboratory research. We developed a compound intensity index (reclamation intensity index, RI) on hybrid coastal reclamation, to quantify the impacts of reclamation on coastal ecosystems. We also made use of mean annual absolute changes to a number of biotic variables (biodiversity, species richness, biomass of total macrozoobenthos, and species richness and biomass of Polychaeta, Mollusca, Crustacea, and Echinodermata) to determine Hedges'd index, which is a measure of the potential effects of coastal reclamation. Our results showed that there was significant difference of coastal reclamation intensity between Yellow Sea, East China Sea and South China Sea, the biological changes in effect sizes of the three regions differed greatly over time. Our modelling analyses showed that hybrid coastal reclamation generally had significant negative impacts on species diversity and biomass of macrozoobenthos. These relationships varied among different taxonomic groups and included both linear and nonlinear relationships. The results indicated that a high-intensity of coastal reclamation contributed to a pronounced decline in species diversity and biomass, while lower-intensity reclamation, or reclamation within certain thresholds, resulted in a small increase in species diversity and biomass. These results have important implications for biodiversity conservation and the ecological restoration of coastal wetlands in face of the intensive reclamation activities.
Export citation and abstract BibTeX RIS

Content from this work may be used under the terms of the Creative Commons Attribution 3.0 licence. Any further distribution of this work must maintain attribution to the author(s) and the title of the work, journal citation and DOI.
1. Introduction
Coastal reclamation is of major importance to urban development, land-use expansion and sustainable economic development (Ehrenfeld 2000, Murray et al 2014). Nevertheless, coastal reclamation can lead to serious environmental and ecological problems, including the loss and fragmentation of coastal habitats, in the intertidal zone and in near-shore, estuarine, and marine waters (Bulleri and Chapman 2010). Large-scale geographic and geomorphological alterations can result in significant changes to natural physical and chemical processes within marine ecosystems, including increased water turbidity, sediment deposition, and changes to the hydrodynamic environment (Bhattacharya and Giosan 2003, Dugan and Hubbard 2006). The overall effect of coastal reclamation usually involves a major reduction in the abundance and diversity of species (Vaselli et al 2008, Chapman and Blockley 2009), particularly in the macrozoobenthos (Dugan and Hubbard 2006, Blockley 2007).
Coastal reclamation represents an unusual type of land-use. The evaluation of such programmes requires intense environmental monitoring, encompassing careful quantification of coastal reclamation actions as well as an evaluation of the impacts of such actions on ecosystem services. A number of comparative surveys have indicated that benthic abundance and biomass is significantly higher in natural habitats than in areas affected by coastal reclamation (Chapman and Bulleri 2003, Seitz et al 2006, Chapman and Blockley 2009, Bulleri and Chapman 2010). In a study on the response of common macrobenthic invertebrates to mud burial, Naser (2011) found that physical smothering of coastal and subtidal habitats resulted in changes to the abundance and distribution. Other research workers have demonstrated that coastal reclamation with artificial infrastructures are associated with increased spatial variation in macroinvertebrate assemblages (Pinn et al 2005, Walker et al 2008). All these studies confirm that coastal reclamation has a serious impact on macrozoobenthos communities in coastal waters.
Although early studies indicated that changes to benthic fauna could be attributed to the effects of reclamation, there is a need to quantify the relationship between reclamation intensity and macrobenthic changes at spatial and temporal scales. Quantifying the ecological impacts of human activities on the ecosystem would therefore depend on the development of two major assessment systems, as described that a cumulative intensity index, to assess changes in terrestrial ecosystems (Sanderson et al 2002, Blüthgen et al 2012, Allan et al 2013, Pferstorf et al 2013, Allan et al 2014) and a quantification system associated with spatial mapping of marine ecosystems (Bryant et al 1998, Beck and Odaya 2001, Halpern et al 2008).
Although previous methods for assessing the intensity of human activities are diverse and widely accepted, no method has yet been developed for the specific assessment of the impacts of coastal reclamation. So far, the methods developed for assessing qualitative comparisons fail to account for quantitative variation in land-use intensities (Scott 2001, Nevens and Rehuel 2003, Klimek et al 2007). A cumulative intensity index has been developed, for synthesizing three land-use components (intensity of fertilization, the frequency of mowing and the intensity of livestock grazing) of various human activities that have taken place on the same area of land, but this method neglects to include a characteristic for different coastal reclamation types with diverse utilizations (Blüthgen et al 2012, Pfestorf et al 2013, Allan et al 2014). The cumulative stressors' index combines spatial data on individual stressors with relative stressor weightings. Since these are difficult to quantify, they are based on experts' assessments (Halpern et al 2008, Allan et al 2013). To quantify an occupied coastal area it is therefore necessary to make use of a suitable specific intensity index that quantifies hybrid coastal reclamation, based on its unique land-use characteristics. A quantification approach is useful for biodiversity conservation and management of coastal ecosystems.
In spite of the above developments, no detailed analysis has been conducted on quantitative long-term changes associated with coastal reclamation, together with comprehensive studies that focus on the ecological consequences (to marine macrozoobenthos) of such reclamation actions. We therefore undertook a long-term, spatially-explicit monitoring programme that covered coastal reclamation and the utilization intensity for each type of reclamation, from 1979 to 2010. This was based on satellite-derived data—sourced from a government website—on the occupied area for each reclamation type, as well as utilization intensity. Our aims were as follows: (1) to develop a simple general coastal reclamation intensity index (RI) to quantify the intensity of single, or hybrid, coastal reclamation types; and (2) to explore the changes, in terms of biodiversity and biomass, in marine macrozoobenthos in coastal waters and to assess possible associations with hybrid coastal reclamation.
2. Materials and methods
2.1. Study sites
Our study area was comprised of sites along the entire coastline of China, excluding Hong Kong and Macau. All the study regions were highly modified, but were characterized by intensive reclamation activity. We did some statistical analyses on the hybrid coastal reclamation intensity and biological changes according to the inherent existing Yellow Sea, East China Sea and South China Sea (figure 1). To the provinces or municipalities across two regions, for convenience of statistical analyses and data materials' integrity (utilization intensity used in coastal reclamation intensity index calculation is based on the unit of province from the government), the provinces or municipalities were adjusted slightly to the regions that more than half of the provinces located in (see webfigure S1 for the Yellow Sea in blue coastline, webfigure S2 for East China Sea in pink coastline and webfigure S3 for South China Sea in light green coastline). (See reclamation data of remote sensing in supplementary information, available at stacks.iop.org/ERL/10/014004/mmedia).
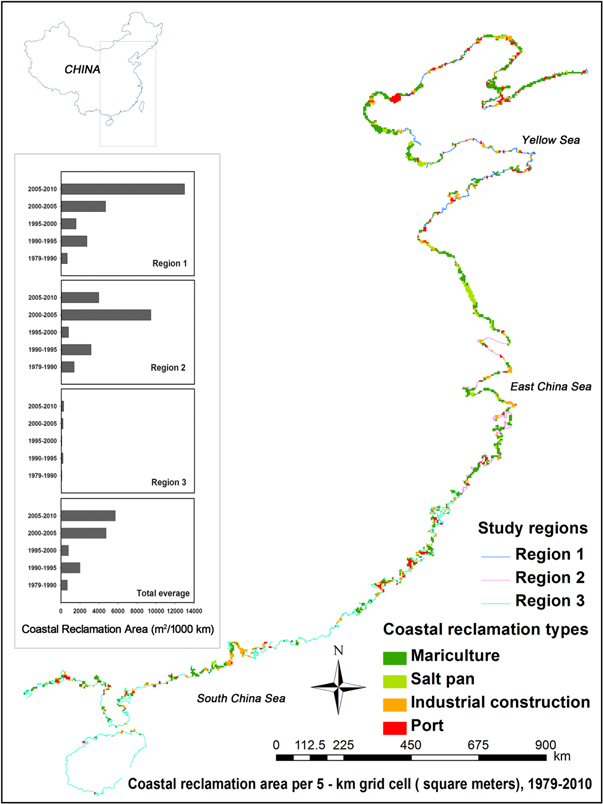
Figure 1. Study area, comprising three regions. The study encompassed five time periods, in order to assess annual net increases in coastal reclamation areas, based on available satellite images, obtained during the following time periods: 1979–1990, 1990–1995, 1995–2000, 2000–2005 and 2005–2010. Four reclamation types (mariculture, salt pans, ports, and other industrial constructions) were assessed, to represent coastal reclamation activities during the past 30 years. Results indicate widespread loss of coastal wetlands from 1979 to 2010 (see the supplementary information on detailed materials associated with reclamation areas in each region).
Download figure:
Standard image High-resolution image2.2. Assessment methods
2.2.1. Coastal reclamation intensity index (RI)
To quantify hybrid coastal reclamation intensity amongst regions over time, we developed a compound reclamation intensity index. The coastal reclamation intensity index (RI) was calculated as follows
where the RI comprises two parts: Ra (occupied area (m2) of coastal wetlands) and Rt (intensity of utilization for each reclamation type). This index is based on the two principles of: (1) a plot (of a standard size) subjected to different utilizations, and (2) the standard utilization being adopted for different-sized plots. The environmental impacts on the ecosystem are diverse. Ra and Rt are the values ascribed to a new coastal reclamation (type i) increasing each year per 1000 km coastline length in each study region within a particular time period (from 1979 to 2010), with n = 4 in this study and Raim and Rtim being the respective mean values across all the regions and all the time periods for reclamation type i (mariculture, salt pan, port, and other industrial constructions). In addition to the spatial reclamation data from satellite-derived data in RI, we collected data on China's mariculture production, sea salt production, port freight, electricity generation, and crude oil output for each of China's coastal provinces. These data were sourced from the National Bureau of Statistics of the People's Republic of China for the utilization intensity data in RI. The RI is additive because we did not have sufficient information on the interactions among multiple reclamation categories, and because the cumulative effect of these interactions on the ecosystem is largely unknown (Allan et al 2013). A square root transformation was applied, to produce a more even distribution and to reduce the influence of outliers (Allan et al 2014). Full details of data collection and analytic design of RI are presented in the supplementary information (under materials and methods).
2.2.2. Biological response variables
Coastal reclamation may exert a substantial effect on marine macrozoobenthos in coastal waters. To explore the impact of hybrid coastal reclamation on biodiversity and biomass of macrozoobenthos, we conducted a comprehensive literature review on biological research carried out in the study area during the 1979–2010 period. This included biological data relating to total biodiversity (Shannon–Viener index), total species richness (SR), SR of Polychaeta, Mollusca, Crustacea, and Echinodermata (Margalef index) and the total biomass of each of the four taxonomic groups (g m–2) of marine macrozoobenthos in coastal waters. The study area on which this review was based included coastal waters of the intertidal zone, subtidal zone, and inshore and offshore waters. We also used a well-established method to determine effect size (Hedges'd) to calculate how biological changes varied with time, by means of quantifying the differences in results between two years within a certain time period (see supplementary information text for detailed information on data sources and calculation methods).
2.3. Statistical analyses
We used both linear and quadratic regressions to test and visualize the relationships between the coastal reclamation intensity index and the biological response variables (species diversity and biomass of macrozoobenthos represented by effect sizes in Hedges'd). Our approach was similar to that of Allan et al (2014), in which the response to coastal reclamation was analysed in terms of each of the biotic variables measured in all regions. We did not incorporate 'region' into the models (to account for the regional differences in total biodiversity, SR and biomass) because we used the effect size in Hedges'd to quantify the way in which each biotic variable varied with time. This is an alternate approach to that developed by Allan et al (2014) and Scherber et al (2010), used for the purpose of setting up a common scale for interpreting data relating to a number of biotic variables. Linear terms were estimated from models that only include linear terms. Quadratic terms were tested from given linear terms and were only included in the final models if they significantly reduced the ratio between residuals and explained variance by comparison with the linear model. To identify potential sampling bias (sample sizes from the literatures), we ran spearman rank correlations to examine the relationship between the standardized effect sizes and the sample sizes. A non-significant correlation (P > 0.05) would indicate no sampling bias, and the data sizes extracted from the literatures were robust and valid (Begg and Mazumdar 1994, Vilà et al 2011). SigmaPlot 12.0 was used to analyse the data (Systat Software, 2011).
2.4. Sensitivity analyses
Our analysis was based on a variety of decisions concerning the procedures for calculating RI, each of which could have influenced our conclusions. To verify the robustness of our analyses, in terms of weightings for each integrate part of the area and utilization intensity, and the weighting to each coastal reclamation type and data inclusion within each integrate part, we tested the sensitivity of our results. For assessing the sensitivity to weights, we first assigned random weights to the two independent integrate parts of area and utilization intensity of RI, to attain a weights sum of 1, after which we recalculated RI. Secondly, random weights were assigned to each reclamation type within the two integrate parts, and the weights summed to 1, after which we recalculated RI. To assess sensitivity to the inclusion of reclamation data (confined to four coastal reclamation types), we made use of methods associated with the removal and addition of reclamation data. For removals, we randomly removed one, two and three reclamation data sets from the original RI, and then recalculated RI. For adding reclamation data, we assumed that more reclamation categories were inclusive (for more than four categories) and the value of additive reclamation-category data, calculated according to the RI formula, could sum up to a certain numerical interval. Therefore, we used a threshold-based approach to add a certain threshold interval to each integrate areal and attributive part within RI, respectively. The added numerical interval was gradually assigned to 0–10, 10–20, 20–30, 30–40, 40–50, 50–60, 60–70, 70–80, 80–90 and 90–100 in our analysis (which would be sufficient for all the other coastal reclamation types) after which we recalculated RI. Pearson correlation analysis, between the original RI values and the recalculated RI values, was then conducted. Results indicated all the values of PRI < 0.05, suggesting that the calculation of RI was robust. But to the data inclusion in adding reclamation data, because random data performed within each threshold interval is diverse every time, to test the accurate results, we repeated performing 5000 times of random numerical values for the adding numerical interval, and then recalculated RI. The 5000 iterations of Pearson correlation analysis, between the RI original and recalculated RI, were used to test the distribution of correlation coefficients r. If the results indicated a normal distribution the correlation coefficients (r) were assembled at a higher level and the calculation of RI was considered to be robust.
3. Results
3.1. Robustness of the coastal reclamation intensity index (RI)
Our sensitivity analyses of the RI calculation function suggest a robust result (figures 2(a) and (b)). Sensitivity to weightings and removals of reclamation types showed a significant correlation between the recalculated RI and the original RI (PRI < 0.0001, webfigure S4, S5). The sensitivity of weightings for integrating a real and attributive part, as well as each type, indicates that weights have no influence on the RI calculation, although the impacts of types on the ecosystem can, in reality, be different. For the inclusion of sensitivity data, i.e. adding a certain threshold (assumption of possibly additional reclamation types), Pearson correlation analyses were strongly correlated between recalculated RI and original RI in every case (webfigure S6) and the mean frequency for the histogram of Pearson correlation coefficients indicated a normal distribution and were mostly assembled around the value of 0.8 (figure 2(b)). Sensitivity measured after data inclusion (for both removal and addition) suggests that not only one, but also more types of, coastal reclamation can make use of the calculation approach for quantifying the intensity. The robust results indicate that the novel hybrid coastal reclamation intensity index can be used on a widespread basis, to quantify the impacts of coastal reclamation activities on ecosystems.

Figure 2. Results after assigning random weights, removing one to three randomly-combined reclamation types, and recalculating RI. Each vertical line shows the range (line segments drawn between maximum and minimum) of values computed. (a) Pearson correlation analysis was conducted between the original RI and the mean value of recalculated RI. (b) Histogram of Pearson correlation coefficients, from 5000 times the threshold-based approach, to add a certain numerical value to the original RI. For each iteration, we randomly assigned the numerical value at a certain threshold interval, to add to the two integrate parts (area and utilization intensity) in the original RI. We then recalculated RI and calculated its correlation with the original RI values. Mean frequency values indicate the mean number of Pearson's r at a certain value after reaching a certain threshold after 5000 iterations.
Download figure:
Standard image High-resolution image3.2. Coastal reclamation intensity changes
Our analysis on the integration of changes in a coastal reclamation area, and their utilization intensity in terms of compounding reclamation intensity (RI), indicates that coastal reclamation intensity varied regionally and temporally. In general, a linear growth trend of coastal reclamation intensity in region 3 during 1979–2010, but in region 1 and 2 presented a fluctuant grow trend between 1979 and 2005, but decrease in 2005–2010. Moreover, there was a significant difference of reclamation intensity (RI) between regions (one-way ANOVA, P < 0.05), and region 1 and 2 are significantly higher than region 3 at all the time periods (figure 3). Our results indicate a reclamation rate of 682 m2 year−1 1000 km−1 length of coastline between 1979 and 1990, but this increased to a rate of 5716 m2 year−1 1000 km−1 length of coastline between 2005 and 2010 (webtable 1). Comparing the three regions in our analysis, reclamation in Region 2 (close to East China Sea) and Region 1 (close to Yellow Sea) was more rapid than in Region 3 (close to the South China Sea), although the reclaimed areas were spatially pervasive. Nevertheless, most of the reclamation area was used for all, or some of, the following purposes: mariculture, industrial construction, and port development. Our results indicate rapid and widespread transformation of coastal wetlands to human-dominated and modified novel ecosystems across the entire coastline of China. It is not therefore surprising to conclude that coastal reclamation intensity is associated with the degree of economic development.
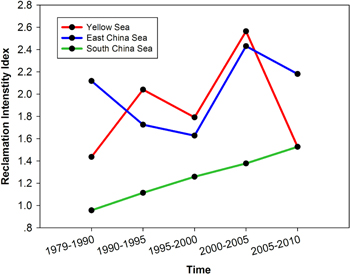
Figure 3. Variation in the reclamation intensity for each region across the five time periods.
Download figure:
Standard image High-resolution image3.3. Biological changes in effect size for macrozoobenthos
Statistical analysis of each response variable suggested that no sampling bias exists (for total biodiversity, Spearman' ρ = −0.21 and P = 0.53; for total SR Spearman' ρ = −0.01 and P = 0.47; for SR of Polychaeta, ρ = −0.14 and P = 0.95; for SR of Mollusca, ρ = −0.34 and P = 0.25; for SR of Crustacea, ρ = −0.31 and P = 0.94; for SR of Echinodermata, ρ = −0.04 and P = 0.65; for total biomass, ρ = −0.11 and P = 0.37; for biomass of Polychaeta, ρ = −0.17 and P = 0.65; for biomass of Mollusca, ρ = −0.06 and P = 0.24; for biomass of Crustacea, ρ = −0.27 and P = 0.57; for biomass of Echinodermata, ρ = −0.40 and P = 0.68), therefore, the data sampling sizes extracted from the literatures were robust and valid.
Biodiversity and biomass of macrozoobenthos along the entire coast of China have changed significantly over the past three decades (figure 4). These three regions differed greatly in changing amount of the eleven response variables (figure 4). Annual changes have been variable in terms of species diversity and biomass and among taxonomic groups. The effect sizes for macrozoobenthos were mostly negative, but not all effects were significant. The decrease of macrozoobenthos varied with time and was most pronounced in terms of total biodiversity, total SR, SR of Crustacea and Echinodermata, total biomass, and biomass of Mollusca and Echinodermata, but not for the other response variables. There were significant difference in total biodiversity (one-way ANOVA, P = 0.013 < 0.05), total SR (P = 0.003 < 0.05), SR of Polychaeta (P = 0.033 < 0.05), SR of Mollusca (P = 0.022 < 0.05), total biomass (P = 0.011 < 0.05) amongst regions. But we did not detect a significant difference in SR of Crustacea and Echinodermata, biomass of Polychaeta, Mollusca, Crustacea and Echinodermata (P = 0.073 > 0.05). Our analyses suggest that the biological effects of both human disturbances and climate change are generally large and negative, but the variation in species diversity and biomass of macrozoobenthos has important implications for ecosystem responses to environmental changes. Annual changes in absolute changes of effect sizes were detected, major impacts on species diversity and biomass of macozoobenthos are likely associated with coastal reclamation.

Figure 4. Mean effect size (Hedges'd) for average annual changes in the magnitudes of biological variables for each region across the five time periods. The likely mean effect size and 95% bias-corrected bootstrapped confidence interval are shown for each response variable. The number of data records for each variable is 15. The zero line indicates no effect, and significance of average annual changes is determined when the 95% confidence interval does not overlap zero. Asterisk (*) indicates a significant change in effect size.
Download figure:
Standard image High-resolution image3.4. Relationships between coastal reclamation intensity and species diversity and biomass
Hybrid coastal reclamation has a major negative impact on species diversity and the biomass of macrozoobenthos in coastal sea waters (figures 5 and 6). Our analyses showed that annual change in effect sizes of species diversity were mostly significantly related to coastal reclamation intensity and that these relationships include both linear and nonlinear terms. Analysis for species diversity of macrozoobenthos indicated a clear negative response to increasing RI, and the effects on species diversity were significantly different among taxonomic groups (figure 5). With increasing coastal reclamation intensity, the total biodiversity, SR, and SR of Polychaeta and Echinodermata decreased linearly (figures 5(a), (b), (c) and (f)), while coastal reclamation contributed to an accelerating rate of mollusc and crustacean populations, in nonlinear terms (figures 5(d) and (e)). In all response variables relating to species diversity, with the exception of that relating to the SR of Echinodermata, the smaller increases (in comparison with those of other response variables) were noted in the absolute changes in effect size, or within a certain threshold interval of coastal reclamation intensity (positive effect size above zero line). Annual changes in effect sizes of biomass were also significantly related to coastal reclamation intensity and both linear and nonlinear relationships were noted between coastal reclamation intensity and biomass. With increasing coastal reclamation intensity, the total biomass, and the biomass of both Polychaeta and Echinodermata, decreased linearly (figures 6(a), (b) and (e)), while coastal reclamation contributed to an accelerating decrease in Mollusca and Crustacea, in nonlinear terms (figures 6(c) and (d)). Likewise, for response variables of biomass except for Mollusca, the absolute changes in effect size increased with a smaller increasing, or within a certain threshold interval of coastal reclamation intensity (positive effect size above zero line).
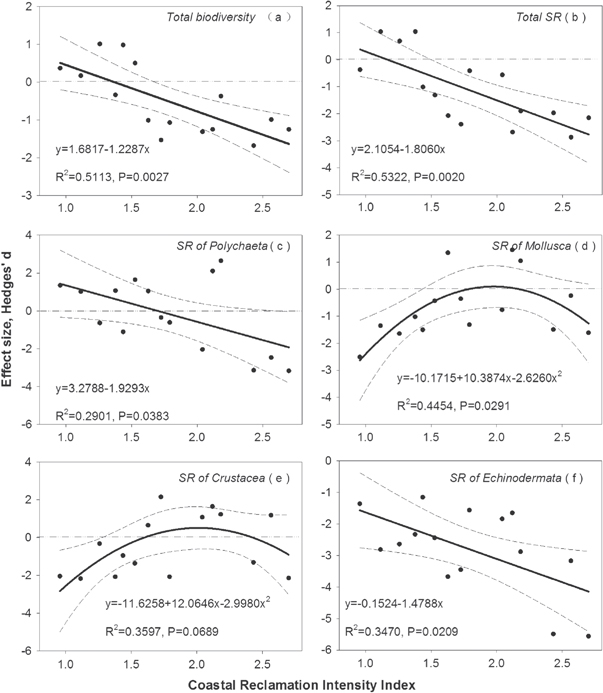
Figure 5. Relationships between reclamation intensity index (RI) and total biodiversity of macrozoobenthos (a); total species richness of macrozoobenthos (b); species richness of Polychaeta (c); species richness of Mollusca (d); species richness of Crustacea (e); and species richness of Echinodermata (f). Lines indicate the model fit for different values of reclamation intensity index and the effect size calculated by the methods of Hedges'd. Each dashed curve indicates ±95% confidence interval, which corresponds to the fitted model. Abbreviation: SR is species richness.
Download figure:
Standard image High-resolution image
Figure 6. Relationships between reclamation intensity index (RI) and biomass of total macrozoobenthos (a); biomass of Polychaeta (b); biomass of Mollusca (c); biomass of Crustacea (d); and biomass of Echinodermata (e). Lines indicate the model fits for different values of reclamation intensity index and the effect size calculated by the methods of Hedges'd. Each dashed curve indicates ±95% confidence interval, which corresponds to the fitted model. Abbreviation: SR is species richness.
Download figure:
Standard image High-resolution image
4. Discussion
The fitted relationships suggest that coastal reclamation has a significant negative influence on macrozoobenthos. This is consistent with results from earlier studies indicating that human activities along coastal waters exert an overwhelming negative influence on biodiversity and biomass (Bolam et al 2006, Bolam et al 2010, Bolam et al 2011, Ryu et al 2011, Midwood and Chow-Fraser 2012, Wilson and Bayley 2012). Declines in biodiversity and biomass could also be driven by changes in topography, hydrological conditions, sedimentation rate, and damage to nearby vegetation habitats (Scherber et al 2010, Paavo et al 2011, Nourisson et al 2014). Such changes—that are often associated with fragmentation, loss, and decreasing connectivity of habitats (Chapman and Blockley 2009, Bulleri and Chapman 2010), caused by coastal reclamation (Burt et al 2011, Perkol-Finkel et al 2012), as well as artificial structures associated with coastal reclamation—often become ubiquitous features of coastal habitats, where they can create a biotic homogenization that results in decreased species diversity (Bunn and Arthington 2002) and can be regarded as environmental threats associated with a decrease in the original habitat biodiversity (Chapman and Bulleri 2003, Terlizzi and Faimali 2010, Dafforn et al 2012).
Although relationships between the coastal reclamation index and biological variables affecting the macozoobenthos can be both linear and nonlinear, our results agree with those of several former studies on the nature of disturbance–response relationships. Our results indicated that certain relationships can be diverse, as indicated by studies on different taxonomic groups. The mean effect size for total biodiversity, total SR, and SR of Polychaeta and Echinodermata, decreased significantly, in linear terms, with increasing RI (figures 5(a), (b), (c) and (f)) as well as for total biomass, and with the biomass of Polychaeta and Echinodermata (figures 6(a), (b) and (e)). In terms of SR (figures 5(d) and (e)) and biomass (figures 6(c) and (d)) of Mollusca and Crustacea, we detected significant nonlinear correlated relationships (in quadratic terms) to RI. The linear relationships in our study were ostensibly in contrast with the pattern predicted by the well-known intermediate disturbance hypothesis that suggested peaked, unimodal relationships to be the most common (Mackey and Currie 2001, Miller et al 2011). It is possible that a peaked diversity–disturbance relationship is more common for natural disturbances at small spatial scales than for large-scale anthropogenic disturbances. In this context it is worth noting the existence of positive monotonic and negative monotonic relationships between SR and disturbance, particularly in the case of anthropogenic disturbances (Mackey and Currie 2000, 2001).
Species diversity and biomass can, to some extent, also benefit from intermediate coastal reclamation intensity. Our results indicated that lower, or appropriate, reclamation intensities contributed to positive increases in total biodiversity, total SR, and SR of Polychaeta (figures 5(a), (b) and (c)). These factors are significantly linearly correlated with increasing RI (although presented as a decreasing trend) as well as for total biomass, and biomass of Polychaeta and Echinodermata (figures 6(a), (b) and (e)). A similar result, but presented as a nonlinear relationship, is noted between RI and SR of Mollusca, which shows a positive increase in the effect size within a certain threshold of 1.8 < RI < 2.2, but presents a decreased trend when RI exceeded 2.0 (figures 5(d)). The biomass of Crustacea however indicated a positive increase in terms of the effect size within a certain threshold limit of 1.0 < RI < 2.6, and presented a decreasing trend when RI exceeded 2.0 (figure 6(d)). No significant correlated relationship was however noted between RI and SR of Crustacea (figure 5(e)). Our results also showed that SR indicators associated with Echinodermata were the most sensitive biological indicators for coastal reclamation, in cases where coastal reclamation decreased significantly in linear terms (figure 5(f)). In addition, the biomass of Mollusca decreased significantly, in quadratic terms, throughout the coastal reclamation process (figure 6(c)).
Taken together, in terms of coastal reclamation intensity in Yellow Sea, East China Sea and South China Sea (figure 3), and the biological changing amount of the three regions (figure 4), as well as the relationships between coastal reclamation intensity index and effect sizes (figures 5 and 6), our results suggest that the managers would take plans of managing coastal reclamation in coastal wetlands differ with regions. For example, nonlinear relationship shapes indicate that South China Sea region with lower coastal reclamation intensity (all the intensity points are at the left of the peak points of those quadratic curves), to some extent, an appropriate development should be permitted, but to control the reclamation intensity into an acceptable range. However, linear relationship shapes for different response variables indicate that all the three regions could not continue to conduct reclamation. However, in general, for the Yellow Sea and East China Sea regions that have already been conducting higher coastal reclamation, the current circumstances dictate that they should take actions to carry out ecological conservation and restoration rather than continuing reclamation. Nevertheless, our results also indicated ecological restoration and conservation associated with coastal reclamation can be diverse, as indicated by studies on different taxonomic groups, and the diverse responses to different regions of Yellow Sea, East China Sea and South China Sea.
Evidence, discussed above, suggests that the impacts of global coastal reclamation are likely to intensify. In this context it should be noted that other causes—such as ocean acidification, invasion by alien species, climate change, and overexploitation—may also accelerate the rate of extinctions (Brook et al 2008, Krauss et al 2010, Kroeker et al 2010, Hoegh-Guldberg and Bruno 2010, Harley 2011). Due to a lack of knowledge concerning the causal mechanisms underlying observed stress–response relationships, information on how macrozoobenthos organisms respond to coastal reclamation may facilitate further understanding of such mechanisms. Understanding the fundamental ecological processes, and how these are affected by coastal reclamation, should also be an important objective of future studies. Moreover, since coastal reclamation is associated with a long history of human activities, it is likely that there is a time delay between the actual extinction and the processes causing such an extinction. In such a situation it is likely that populations living close to their extinction threshold may survive for a long time period before going extinct (Vellend et al 2006, Krauss et al 2010). Such a time lag represents a difficult problem when studying the effects of reclamation on organisms and ecological processes, and research into such lags (in response to changes in coastal reclamation) has important implications for biodiversity conservation and environmental impact assessments.
Degradation and reclamation of coastal wetlands is likely to increase the vulnerability of coastal communities (Murray et al 2014). For this reason it is important that future studies incorporate rigorously-designed field experiments, with sufficient replicate data, at both spatial and temporal scales, in order to understand how dominant species respond to changes in the food web. Our results should be viewed as an early warning, concerning the potential effects of coastal developments on biological diversity and biomass. It is hoped that this will serve as a baseline for future monitoring and restoration work, and that it will prompt actions aimed at conserving and restoring coastal ecosystems.
5. Conclusions
The proposed approach, described in this paper for quantifying coastal reclamation intensity, represents a standardized, quantitative, simple practicable solution for synthesizing hybrid coastal reclamation types and their cumulative impacts on the coastal ecosystem. Coastal reclamation intensity with RI calculation showed that there was significant difference between Yellow Sea, East China Sea and South China Sea. Unsurprisingly, the overall trend has not been uniform among regions over time. In addition, the biological changes in effect sizes (Hedges' d) of Yellow Sea, East China Sea and South China Sea differed greatly over time.Relationships between RI and biological variables associated with macrozoobenthos are supported by quantifiable evidence which indicates that high coastal reclamation intensity constitutes ecosystem-level disturbance and has significantly negative impacts on macroinvertebrate biodiversity and the biomass of macrozoobenthos. Significant declines in species diversity and biomass were noted in conjunction with increasing coastal reclamation intensity.
Our results also indicate that although a significantly decrease in biodiversity and biomass in conjunction with coastal reclamation in South China Sea, an appropriate development still would be permitted, but to control the reclamation intensity within an acceptable range. By contrast, the Yellow Sea and East China Sea, many more requirements are urgently needed to conduct necessary prioritization conservation and ecological restoration rather than continued reclamation. However, since the responses of biological variables and taxonomic groups to each coastal reclamation type differ greatly, decision-making of management, conservation and restoration should be based on the objective selection for a certain taxonomic group. Furthermore, our analyses indicate that lower-intensity changes, within a threshold scope, can be beneficial to macrozoobenthos communities. Therefore, when formulating and/or designing development projects, managers and engineers should therefore be aware of the ecosystem impacts of coastal reclamation, and trying to conduct lower-intensity development design for biodiversity conservation and restoration engineering. In this context, it should be noted that the proposed approach for quantifying coastal reclamation intensity is important for determining spatial prioritization, in terms of biodiversity, ecosystem services, conservation and restoration. Thus, the quantitative linear and nonlinear relationships should be noted when seeking to optimize rehabilitation and restoration projects associated with heavily-impacted coastal wetlands.
Acknowledgments
The study was supported financially by National Key Basic Research Programme of China (2013CB430406), China National Funds for Distinguished Young Scientists (511250235) and National Science Foundation for Innovative Research Group (51151003). We thank Dr Qiang He for the idea of statistical analyses in biological variables. And we thank the two anonymous reviewers for comments on the manuscript.