
Abstract
Tissue-like constructs, intended for application in tissue engineering and regenerative medicine, can be produced by three-dimensional (3D) bioprinting of cells in hydrogels. It is essential that the viability and proliferation of the encapsulated cells can be reliably determined. Methods currently used to evaluate cell proliferation, such as quantification of DNA and measurement of metabolic activity, have been developed for application in 2D cultures and might not be suitable for bioinks. In this study, human fibroblasts were either cast or printed in gelatin methacryloyl (GelMA) or sodium alginate hydrogels and cell proliferation was assessed by AlamarBlue, PicoGreen and visual cell counts. Comparison of data extrapolated from standard curves generated from 2D cultures and 3D hydrogels showed potential inaccuracies. Moreover, there were pronounced discrepancies in cell numbers obtained from these assays; the different bioinks strongly influenced the outcomes. Overall, the results indicate that more than one method should be applied for better assessment of cell proliferation in bioinks.
Export citation and abstract BibTeX RIS

Original content from this work may be used under the terms of the Creative Commons Attribution 4.0 license. Any further distribution of this work must maintain attribution to the author(s) and the title of the work, journal citation and DOI.
1. Introduction
In tissue engineering and regenerative medicine, three-dimensional (3D) bioprinting is intended to create tissue-like constructs suitable for transplantation [1, 2]. Cells are mandatory components of the bioprinting process. They may be combined with biomaterials in printable bioink formulations, typically in the form of hydrogel precursors, or seeded after printing of biomaterial inks [3]. Unlike seeding cells post-fabrication, layer by layer, bioprinting of cells in bioinks allows the positioning of multiple cells at defined 3D spaces in the scaffolds [4]. In extrusion-based printing, the bioink is usually forced through a small nozzle as a liquid solution which undergoes chemical or physical gelation after dispensing [5]. The level of shear stress is directly affected by printing pressure, nozzle diameter and the viscosity of the dispensing medium [6]. Short-term exposure to severe shear stress during the printing may affect the proliferation potential of the cells [6, 7]. Cells that survive the printing process must still overcome the physical barrier of the hydrogel itself to be able to spread, migrate and grow. Quantifying these cellular activities in the bioprinted constructs is crucial, not only to elucidate in vitro cell processes such as proliferation and differentiation, but also tissue formation in vivo. For cellular and molecular characterization, DNA, RNA, and proteins can be isolated from cells seeded post-fabrication onto 3D printed scaffolds, similarly to cells seeded on 2D tissue culture plates [8]. However, cells encapsulated in hydrogels are often difficult to harvest for further analysis.
It is important to note that the precise measurement of tissue function to cell number allows for comparison of data across experiments and between different research laboratories. Moreover, in order to deliver reproducible, reliable human tissue-like constructs and 3D models for industrial and clinical translation purposes, it is necessary to establish standardized methods of cell characterization for bioprinted constructs [2]. Although the United States food and drug administration has approved clinical application of cell-free 3D printed devices (orthopedic devices and surgical guides), bioprinted living cellular constructs are facing considerable translational challenges [9]. A major hinder is the lack of standardization of the overall bioprinting process [2, 10].
Cell proliferation is an important indicator of normal cell behavior and is commonly used to measure responses to toxins, or as a prognostic and diagnostic tool for age-related diseases and cancer. Senescent cells adopt a large flat shape and irreversibly lose capacity for proliferation [11]. On the other hand, cancer cells and stem cells can proliferate extensively [12]. In biofabrication research, assays available to evaluate cell proliferation include measurement of metabolic activity (e.g. AlamarBlue), DNA quantification using fluorophores (e.g. PicoGreen), and visual counting (e.g. hemocytometer and image analysis) [7, 13]. AlamarBlue is a resazurin-based assay in which the soluble resazurin (blue) is reduced to highly fluorescent resorufin (pink) in proportion to the metabolic activity of a cell population [14]. PicoGreen belongs to a family of fluorescent dyes with high specificity for double-stranded DNA (dsDNA) [15]. Compared with DNA-based methods, metabolic assays are less suitable for assessing cell proliferation because of their chemical dependency on the efficiency of metabolic enzymes [16]. More importantly, these assays were established for application on 2D monolayer cultures and 3D scaffolds seeded with cells. Thus, there is a need to evaluate the effectiveness of these assays to assess cells encapsulated in bioinks. In the present study, human fibroblasts were encapsulated and bioprinted in gelatin methacryloyl (GelMA) and alginate. The aim was to evaluate fibroblast proliferation by means of AlamarBlue, PicoGreen, and image analysis.
2. Materials and methods
2.1. Preparation of hydrogels for casting and bioprinting
Under sterile conditions, gelatin (6% w/v) from porcine skin (300 Bloom, Type A; Sigma-Aldrich, St. Louis, MO, USA) was dissolved in DMEM cell culture medium (4.5 g/l glucose, Life Technologies, Carlsbad, CA, USA) supplemented with 1% penicillin/streptomycin (GE Healthcare, South Logan, UT, USA) at 45 °C for 30 min before adding 4% w/v GelMA, 90–110 Bloom, degree of substitution 60%, Sigma-Aldrich or 4% w/v sodium alginate (Sigma-Aldrich). Gelatin was added as a sacrificial material to enhance the printing and casting capabilities by improving the viscosity. Upon crosslinking GelMA-gelatin with high-energy visible light and alginate-gelatin with calcium chloride at room temperature, only GelMA and alginate were permanently crosslinked. Subsequently, when the samples were incubated at 37 °C, the gelatin was selectively removed as it became a solution and dissolved in the culture media. Lithium-Phenyl-2,4,6-trimethylbenzoylphosphinat (LAP; TCI Europe N.V, Zwijdrecht, Belgium) of 1 mg ml−1 was mixed with the GelMA solution for a further 30 min in the dark. The hydrogels were stored at 4 °C overnight and then heated to 37 °C before casting or 3D bioprinting.
2.2. Cell culture
Human periodontal ligament fibroblasts (passages 7–10) were cultured in DMEM supplemented with 1% penicillin/streptomycin (GE Healthcare, South Logan, UT, USA) and 10% fetal bovine serum (FBS; GE Healthcare, South Logan, UT, USA) at 37 °C and 5% CO2. Additionally, 100 µg ml−1 antifungal (NormocinTM-Antimicrobial reagent; InvivoGen, San Diego, CA, USA) was added to the culture of cast and 3D bioprinted constructs. The cells were obtained from the biobank of the Department of Clinical Dentistry, University of Bergen, Norway, originally, these cells were isolated form tissue explants from patients (18–35 years old) during oral surgeries as we previously reported [17].
2.3. Cast hydrogels
Fibroblasts (1 × 10⁶ cells ml−1) were mixed with hydrogel precursors at 37 °C and a volume of 100 μl was pipetted into plastic molds on ice. Alginate hydrogels were crosslinked with 100 mM CaCl2 for 10 min at RT while GelMA was cross-linked with a Bluephase® PowerCure Dental lamp (Ivoclar Vivadent) for 30 sec. The constructs were transferred to a 12-well plate and cultured in 500 µl of medium/well with medium changed every other day. To generate 2D and 3D linear calibration plots, a series of cell concentrations (0–300 000 or 500 000 cells) was cultured in well plates or mixed with hydrogels, crosslinked as described above and harvested for further analysis after 4 h incubation in growth medium.
2.4. Cell bioprinting
Cells (1 × 10⁶ cells ml−1) were mixed with hydrogel precursors at 37 °C before transfer to plastic printing cartridges (Nordson FED, Westlake, OH, USA). The printing temperature was 26 °C for the Alginate and 27 °C for the GelMA bioink. The printing was carried out directly onto sterile 6-well plates with a 3D-Bioblotter® (EnvisionTEC, Gladbeck, Germany) with a metal needle (0.51 mm inner diameter; EnvisionTEC). Square structures (10 × 10 mm) were printed, comprising four perpendicular layers, with 1.4 mm between the filaments. Immediately after bioprinting, the structures were crosslinked as described for the cast samples.
2.5. Cell viability and morphology
Cell viability was assessed using live/dead assay (Invitrogen, Waltham, MA, USA) at days 1, 7 and 14. After washing with DPBS (Gibco, ThermoFisher Scientific, Waltham, MA, USA), the samples were stained with 1.5 µl ethidium homodimer III and 1.5 µl calcein acetoxymethyl ester in 5 ml DPBS for 45 min at RT on an orbital shaker. Directly after staining, fluorescence imaging was recorded in a fluorescence microscope (Nikon, Eclipse, 80i, Tokyo, Japan). To evaluate cell morphology and distribution within the hydrogels, the cell cytoskeleton was stained with Phalloidin and imaged in a fluorescence microscope. Briefly, after fixation with 4% PFA, samples were permeabilized with 0.1% Triton-X (Sigma-Aldrich) and incubated in 1% bovine serum albumin blocking solution (Sigma-Aldrich) for 10 min. The samples were then stained with Phalloidin-Atto 565 (1:40; Sigma-Aldrich) in blocking solution for 40 min and counterstained with DAPI (1:2000; Sigma-Aldrich) for 5 min.
2.6. AlamarBlue assay
AlamarBlue™ Assay (Invitrogen) was used in accordance with the manufacturer's instructions. On days 1, 7 and 14 of culture, samples were transferred to new wells and both new and old wells (to evaluate cells that had escaped the hydrogels) were incubated in 1 ml of 10% alamarBlue solution. After 4 h of incubation, solutions were transferred to 96-well plates and fluorescence (550/590 nm) was measured using a microplate reader (VARIOSKAN LUX, Thermo Scientific).
2.7. PicoGreen assay
For 2D cultures, cells were cultured for 4 h and then lysed in 500 µl of 0.1% Triton-X/PBS, using two freeze-thaw cycles (−80 °C) combined with a sonication step (2 × 20 s, 60% power; Bandelin Sonopuls, Berlin, Germany). For 3D cultures, GelMA and alginate constructs were either treated like 2D samples or treated with 500 µl papain digestion buffer (125 μg ml−1 papain, 10 mM L-cysteine; 100 mM Na2HPO4, 10 mM Na2EDTA; in PBS) with a pH of 6.5 at 60 °C overnight. On days 1, 7 and 14, the DNA content was then quantified using the Quant iT™Picogreen®dsDNA assay (Invitrogen) according to the manufacturer's instructions. All samples were diluted 1:10 and 50 µl of each sample was mixed with 50 µl of a buffer containing the fluorescent PicoGreen® reagent. Fluorescence at 480/520 nm was measured using a microplate reader. For the casting and bioprinting experiments, the cell numbers were calculated either using the linear calibration plot generated from 2D cultured cells or using corresponding 3D linear calibration plots.
2.8. Cell counting from fluorescent images
DAPI cell counting was undertaken following DAPI/Phalloidin staining. Z-Stacking was undertaken with a fluorescence microscope, screening from the bottom to the top of the gel to generate full focus images. For quantification, all images were post-processed and analyzed with Fiji (ImageJ 1.53 c). Additionally, stained hydrogels were embedded in Tissue-Tek® O.C.T.TM Compound (Sakura Finetek, Zoeterwonde, Netherlands) overnight for dehydration and were snap frozen in liquid nitrogen and stored at −20 °C until further use. Hydrogels were cut into 30 μm-thick cryosections using a Cryostat SLEE MNT (SLEE medical GmbH, Nieder-Olm, Germany). Fluorescence imaging was undertaken with a fluorescence microscope and quantified with ImageJ.
2.9. Statistical analysis
Quantitative results are expressed as mean values ± standard deviation. Significant differences between experimental groups were evaluated using one-way analysis of variance combined with a Tukey post hoc analysis at the level of p < 0.05. GraphPad Prism 8.0.1 was used for all statistical analyses.
3. Results
3.1. Creation of standard curves
Figure 1 presents standard curves of cells grown on 2D tissue culture plastics (TCP) or encapsulated in 3D hydrogels after 4 h.

Figure 1. Standard curves for fibroblasts grown on 2D tissue culture plates or encapsulated in 3D hydrogels. AlamarBlue (A) and PicoGreen (B) standard curves generated from cell densities ranging from 0 to 500000. AlamarBlue (C) and PicoGreen (D) standard curves generated from cell densities ranging from 0 to 300000 after 4 h of incubation (n = 3).
Download figure:
Standard image High-resolution imageIn general, regardless of 2D or 3D culture, the readout of fluorescence values increased continuously with increasing cell number. However, compared with the cells cultured on TCP, encapsulating cells in hydrogels decreased the fluorescence values in both assays. Moreover, as shown in table 1, plating more than 300 000 cells well−1 affected the accuracy of AlamarBlue linear line and decreased the coefficient of determination value (R2) of the linear regression line to 0.94. With reference to the PicoGreen assay, although the fluorescence values of the digested hydrogels increased in comparison with undigested samples, the values were still not as high as those of the cells cultured on TCP. However, liberating the cells from the hydrogels by papain digestion demonstrated an obvious impact on the R2 values, as shown in table 1.
Table 1. R2 values of standard curves generated from cells cultured on 2D or encapsulated in hydrogels.
| Standard curves 0−500 000 cells | Standard curves 0−300 000 cells | |||
|---|---|---|---|---|
| AlamarBlue | PicoGreen | AlmarBlue | PicoGreen | |
| 2D cell culture | 0.945 | 0.999 | 0.993 | 0.998 |
| GelMA | 0.966 | 0.998 | 0.979 | 0.916 |
| Digested GelMA | — | — | — | 0.998 |
| Alginate | 0.983 | 0.967 | 0.960 | 0.924 |
| Digested Alginate | — | — | — | 0.983 |
3.2. Cell viability and morphology in cast hydrogels
The cells encapsulated within the hydrogels were viable and maintained good viability for up to 14 d. As shown in figures 2(A) and (B), cell distribution within the hydrogel space was good. On day 1, the cells in both GelMA and alginate cast hydrogels exhibited a rounded morphology. On days 7 and 14, only GelMA allowed cells to spread, especially towards the base of the hydrogel, as shown in figure 2(A). This morphological observation was confirmed by Phalloidin staining. The cells in the alginate hydrogels maintained their rounded morphology, while the cells in GelMA became elongated after 7 d, as shown in figure 2(C).

Figure 2. Cell Viability and cell morphology in cast hydrogels. Cell viability disclosed by Live/Dead staining: cross sections (A) and longitudinal sections (B). The live cells are stained green, and the dead cells red. (C) Morphology of the encapsulated cells disclosed by Phalloidin, which stains actin filaments red and DAPI, which stains nuclei blue.
Download figure:
Standard image High-resolution image3.3. Cell proliferation in cast hydrogels
Similar proliferation trends were observed for both AlamarBlue and undigested PicoGreen samples (figure 3). The number of cells in GelMA increased from day 1 to day 14. In the case of the digested GelMA samples, there was almost no increase in the cell number within 14 d. In contrast, the cell numbers in all alginate samples decreased from day 1 to day 14. More importantly, when cell numbers were extrapolated from the AlmarBlue 2D standard curve, the number was significantly underestimated. Based on an initial cell seeding density of 100 000/cast hydrogel, these data show that almost 80% of the cells were lost on day 1. In contrast, the standard curve generated from 3D hydrogels resulted in a more realistic cell number, 68% higher than the initial cell seeding on day 1. For PicoGreen, the influence of the papain digestion on the number of cells in both hydrogels was obvious on day 1.

Figure 3. Cell proliferation in cast hydrogels. (A)–(B) Change in cell number as a function of time after extrapolation from 2D standard curves of AlamarBlue and PicoGreen. (C)–(D) Corrected cell numbers calculated from their corresponding standard curves; the number of cells encapsulated in hydrogels was calculated from 3D standard curves while the number of cells which escaped the hydrogels to the bottom of the wells (alginate/GelMA well) was calculated from 2D standard curves. (E)–(H) The cell number counted from the Z-stacking of fluorescent images and from histological sections after image analysis. Data are presented as mean ± SD (n ⩾ 4). There were significant differences between timepoints within the same group (*p < 0.05), significant differences between alginate and GelMA (#p < 0.05) and significant differences between digested and undigested samples of the same group (•p < 0.05).
Download figure:
Standard image High-resolution imageIn all these assays, the cast hydrogel was transferred from the culture wells to new plates before the test. All cells which had escaped to the tissue culture plate were also evaluated. It was noted that on day 1, cells encapsulated in both hydrogels were unable to escape the matrix to the tissue culture plate. It took less than 7 d for cells to escape from GelMA, compared with 14 d for the cells in alginate. To further observe the change in cell number in the hydrogels, cells in cast hydrogels were stained with a fluorescent dye and imaged in a Z-Stacking mode (figures 3(E) and (F)). Image analysis of the Z-stacking showed a significant increase in the number of cells from day 1 to day 14. However, this increase was not significant in the case of the serial histological sections (figures 3(G) and (H)).
3.4. Cell viability, morphology and distribution in bioprinted hydrogels
As with the cells in the cast hydrogels, the bioprinted cells maintained very good viability up to 14 d. As shown in figure 4(A), most of the cells were stained green and there were very few red (dead) cells. Cells bioprinted in GelMA showed better morphology as early as day 1, while cells in alginate maintained a rounded morphology for up to 14 d (figure 4(B)).

Figure 4. Cell Viability and cell morphology in bioprinted hydrogels. Cell viability by live/dead staining in cross section (A). Live cells are stained green and dead cells red. (B) Staining of the encapsulated cells by Phalloidin and DAPI: Phalloidin stains actin filaments red and DAPI stains nuclei blue.
Download figure:
Standard image High-resolution image3.5. Cell proliferation in bioprinted hydrogels
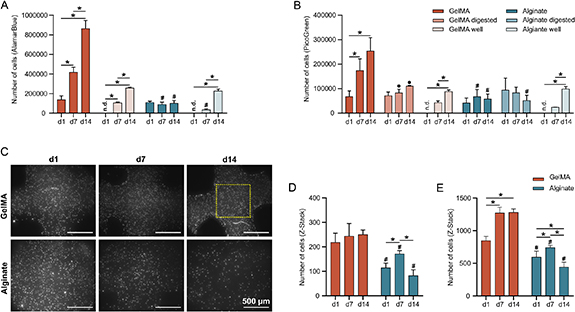
Compared with PicoGreen, AlamarBlue data showed higher cell numbers (table 2). Unlike alginate, GelMA supported more cell proliferation over time. For bioprinted cells in GelMA, both AlamarBlue and PicoGreen (digested and undigested samples) showed cell proliferation up to 14 d (figure 5). However, fewer cells were obtained from the digested samples on day 7 and 14 than from undigested samples. Unlike GelMA, digesting alginate with papain resulted in a different proliferation trend. The undigested alginate samples showed cell proliferation from day 1 to day 14, with the highest cell number at day 7. After digestion, there was a slight decrease in cell numbers on day 14. These results were confirmed by the image analyses of both the z-stacking and the serial sections (figures 5(C)–(E)). Image analysis of GelMA samples showed significant cell proliferation from day 1 to day 7, but the difference between 7 and 14 d was not significant.
Figure 5. Cell Proliferation in bioprinted hydrogels. (A)–(B) Change in cell number as a function of time, after extrapolation from their corresponding standard curves. The number of cells encapsulated in hydrogels was calculated from 3D standard curves and the number of cells which escaped from the hydrogels to the bottom of the wells (alginate/GelMA well) was calculated from 2D standard curves. (C)–(D) Cell numbers counted from the Z-stacking of fluorescent images. Cells were counted from either a central area of interest (D) or from the whole image (E). Data are presented as mean ± SD (n ⩾ 4). Significant differences between timepoints of the same group (*p < 0.05), between alginate and GelMA (#p < 0.05) and between digested and undigested samples of the same group (•p < 0.05).
Download figure:
Standard image High-resolution image
Table 2. Number of bioprinted cells calculated from standard curves obtained from 3D hydrogels.
| Cell number | ||||
|---|---|---|---|---|
| AlmarBlue | PicoGreen | |||
| Day 1 | Day 14 | Day 1 | Day 14 | |
| GelMA | 137 417 ± 39 746 | 863 116 ± 83 002 | 67 266 ± 1149 | 253 868 ± 25 642 |
| Digested GelMA | − | − | 69 655 ± 18 609 | 111 029 ± 1554 |
| Alginate | 108 419 ± 13 940 | 99 464 ± 30 174 | 41 161 ± 15 140 | 57 382 ± 23 817 |
| Digested Alginate | − | − | 93 617 ± 35 844 | 49 865 ± 29 726 |
4. Discussion
In bioprinting research, metabolic assays are typically used as indicators of cell viability and/or cell proliferation [4, 18]. There are several reports that at high cell density (200 000 cells cm−2) and 3D culture, AlamarBlue is not accurate [13, 16]. Different metabolic activity levels are reported for different cell densities cultured on 3D substrates[13]. Therefore, we first conducted AlamarBlue assays on a series of known cell numbers in 2D and 3D (cast hydrogel) cultures, in order to construct a linear calibration plot. The results obtained from the standard curves confirmed that high cell densities cultured on TCP led to inaccurate correlation between the resazurin reduction of the AlamarBlue and the cell number: the regression line did not fit the data points well with R2 = 0.94. This may be due to depletion of the resazurin pool or reduction to the nonfluorescent hydroresorufin [14]. In contrast, low cell densities (up to 3 × 10⁵ cells) demonstrated a better regression line with R2 = 0.99.
Clearly, quantification of cell numbers in a hydrogel by extrapolation from a standard curve generated from 2D cultures is erroneous and can lead to underestimated cell numbers. Our results showed a huge difference in the fluorescence values of 2D culture and cast hydrogels, especially at high cell density. Similarly, there was a pronounced difference in AlamarBlue fluorescence values between cells encapsulated in alginate and GelMA hydrogels, especially at high cell densities. These findings indicate that the accuracy of such metabolic assays is highly dependent on the efficiency of metabolite diffusion into and out of the hydrogel [13, 19]. Possibly, the carboxylate groups on the backbone of the alginate can lead to swelling and more adsorption of AlamarBlue compared to GelMA as obtained from the standard curves [20]. It was of interest to note that this was not the case for longer culture times: the metabolic activity of the cells became higher in GelMA than in alginate as a function of time. Unlike the round cells in the alginate, fibroblasts were reported to spread and migrate in GelMA, as they can degrade the matrix [21]. The cells escaped from GelMA hydrogel to the well plates after 7 d, compared with 14 d for the cells in the alginate. Consequently, the increase in the metabolic activity of the cells in GelMA is necessary to support their cytoskeletal activity during spreading and migration [22]. Degradation of the hydrogel network increases the permeability and in return the diffusion of the AlamarBlue. Cells encapsulated in degradable hydrogels, when cultured on a rigid substrate, migrate towards the rigid surface, and spread [23]. The migration of the cells from the hydrogel to the culture plates may result in a decrease in the number of cells inside the hydrogels. Most importantly, if the metabolic assays are performed in the same culture wells, without moving the hydrogels to new wells, the measurement will include the liberated cells on the 2D surface of the plates, resulting in overestimation of cell numbers.
More importantly, the cell number disclosed by AlamarBlue was much higher than for PicoGreen. In contrast to AlamarBlue, the PicoGreen reagent cannot penetrate intact cellular membranes, hence PicoGreen requires cell fixation and/or cell digestion. After PicoGreen dye binds to dsDNA, the fluorescence increases around 1000 times and is proportional to the amount of DNA [24]. Ng et al reported a linear correlation between PicoGreen fluorescence values and cell numbers, up to 400 000 cells, before saturation due to signal quenching [13]. They suggested that measuring total DNA is a more reliable method for quantifying cell proliferation in high cell density (>100 000 cells cm−2) and 3D cultures. However, the 3D scaffold used was 3D printed polycaprolactone and the cells were not encapsulated in a real 3D environment.
Papain was reported to digest the cell membrane and is therefore used to extract cells from gelatin and alginate hydrogels [25, 26]. Blaheta et al reported that to achieve high detection sensitivity (100 cells or 0.5 ng DNA), PicoGreen requires around 20 h of digestion of cells in papain solution [27]. We compared the number of cells inside the cast hydrogels before and after papain digestion. Papain digestion of hydrogels improved the accuracy of the standard curves: R2 = 0.99 for GelMA and 0.98 for alginate. Although the proliferation trend did not change, quantifying cell numbers from the digested samples by extrapolation from the standard curve generated from 3D cultures resulted in more accurate cell numbers. It should be noted that digestion of hydrogels on day 1 is important, as the hydrogels were still intact and not yet degraded. However, compared with undigested samples, digestion of GelMA (cast and bioprinted) at 7 and 14 d decreased the number of cells. To serve as a reliable indicator of the cell number in hydrogels, all DNA content must be extracted, without DNA degradation. Hoemann et al found that the fluorescence of DNA can be suppressed by papain itself at high concentrations [28]. Moreover, the authors reported that storing papain digests at −80 °C resulted in a loss of up to 50% of the original DNA fluorescence.
Generally, cell proliferation is subject to many levels of control. There is growing evidence that the linkage between cytoskeleton focal adhesions and regulators of cellular contractility contribute to the regulation of cell proliferation [29]. To proliferate, cells require an organized cytoskeleton and sufficient space within the hydrogels [23]. Changes in adhesion complexes and cytoskeleton are essential for cell-cycle progression and division [30]. The interruption of the actin cytoskeleton may result in an arrested S phase of the cell cycle in which DNA is replicated. Moreover, increased cell adhesion in G2, during which the cell prepares itself for mitosis, may decrease the number of cells entering mitosis [30]. Therefore, the amount of DNA measured in hydrogels can serve only as an approximation of actual cell numbers: the amount of DNA in any cell is dependent on the particular stage of the cell cycle. Altogether, these results disclose pronounced inaccuracies in resazurin-based assays compared with the DNA-based assays, not only in different hydrogels but also before and after dissociation.
To validate whether cells are truly proliferating in the hydrogels, we visually examined the cells in hydrogels by means of fixation and/or fluorescence staining (live/dead) with fluorescence microscopy. In addition to visual characterization of cell viability, fluorescence staining allows for capturing changes in cell morphology and cell migration. There is a general agreement that alginate serves as a matrix that can support cell survival [31]. Some studies reported that cells proliferate on the top of each other forming cell spheroids within the alginate, while others document no significant alteration in cell number over time. To great extent, this is dependent on the concentration of alginate used to encapsulate the cells. Lower alginate concentrations were reported to support a higher rate of cell proliferation than at higher concentrations (up to 5%) [32]. The round morphology of the cells in the alginate bioink is due to the limited interactions of cells with alginate as they do not actively degrade the alginate matrix [31]. Moreover, it is known that varying hydrogel stiffness affects fibroblasts morphology [33]. Cells usually follow gradients of matrix mechanical stiffness typically migrating from soft to rigid regions. It was reported that fibroblasts in soft hydrogels lack stress fibers, focal adhesions, and focal adhesion signaling, while cells cultured on collagen-coated rigid coverslips were unable to develop stress fibers and focal adhesions [34]. This can explain why cells in middle and upper part of the cast GelMA samples are rounded compared to the elongated cells in the lower part of the gel discs.
Unlike 2D culture, cells encapsulated in hydrogels require a series of xy images at fixed steps in the vertical direction to retrieve sufficient information. We stained the cells in the hydrogels with DAPI to produce Z-stack images of the entire construct and analyzed them using ImageJ software. The longitudinal and cross-sectional live/dead images confirmed the good spatial distribution and viability of the cells throughout the cast hydrogels. The slightly high incidence of cell death observed at the edges of GelMA discs compared to alginate hydrogels is likely due to the utilization of high-energy visible light and LAP during GelMA crosslinking [35]. The Z-stack images demonstrated a similar cell proliferation pattern obtained from PicoGreen and AlamarBlue. However, with large cast hydrogels and 3D bioprinted scaffolds, it is almost impossible to obtain accurate and reliable cell numbers from the entire structure, because the method is limited by the depth of light penetration and the working distance of the microscope [36]. Moreover, a greater limiting factor than light penetration is the diffusion of fluorescent dyes, which is usually less than 150 μm and highly dependent on the type of hydrogel [37]. Generally, the image analysis approach is very laborious, especially for large sample sizes, as the original images require pre-processing steps of segmentation, edge detection and signal-to-noise corrections [36]. To overcome these limitations, we performed histological serial sectioning of the hydrogels to count the cells from an imageable section. However, the natural heterogeneity, swelling, and the degradation of the hydrogels over time resulted in unreliable results.
Overall, our results disclosed the discrepancies between AlamarBlue, PicoGreen, and imaging assays and the potential errors when comparing data extrapolated from standard curves, generated from 2D cultures, with 3D hydrogels. Moreover, in order to study the actual proliferative capacity of the bioprinted cells, other methods, such as PCR, Ki-67 and cell cycle analysis might be needed.
5. Conclusions
In this study, we assessed the accuracy of using AlamarBlue, PicoGreen and image analysis methods to evaluate cell proliferation in cast and bioprinted GelMA and alginate hydrogels. The results showed pronounced discrepancies between these assays, attributable not only to their mechanisms of action but also to their different protocols. AlamarBlue staining is an indirect measure and can overestimate cell proliferation because other cellular activity such as migration increases the metabolic activity of the cells. Moreover, metabolic assays can be affected by culture conditions and the nature of hydrogels, such as their chemistry and permeability. While the PicoGreen assay is more sensitive and accurate than AlamarBlue, the technique is invasive and requires cell lysis and sometimes hydrogel digestion. Despite the advantage of capturing changes in cell morphology and cell migration, the use of image analysis as a tool for evaluating cell proliferation is subjective and time-consuming. Considering the limitations of these techniques, it is concluded that these methods give only an approximation of the cell numbers in hydrogels. As none of these methods alone can provide a comprehensive view of cell proliferation, it is recommended that a combination of methods should be applied in order to achieve a better understanding. Given that biofabrication is a field still in its infancy, further studies are warranted in order to standardize methods and protocols for precise quantification of cell numbers in printed bioinks.
Acknowledgments
This work has been funded by the Research Council of Norway through the 3DPRENT (Grant No. 302043), Olav Thon Foundation and Trond Mohn Foundation (BFS2018TMT10).
Data availability statement
All data that support the findings of this study are included within the article (and any supplementary files).
Conflict of interest
The authors declare no conflicts of interest.