
Abstract
The cancer microenvironment influences tumor progression and metastasis and is pivotal to consider when designing in vivo-like cancer models. Current preclinical testing platforms for cancer drug development are mainly limited to 2D cell culture systems that poorly mimic physiological environments and traditional, low throughput animal models. The aim of this work was to produce a tunable testing platform based on 3D printed scaffolds (3DPS) with a simple geometry that, by extracellular components and response of breast cancer reporter cells, mimics patient-derived scaffolds (PDS) of breast cancer. Here, the biocompatible polysaccharide alginate was used as base material to generate scaffolds consisting of a 3D grid containing periostin and hydroxyapatite. Breast cancer cell lines (MCF7 and MDA-MB-231) produced similar phenotypes and gene expression levels of cancer stem cell, epithelial–mesenchymal transition, differentiation and proliferation markers when cultured on 3DPS and PDS, contrasting conventional 2D cultures. Importantly, cells cultured on 3DPS and PDS showed scaffold-specific responses to cytotoxic drugs (doxorubicin and 5-fluorouracil) that were different from 2D cultured cells. In conclusion, the data presented support the use of a tunable alginate-based 3DPS as a tumor model in breast cancer drug discovery.
Export citation and abstract BibTeX RIS

Original content from this work may be used under the terms of the Creative Commons Attribution 4.0 license. Any further distribution of this work must maintain attribution to the author(s) and the title of the work, journal citation and DOI.
1. Introduction
Breast cancer is the primary cause of cancer related deaths in women worldwide [1]. This calls for the discovery of novel and more effective breast cancer treatments. The failure rate of oncology investigational drugs in clinical phase 1–3 today is estimated at 93% and has increased during the last decades [2], highlighting the shortcoming of current preclinical screening and validation platforms to mimic relevant in vivo-like growth conditions.
Breast cancer consists of cell populations, including a subset of cancer stem cells (CSCs) [3], also known as tumor initiating and self-renewable cells [4], which are resistant to drug therapy [5, 6]. Interestingly, in contrast to the conventional model of hierarchically subordinated cancer cells to parent CSC, cancer cells are now emerging as a population of plastic cells that can alternate between a differentiated and stem cell state [7]. In particular, breast CSC and non-CSC have a reversible phenotypic transition upon niche stimuli [8], underscoring the importance of the surrounding microenvironment in cancer development. Indeed, the composition of the extracellular matrix (ECM) of the microenvironment has been linked to tumorigenesis as well as clinical data on patient outcome from patient-derived scaffolds (PDS) [9, 10].
The impact of the complex cancer cell heterogeneity and ECM on the onset of breast cancer, as well as today's low number of new drugs successfully passing clinical phase III and reaching regulatory approval, emphasizes the challenge to develop new predictive pre-clinical platforms that better mimic the human environment and can be used for cancer drug development. Patient derived xenografts (PDXs) have emerged as a translational platform for cancer drug discovery and been shown to predict a patient's response to cancer drug therapy [11, 12]. However, the execution of PDX disadvantages from a low-throughput and high engraftment failure [12]. Today, a plethora of in vitro assays are available to study tumor parameters that work in compliance with replacing, reducing and refining the use of animals (3R principle) [13]. As an alternative to the conventional 2D culturing systems that lack biochemical and biomechanical cues from microenvironment, 3D embedded culturing platforms represent promising predictive models for in vivo tumorigenesis [14–16].
The aim of this study was to develop 3D printed scaffolds (3DPS) compatible with inhabiting reporter cell lines that due to the 3D printed microenvironment mimic key cell responses of PDS cultured cells and to use these as tumor models for cancer drug screening. Several studies focusing on material development and tissue engineering have successfully used materials based on polysaccharides, proteins, aminoglycans or synthetic molecules to create 3DPS [17]. In the context of breast cancer, collagen- [18], alginate- [19, 20] and synthetic poly ( -caprolactone)-based 3DPS have been shown to promote CSC enrichment [21, 22]. Key parameters of alginate are its modifiable physical properties such as elastic modulus and inert but functional chemistry. Thus, cell responses can be modulated by covalent coupling of functional groups to the alginate backbone or with additives [23]. In addition, alginate shows low immunogenic responses such as complement activation, cytokine release and leukocyte stimulation [24]. Here, breast cancer models were produced by extrusion-based 3D printing technology and alginate as a base material. Previous studies have shown PDS's to have an inherited fine meshwork [10] and that scaffold design affects cell traits [25]. In the present work, the 3DPS architecture was selected and printed as a 3D grid lattice, as a simple 3D environment that does not attempt to mimic the structural details of PDS's but allows rapid production of scaffolds facilitating high-throughput data generation needed in the forthcoming cancer drug screening process.
Tumor tissue in general have an increased stiffness due to the expression of cross-linking matrix proteins [26], promoting tumorigenesis [27]. In addition, breast cancer has micro calcifications/hydroxyapatite (HA) deposits that are used to score tumor malignancy [28]. HA is also known to increase the mechanical strength of alginate-based hydrogels [29, 30]. To produce 3DPS with a tumor-like microenvironment, HA was selected as a hydrogel additive to mimic the in vivo breast cancer calcifications and to increase hydrogel stiffness, simulating the stiffer microenvironment of tumors relative normal tissue. In addition, the cell secreted and matricellular protein periostin [31], which is overexpressed in breast cancer and has been shown to be important for CSC maintenance and metastasis [32–35], was used as an additive to improve the similarity in microenvironment composition between PDS and 3DPS. Here, the ER/PR+ MCF7 and triple negative MDA-MB-231 breast cells were selected as reporter cells due to their inherited phenotypic differences [36]. The reporter cells were shown to attach to 3DPS with a 3D and cell specific morphology as well as having a gene expression pattern and phenotype reflecting those of cells cultured on PDS. Exposing the 3DPS cultured cells to cancer drugs also showed that 3DPS system was superior to conventional 2D cell cultures by producing similar drug responses as PDS cultured cells.
Taken together, our data support the use of a tunable, alginate based, 3DPS model as a tumor microenvironment model for cancer drug discovery to identify drug candidates at a pre-clinical stage, thereby increasing the success rate in clinical studies and also reducing the use of animals in drug discovery.
2. Material and methods
2.1. Alginate characterizations
Micro analysis by compression measurements was used to determine the reduced compression modulus (Ec) of cross-linked alginate by using a Texture Analyzer instrument (TA XT plus from Stable Microsystems AB) equipped with a 2 mm diameter cylindrical stainless-steel probe (Stable Microsystems AB) and a stage-fitted climate chamber (Stable Microsystems AB) set to 37 °C to ensure a saturated water vapor environment. Alginate solution (2.5–15 w/v%) was poured into a mold of Ø25 mm and a depth of 5 mm made with an in-house Perfactory 4 mini XL printer (EnvisionTEC, GMBH, Germany) using an acrylic based liquid photopolymer (R11, EnvisionTEC GMBH), cross-linked as for macro analysis (supplementary methods) and analyzed (without trimming) using non-confined compressions at strain values at low (0%–2%, Mod1) and high (6%–10%, Mod10) range.
2.2. 3D-printing
Alginate (Protanal LF 10/60) (FMC) solutions of 2.5%–15% (w/v) were prepared by mixing alginate (Protanal LF 10/60, FMC) in water (Synergy Elix 15, Merck) by the use of an Ultra-Thurrax T50 digital dispenser (IKA) equipped with an S 25 N–25 G dispensing tool. The mixing was done overnight (ON) at 5000 rpm or 1 min at 8000 rpm and let to rest over night (ON) at room temperature (RT). The alginate solutions were transferred to 4 °C until further use.
For cell studies, alginate solutions containing hydroxyapatite (HA)(Sigma-Aldrich) of 5% (w/v), as well as solutions with HA and 2 µg ml−1 recombinant Human Periostin/OSF-2 Protein (R&D systems), were prepared. Materials were 3D printed (∅20 mm × 2 mm; grid distance 1.5 mm, 90°) in four layers to produce a 3D mesh scaffold using an EnvisionTEC 4th Gen 3D-Bioplotter® (EnvisionTEC GmbH) placed in a laminar airflow hood. The scaffold was designed using a computer aided design software, Autodesk® Fusion 360™ 2019 (Autodesk Inc.) and exported to the printer as a STL-file. The printing parameters such as temperature (10 °C–20 °C), pressure (0.6 bar), speed (35 mm s−1) and needle offset (0.45–0.50 mm) were controlled using Visual machine software (EnvisonTEC GmbH). Printing was performed using a needle diameter of 400 µm and the resulting 3D prints were directly cross-linked by spraying 0.1 M CaCl2 (VWR) at a flux of 1.5 ± 0.5 mg cm−2. Printed 3DPS were stored in excess 0.1 M CaCl2 (VWR) at 4 °C for up to two weeks. Prior to cell seeding, 3DPS were equilibrated for 1 h in cell specific media.
2.3. 2D and 3D cell culture
MCF7 (ATCC) cells were cultured in 1X Dulbecco's modified eagle medium (DMEM)(Gibco) supplemented with 10% (v/v) fetal bovine serum (FBS, Sigma-Aldrich), 1% (v/v) L-glutamine (Sigma-Aldrich), 1% (v/v) penicillin/streptomycin (Sigma-Aldrich) and 1% (v/v) MEM Non-Essential Amino Acid solution (100X) (Sigma-Aldrich). MDA-MB-231 (ATCC) cells were cultured in 1X RPMI (Gibco) supplemented with 10% (v/v) FBS, 1% (v/v) L-glutamine, 1% (v/v) penicillin/streptomycin and 1% (v/v) 100 mM sodium pyruvate (Gibco). All cells were cultured at 5% CO2 at 37 °C.
For 3D culture, cells were detached from 2D culture plates using 0.25% Trypsin-EDTA (Gibco), centrifuged at 300 × G for 3 min and cell pellet was re-suspended in cell media. Cells were counted using an automated cell counter (MOXI, Orlflo), seeded at a density of 5 × 10⁴ cells per well in a 48 well plate (molded gels), 1 × 10⁵ cells per well in a 12 well plate (scaffolds), 1 × 10⁶ cells per well in a 12 well plate (scaffolds; flow cytometry and MDA-MB-231 for SEM) or 3 × 10⁵ cells per well in a 12 well plate (scaffolds; drug tests, cell functionality studies; western blotting, DNA levels) and cultured for 1, 7, 14 or 21 days. Molds and scaffolds were moved to six well plates (Polystyrene, Sarstedt) after 24 h. Scaffolds were thereafter moved to new medium every three to four days. 2D controls were seeded with a cell density of 2 × 10⁵ cells (quantitative polymerase chain reaction (qPCR), SEM) or 1.2 × 10⁵ cells (Drug testing) per well in a six-well plate and cultured for 48 h or 72 h.
For cell detachment, scaffolds were placed in a 12 well plate (Polystyrene, Sarstedt) and gently washed twice in media to remove unattached cells. Attaching cells were detached by incubating the scaffolds in 0.25% Trypsin-EDTA (Gibco) for 5 min at 150 rpm at 37 °C, followed by manual pipetting of the cell:trypsin solution onto the scaffolds. The cell:trypsin solution was collected and the scaffolds were rinsed quickly once more with 0.25% Trypsin-EDTA (Gibco). The trypsin was deactivated in cell media and cell suspension was centrifuged at 300 × G for 3 min. Cells were re-suspended in cell media and counted using a dispensable hemocytometer (C-Chip, NanoEnTek). Cell detachment efficiency was measured by comparing the DNA content in the cell suspension and trypsin treated scaffolds that had gently been washed twice in media following cell detachment. Detached cells and scaffolds were placed in lysis buffer (20 mM Tris pH 7.6, 2 mM EDTA, 2% SDS) for 20 min on an orbital wheel at RT and DNA content was measured using Qubit ds DNA HS Assay kit (Invitrogen). Cell detachment was shown to be 80%–99% effective (figure S1 (available online at stacks.iop.org/BMM/16/045046/mmedia)).
2.4. Determining relative cell number by alamar blue
Molded hydrogels of alginate were gently washed twice in phosphate-buffered saline (PBS) and moved to a 96 well plate (Polystyrene, Sarstedt). Alamar blue (10× diluted in PBS) was added to media in a 1:5 ratio and incubated for 2.5 h at 5% CO2 at 37 °C. Fluorescence was detected using a multi-label counter reader Victor3 (PerkinElmer) and an excitation filter of 544/15 nm (1420-503, PerkinElmer).
2.5. Live/dead staining
Cells were cultured for 14 days on scaffolds and detached as described above. 1 × 10⁵ cells were centrifuged at 300 × G for 3 min and resuspended in media containing 10% trypan blue (Sigma-Aldrich). Dead (blue) and live (non-colored) cells were counted using a dispensable hemocytometer (C-Chip, NanoEnTek).
2.6. Flow cytometry
Cells cultured for 18 h on scaffolds were detached as described above, syringed (Soft-Ject, Henke Sass Wolf) using a 25G needle (Fine-Ject, Henke Sass Wolf) to obtain a single cell suspension and filtered through a 35 µm mesh (352235, Falcon by Corning) to remove scaffold debris. Cells were spun at 300 × G for 3 min, re-suspended and incubated in Vindelöv reagent (10 mM Tris pH8, 10 mM NaCl, 10 mM Tris pH8, 10 mM NaCl, 10 mM Tris pH8, 10 mM NaCl, 0.1% v/v NP-40, 700 U l−1 RNase R4642 Sigma-Aldrich, 75 µM propidium iodide P4864 Sigma-Aldrich) for 1 h at RT in dark. Cells were sorted by fluorescence using a flow cytometer (Accuri C6, BD Biosciences). Data was exported and analyzed by FlowJo (FlowJo, LLC). Cell cycle phases of single cells were quantified using Watson pragmatic modeling.
2.7. Functional assays
Clonogenic and wound healing assays were performed using cells cultured for 48 h in 2D or 21 days on scaffolds and detached as described above. For the clonogenic assay, cells were seeded in six-well plates at a density of 50 cells cm−2, cultured for six to seven days to form colonies and stained with crystal violet. Holoclones were identified as colonies (⩾32 cells) with small, clustered cells, and quantified using Gelcount software (Oxford Optronix). For the wound-healing assay, 50 µl of a cell suspension of 1.000.000 cells ml−1 was seeded in silicone wound-healing inserts placed in a 24 well plate format (Ibidi). Cells were cultured for 24 h and inserts were removed. Images were taken every 6 h using Axio Vert A1 microscope (Carl-Zeiss) and analyzed in ImageJ [37] using MRI Wound Healing Tool [38].
2.8. Cell imaging
For sectioning, cells cultured for 14 days on 3DPS were gently washed once in cell media and fixated for 1 h at RT in paraformaldehyde (PFA)(Histolab) diluted to 2% in TBS (50 mM Trizma-HCl, Sigma-Aldrich; 150 mM NaCl, Merck; pH 7.5) with 0.1 mM CaCl2 (Merck). Scaffolds were paraffin embedded, sectioned to 4.5 µm thickness using a retracting microtome (Rotary one, LKB Bromma), dried O.N at 37 °C, de-paraffinized, counterstained with hematoxylin and eosin, de-hydrated and mounted with pertex (Histolab). Sections were imaged with Leica SCN400 Slide Scanner (Meyer instruments, Houston, TX). Representative images were selected and exported using Leica SlidePath Gateway software and analyzed with ImageJ software [37].
For SEM, cells cultured for 48 h in 2D, for 14 days (MCF7) or 5 days (MDA-MB-231) on 3DPS, were gently washed once in cell media and fixated for 1 h at RT in 2.5% glutaraldehyde (G7651, Sigma-Aldrich) diluted in cell media. Scaffolds were washed once in TBS (50 mM Trizma-HCl, Sigma-Aldrich; 150 mM NaCl, Merck; pH 7.5) with 0.1 mM CaCl2 (Merck), fixated for 1 h at RT in 1% osmium tetroxide (75632, Sigma-Aldrich) in TBS (50 mM Trizma-HCl, Sigma-Aldrich; 150 mM NaCl, Merck; pH 7.5) with 0.1 mM CaCl2 (Merck), rinsed in deionized water, plunge-frozen in liquid propane (EMS-002 Rapid Immersion Freezer, Electron Microscopy Sciences) and freeze-dried ON (VirTis Sentry 2.0 Benchtop Freeze Dryer, SP Scientific). Afterwards, samples were mounted on aluminum stubs by adhesive carbon tabs (G3358 Spectro Tabs, Agar Scientific) and coated with a 10 nm Au/Pd conducting thin film by sputter-coater (Model 682 PECS, Gatan Inc.). Samples were imaged by Zeiss SUPRA® 40VP SEM operated in secondary electron mode at 3.0–4.1 kV acceleration voltage, 9–17 mm working distance and 100–250 000× magnification range.
HA particles were mounted and measured at two angles (D1 = 0° and D2 = 90°). The diameter of the particles was calculated as the average of the two measurements while the roundness was calculated by dividing D1 with D2. Cell diameter was assessed using cells in SEM images and measured in ImageJ as the longest distance between cell-to-cell edges.
2.9. Drug treatments
Cells cultured for 24 h in 2D or for 21 days on scaffolds were treated for 48 h with 0.3 µM doxorubicin (DOX) or 100 µM 5-fluorouracil (5-FU) (representing a drug dose of 1X), with increasing drug dosages (5X or 10X) or with medium only (untreated) and collected for qPCR analysis.
2.10. qPCR
Cells cultured for 48 h in 2D, for 14 days on scaffolds or drug treated cells were gently washed twice in cell medium, transferred into 2 ml Eppendorf tubes (scaffolds) and lysed with 700 µl QIAzol lysing reagent (Qiagen) or lysis buffer (used on cells cultured on a gradient of alginate concentration) [39], snap-frozen and stored at −80 °C. Prior to RNA isolation, samples were thawed on ice for 30 min and disrupted using 5 mm stainless steel beads (Qiagen) and a TissueLyser II (Qiagen) for 2 × 2.5 min at 25 Hz. Automatized (QIAcube, Qiagen) or manual isolation of total RNA was performed with using a Qiazol based RNA extraction kit (miRNeasy Micro, Qiagen) with on-column DNase digestion. RNA concentration was quantified with NanoDrop (ND-1000, Saveen Werner) and RNA integrity was randomly assessed using Bioanalyzer 2100 (Agilent). Complementary DNA (cDNA) was generated by using a GrandScript cDNA synthesis kit (TATAA Biocenter) and a T100 Thermal Cycler (BioRad). Reverse transcription was performed in 20 µl reactions at 22 °C for 5 min, 42 °C for 30 min, 85 °C for 5 min followed by cooling to 4 °C. cDNA generated from QIAzol-based RNA extractions were diluted 1:4 in RNase free water (Invitrogen). cDNA generated from lysis buffer-based RNA extractions were pre-amplified in 50 µl reactions with 1× SYBR GrandMaster Mix (TATAA Biocenter), 0.04 µM of a primer pool (table S1) and 1 µg ml−1 of bovine serum albumin (BSA)(Thermo Scientific™). Pre-amplification was performed using a CFX96 Touch Real Time Cycler (Bio-Rad) at 95 °C for 3 min, 15 cycles of amplification at 95 °C for 20 s, 60 °C for 3 min and 72 °C for 20 s. After finalizing the last cycle, samples were snap frozen on dry ice, thawed on ice and diluted 1:5 times in TE-buffer (Invitrogen). For qPCR, all samples were diluted 1:3 in a total volume of 6 µl using primers (table S1) and SyBR Grandmaster (TATAA) with a final concentration of 400 nM and 1× respectively. qPCR was run using a CFX384 Touch Real Time Cycler (Bio-Rad) at 95 °C for 2 min, 39 cycles of amplification at 95 °C for 5 s, 60 °C for 20 s and 70 °C for 20 s followed by a melting curve analysis at 65 °C–95 °C with 0.5 °C per 5 s increments. CFX Manager Software version 3.1 (Bio-Rad) was used to determine the cycles of quantification (Cq) values by the regression method. Data was exported and analyzed with GenEx (MultiD). Samples and/or genes with >25% missing values were removed. Missing values were imputed based on replicates, cut-off was set at Cq-value 35 and remaining missing values to Cq-value 35. All values were normalized to reference genes identified with NormFinder algorithm, transformed to relative values and log2 scale. Optimal reference genes were evaluated in each experiment, resulting in the use of different reference genes. Outliers were identified and removed by the ROUT method in GraphPad Prism (GraphPad) using a Q-value of 5%. Principal component analyses (PCA), separating samples (scores) based on gene expression (loadings), on auto-scaled data were performed using GenEx (MultID). qPCR was performed in agreement with the minimum information for publication of quantitative real-time PCR experiments (MIQE) guidelines [40].
2.11. Statistical analysis
All statistical data analyses were processed using GraphPad Prism v8 (GraphPad).
2.12. Ethics statement
The work described has been carried out in accordance with The Code of Ethics of the World Medical Association (Declaration of Helsinki). Work using patient derived tumors has been approved by the Swedish Ethical Review Authority (Etikprövningsnämnden, DNR 515-12 and T972-18). Patients have declared a written consent of using their tumors for research purpose.
3. Results
3.1. Alginate characterizations
There are a wide range of different alginates [41], where the molecular weight and M/G ratio will affect the viscosity and/or the elastic modulus of alginate [42, 43]. In addition, the presence of ions has shown to affect the thixotropic behavior of alginate [44]. While the elastic modulus is known to affect cells in contact of the alginate [45], the viscosity and thixotropic behavior will influence 3D printing qualities. Thus, it is important to characterize alginate based on these parameters prior to use. Here, purchased alginate LF10/60 was shown to have a low average [Mg2+], [Ca2+] and [K+] of 38, 7 and 155 ppm (w/w) respectively and an average [Na+] of 10% (w/w) (table S2). The average molecular weight of alginate was approximated to 112.000 g mol−1 and with a narrow dispersity (D, weight- /number-averaged molar mass) of 1.12. M/G residues were determined to be of an equimolar concentration (table S2), consistent with a previous study [43].
Cross-linked alginate samples were further characterized by different means to determine the elastic properties of alginate at different alginate concentrations. Here, small amplitude oscillatory shear (SAOS) rheometry, compression measurements and nanoindentation was used to define G', Ec and Er moduli respectively. Macro analysis by SAOS rheometry (figure S2(A)) indicated G' to maintain at 5–8 kPa between an alginate concentration of 2.5%–12% (w/v) while increasing to 45 kPa at a concentration of 15% (w/v), supporting previous data [46]. No differences in G' was observed between 23 °C and 37 °C. In contrast, micro analysis by compression measurements showed a step-wise increases in Ec between 2.5% and 12% of alginate with a 5 and 15 fold increase for Mod1 (100–500 kPa) and Mod10 (100–1500 kPa) respectively while no difference was observed between 12.5% and 15% (figure 1(A)). In agreement with these data, analysis by nanoindentation showed a gradual increase of Er with increasing alginate concentration (2.5%–8%), although fluctuating results were observed using the higher alginate concentrations (10%–15%) (figure S2(B)).
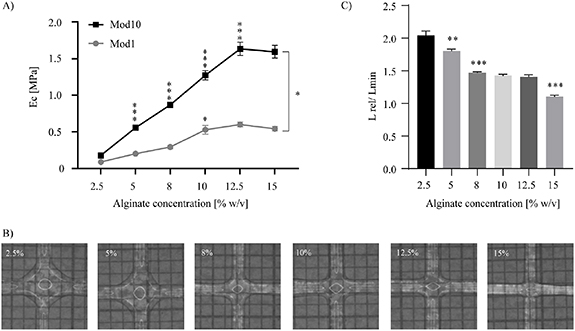
Figure 1. Alginate concentration affects elastic modulus of alginate and printability. (A)–(C) Alginate was mixed at various concentrations (2.5%–15%). (A) Macro analysis of compression modulus (Ec) by compression measurements at strain values of 0%–0.2% (Mod1) or 6%–10% (Mod10). Mean ± SEM is shown (n = 13–19), two-way ANOVA; Sidak's post hoc test for multiple comparison; significance is indicated between a given and pre-adjacent alginate concentration or between groups (brackets). (B) Flow-out analysis by cross-testing. (C) Quantification of flow-out using the ratio between the measured (L) and theoretical (Lmin) length of the cross section of two perpendicular filaments (see figure S3). Mean ± SEM is shown (n = 4); one-way ANOVA; Tukey's post hoc test for multiple comparison; significance is indicated between a given and pre-adjacent alginate concentration. * p-value < 0.05, ** p-value < 0.01, *** p-value < 0.001.
Download figure:
Standard image High-resolution image3.2. 3D-printing
Prior to producing 3DPS for cell culture, alginate of 2.5%–15% was cross-printed for dimensional accuracy testing (figures 1(B) and S3). Lower concentrations of alginate (2.5%–5%) displayed large flow-out ratios of 1.8–2.05 compared to 1.1–1.5 of higher concentrated alginate (figure 1(C)). Consistent with cross-testing, 2.5%–5% alginate gave no, or low, porosity when used in layer-by-layer 3D printing (data not shown). While alginate of 8%–15% resulted in printable 3DPS with a relatively low flow-out, 3DPS of 15% alginate had low filament-to-filament adhesion compared to 8%–12.5% alginate (data not shown). Thus, a range between 8% and 12.5% of alginate was suitable for 3D-printing.
3.3. Proliferation and expression of reporter genes as a function of alginate concentration
In choosing an alginate concentration suitable for cell culture, molds of different alginate concentrations of 2.5%–15% were evaluated by its ability to uphold cell proliferation. Increasing alginate concentrations showed a gradual decrease in cell number after seven days of cell culture (figure 2(A)), suggesting a reduced proliferation rate with increasing alginate concentration. Based on the characterization of alginate (chemical, mechanical and printability) and cell proliferation data, alginate hydrogels of 8%–12.5% were printed using an extrusion-based printer. MCF7 cells cultured on 3DPS indicated a higher expression of the pluripotency (POU5F1) marker (p = 0.051) with increasing alginate concentration, supporting previous data [47] (figure 2(B)). In addition, all 3DPS promoted increased expression of CSC (CD44) and epithelial–mesenchymal transition (EMT) (TWIST1) markers while reducing the expression of proliferation (MKI67) marker compared to 2D control (table S3).
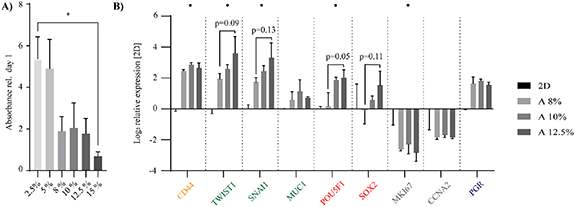
Figure 2. Cells cultured on increasing concentration of alginate show a decreased proliferation and increased expression of pluripotency and EMT markers. MCF7 cells were cultured in 2D or on molds or 3DPS for two weeks with increasing alginate concentrations. (A) Metabolic activity of cells (molds) was measured by alamar blue at one and seven days post seeding and plotted relative to day 1. Mean ± SEM is shown (n = 3–4); one-way ANOVA; Tukey's post hoc test for multiple comparisons. (B) Gene expression profile (3DPS) was measured by qPCR and 2D control was arbitrary set to a value of zero for each gene. Solid dot (•) indicates if the expression of a certain gene is higher/lower in alginate samples (>1) compared to 2D. Mean ± SEM is shown (n = 3); two-way ANOVA; Tukey's post hoc test for multiple comparisons. * p-value < 0.05.
Download figure:
Standard image High-resolution image3.4. Cells cultured on 3DPS and PDS display a similar phenotype
As the gene expression response of the reporter cells seemed to escalate with increasing concentration of alginate, the lowest alginate concentration of 8% was selected as a base-material in order to avoid masking potential fine-tuning effects of additives. When comparing the 3DPS with the commonly used ECM substitute Matrigel [14], the MCF7 reporter cell expression of CSC (CD44), EMT (TWIST1, SNAI1, MUC1), pluripotency (POU5F1, SOX2) and proliferation (MKI67, CCNA2) markers were similar between 8% alginate and Matrigel (figure S4), supporting 8% alginate as a relevant base material for 3DPS.
The concept of using additives to the 3DPS was explored by a protein additive (periostin, P) and HA micro-particles. The average diameter and roundness of the HA-particles was estimated from SEM images, Ø = 19 ± 10 µm (SD), roundness = 0.85 ± 0.11 (SD) (figure S5). HA micro-particles were distributed as large spherical depositions throughout the material (figures S6(Ai) and (Aii)) and changed the surface topography and increased Er compared to pure base-material (figures 3(A) and S7). It can be noted that the surface-exposed HA particles in the 3DPS of alginate-HA mixture were covered with alginate, thus discriminating any eventual effects on cell-response due to differences in chemical functional groups at the interface. Phase contrast microscopy of 3DPS and PDS cultures identified cancer cells gathered in clusters alongside the surface with a rounded phenotype (figures 3(Bi), (Ci) and S8, S6(Ai), S6(Bi)). Cell attachment and the presence of cell layers were confirmed by hematoxylin/eosin stained sections of 3DPS and PDS (figures 3(Bii), (Cii) and S6(Aii), S6(Bii)). Cell morphology was further characterized with SEM, which confirmed that reporter cells were present as clusters/layers (figures 3(Biii), (Biiii), (Ciii), (Ciiii) and S6(Aiii), S6(Aiiii), S6(Biii), S6(Biiii)), contrasting the monolayer of 2D cultured cells (figure 3(D)) and consistent with similar work [48]. In addition, the two cell lines presented cell-line specific morphologies on 3DPS and PDS. Specifically, MCF7 grew in tight sheets (figures 3(Biii), (D)) while MDA-MB-231 cells had a more dispersed growth characteristic and showed cellular protrusions connected to the material surface (figures 3(Ciii), (D)), supporting cell attachment. Furthermore, the cells favored the porous structure of the scaffold, growing inside and across the structures (figure S9).

Figure 3. Cells attaching to PDS and 3DPS gather in clusters and have cell specific morphologies. (A) Plain base material (8% alginate) with or without hydroxyapatite (HA). (B)–(D) MCF7 (B) and (D) or MDA-MB-231 (C) and (D) cells were seeded and cultured on patient-derived scaffolds (PDS) or 3D printed scaffolds (3DPS, 8% alginate). Cell morphology is shown by phase-contrast microscopy (Bi, Ci), H&E staining (Bii, Cii) and scanning electron microcopy (Biii and Biiii, Ciii and Ciiii, Di, Dii, Diii, Diiii). Dotted line marks edge of the material (Bii, Cii). Scale-bar 100 µm (A, Bi, Bii, Ci, Cii), 20 µm (Biii, Ciii), 10 µm (Biiii, Ciiii) and 50 µm (D).
Download figure:
Standard image High-resolution image3.5. Cell cycle phase distribution of attaching breast cancer cells are similar in 3DPS with different compositions
The initial effect of 3DPS and PDS microenvironment on cell cycle phase distribution of attaching MCF7 and MDA-MB-231 cells was studied by flow cytometry 18 h post cell seeding. MCF7 cells showed a similar ratio of cell cycle phases between G0/1, S and G2/M on 3DPS and PDS (figure 4(A)), indicating an identical proliferation rate. The ratio of attaching MCF7 cells were similar in all 3DPS, although to a less extent compared to PDS (figure 4(B)). In contrast to MCF7 cells, MDA-MB-231 cells cultured on PDS had a higher ratio of cells in S-phase compared to 3DPS, suggesting a higher proliferation on PDS (figure S10(A)). In addition, MDA-MB-231 cells attached to a similar extent to 3DPS and PDS, contrasting the higher cell attachment of MCF7 cells on PDS compared to 3DPS (figure S10(B)).
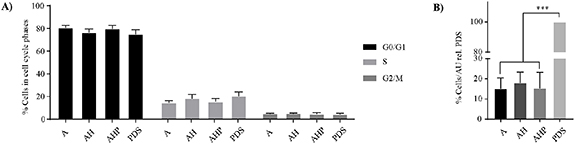
Figure 4. Cell cycle phases of attaching cells are similar in PDS and 3DPS while a relatively higher number of cells attach to PDS compared to 3DPS. (A) MCF7 cells were seeded and cultured for 18 h prior to cell cycle phase analysis by flow cytometry. Mean ± SEM is shown (n = 3); two-way ANOVA; Tukey's post hoc test for multiple comparison. (B) The number of detaching cells was normalized to area unit (AU) and presented as a percentage relative PDS. Mean ± SEM is shown (n = 3). One-way ANOVA, Tukey's post hoc test for multiple comparison. *** p-value < 0.001.
Download figure:
Standard image High-resolution image3.6. Reporter cells show a cell- and scaffold-specific phenotype
Reporter cells, seeded and cultured for two weeks on PDS and 3DPS, were detached and analyzed by viability, cell number and proliferative state. MCF7 (figure 5(A)) and MDA-MB-231 (figure S11(A)) cells cultured on PDS and 3DPS had a similar viability as determined by trypan blue staining. The cell number ratio between PDS and 3DPS cultured MCF7 cells was constant between day 1 and 14 (table S4) (figures 4(B) and 5(B)), suggesting a similar proliferation rate of MCF7 cells on 3DPS and PDS. Interestingly, the ratio of MDA-MB-231 cells cultured on 3DPS and PDS decreased (figures S10(B) and S11(B)), supporting that MDA-MB-231 had increased proliferation on PDS, consistent with the cell cycle analysis of MDA-MB-231 cells at 18 h post cell seeding (figure S10(A)). MDA-MB-231 cells further showed a tendency (p = 0.06–0.1) for having a lower percentage of proliferative cells after two weeks in culture on PDS compared to 3DPS as quantified by immunohistochemistry (Ki-67) (figures S11(C) and S12(B)). In contrast, MCF7 cells showed similar proliferation after two weeks in 3DPS and PDS cultures (figures 5(C) and S12(A)), which is consistent with the maintained cell number ratio of PDS to 3DPS between 1 and 14 days. Both MCF7 and MDA-MB-231 cells had lower proliferation when cultured on 3DPS and PDS compared to 2D cultured cells (figures 5(D) and S11(D)).
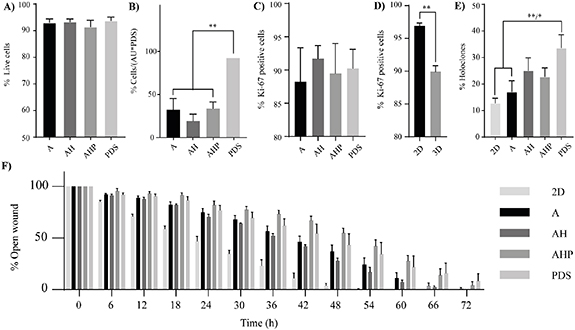
Figure 5. 3D environment increases holoclone formation by material specific components and reduces cell proliferation. (A)–(F) MCF7 cells were cultured for two to three weeks on PDS and 3DPS, detached and analyzed. (A) Cell viability was measured using trypan blue staining. Mean ± SEM is shown (n = 7–8); one-way ANOVA; Tukey's post hoc test for multiple comparison. (B) Cell count using burke-chamber. The number of detaching cells was normalized to area unit (AU) and presented as a percentage relative PDS. Mean ± SEM is shown (n = 3); one-way ANOVA; Tukey's post hoc test for multiple comparison. (C) Immunohistochemistry (Ki-67). Mean ± SEM is shown (n = 4); one-way ANOVA; Tukey's post hoc test for multiple comparison. (D) Immunohistochemistry (Ki-67). Mean ± SEM is shown (n = 3–16); Student's t-test. (E) Holoclone formation. Mean ± SEM is shown (n = 8–9); one-way ANOVA; Tukey's post hoc test for multiple comparison. (F) Wound closure. Mean ± SEM is shown (n = 3). * p-value < 0.05, ** p-value < 0.01.
Download figure:
Standard image High-resolution imageThe potential of 3DPS and PDS to induce stem-like cells was studied by analyzing the reporter cells' ability to form holoclones (figures 5(E), S11(E), S12(C) and S12(D)). Both cell lines formed fewer holoclones in 2D and alginate compared to PDS cultured cells, whereas there was no difference between PDS and alginate with HA additives (alginate hydroxyapatite (AH) and alginate hydroxyapatite periostin (AHP)). This indicates that the microenvironment of alginate-scaffolds with additives of HA and periostin was more similar to PDS in terms of ability of inducing cancer stem-like abilities. To further evaluate the effect of the 3D materials on cell behavior, a wound-healing assay was used to analyze migration properties of the reporter cells. Here, the wound-closure time was shown to be less for 2D relative 3D cultured MCF7 cells, likely reflecting the higher proliferation rate of 2D cultured cells shown in previous data (figure 5(D)). Interestingly, a comparison between 3D cultured cells (with equal proliferation rates) showed AHP and PDS cultured cells to have a similar migration rate, contrasting A and AH cultured cells (figure 5(F) and table S5). In the more proliferative cell line MDA-MB-231, no effect on cell migration properties by material composition was shown, where cells closed the wound in 48 h compared to 72 h by MCF7 cells (figure S11(F)).
3.7. HA and periostin change the expression of specific genes in a cell dependent manner to tune EMT and pluripotency markers
The ability to adjust the markers of different cell traits in the reporter cells by 3DPS additives to mirror the response of PDS cultured cells was studied by qPCR. Generally, 3DPS and PDS cultured cells showed increased expression of CSC (CD44, ETV1, MALAT1) and EMT (TWIST1, SNAI1, MUC1) markers and reduced expression of differentiation (EPCAM) and proliferation (MKI67, CCNA2) markers relative to 2D cultured cells, supporting the qPCR data using different alginate concentrations (figures 6 and S13) (tables S6 and S7).

Figure 6. AH and protein additives in 3DPS alters gene expression levels of cultured cells. MCF7 cells was cultured for two weeks on PDS or 3DPS. The gene expression profile was measured by qPCR and 2D control was arbitrary set to a value of zero for each gene. Solid dot (•) indicates if the expression of a certain gene is higher/lower in scaffolds samples (>1) compared to 2D. Mean ± SEM is shown (n = 3); two-way ANOVA; Tukey's post hoc test for multiple comparison. * p-value < 0.05, ** p-value < 0.01, *** p-value < 0.001.
Download figure:
Standard image High-resolution imageIn addition, immunocytochemistry of 3D cultured MCF7 cells indicated similar MUC1 and EPCAM levels relative to 2D cultured cells, whereas 3D cultured MDA-MB-231 cells were indicated to have an upregulation of MUC1 levels relative 2D cultured cells and 3D material specific levels of EPCAM (figures S14(A)–(D)). Protein level analysis by western blotting also confirmed increased levels of POU5F1 and decreased levels of CCNA2 in 3D relative 2D cultured cells whilst showing a cell lines specific expression of CD44. Specifically, MCF7 cells showed an upregulation of CD44 levels whilst MDA-MB-231 cells showed similar levels of CD44 in 2D relative 3D cultured cells (figures S14(E) and (F)), consistent with CD44 being identified and used as a reference gene for qPCR analysis in MDA-MB-231 cells (data not shown).
When studying the effect of hydrogel additives in MCF7 cells, HA induced an increased expression of an EMT (MUC1) marker, contrasting the decreased expression of EMT (TWIST1, MUC1) markers by periostin. Thus, the change in gene expression in the reporter cell line is additive specific. Surprisingly, in contrast to the MCF7 cell line, HA reduced whilst periostin increased the expression of a pluripotency (POU5F1) marker in MDA-MB-231 cells. Thus, the effect of hydrogel additives is also shown to be cell line specific.
3.8. Drug treated reporter cell lines exhibit a 3D and drug specific response in the expression of specific genes
Reporter cells cultured on 3DPS (AHP) and PDS were treated with the cytotoxic drugs DOX (Intercalation into DNA/generation of free radicals) [49] and 5-FU (thymidylate synthase inhibitor) [50] and the expression of a defined set of genes were determined by qPCR. Using MCF7 cells, DOX treatment resulted in a dose-dependent clustering of cells cultured on 2D, 3DPS and PDS, according to PCA of qPCR data (figures 7(A) and (B)). 2D cultured cells had relative 3DPS and/or PDS cultured cells, a higher response to both cytotoxic drugs by the absolute expression of proliferation (MKI67, CCNA2), pluripotency (SOX2) and EMT (SNAI1) markers while having a lower response of drug transport (ABCG2; DOX specific), pluripotency (POU5F1, DOX specific) and EMT (VIM) markers (figures 7(C) and 8(C)) (table S8).
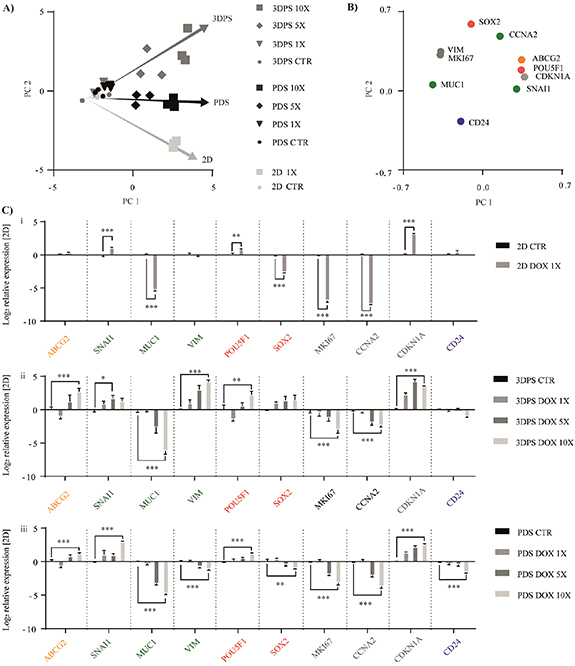
Figure 7. Doxorubicin treated cells show a dose- and material-dependent gene expression clustering. MCF7 cells were cultured for three weeks on PDS or 3DPS, treated with doxorubicin and gene expression profile was measured by qPCR. (A), (B) Principal component analysis of gene expression data presented as sample scores (A) and gene loading (B). (C) Bar-plot analysis of gene expression of 2D (Ci), 3DPS (Cii) and PDS (Ciii) cultured cells treated with doxorubicin (DOX) at increasing concentrations. The gene expression profile was measured by qPCR and 2D control was arbitrary set to a value of zero for each gene. Mean ± SEM is shown (n = 3); two-way ANOVA; Sidak's post hoc test for multiple comparison (2D); Tukey's post hoc test for multiple comparison (3DPS and PDS). * p-value < 0.05, ** p-value < 0.01, *** p-value < 0.001. CTR = untreated control. X = drug dosage.
Download figure:
Standard image High-resolution image
Figure 8. 5-Fluorouracil treated cells show a dose- and material-dependent gene expression clustering. MCF7 cells were cultured for three weeks on PDS or 3DPS, treated with 5-fluorouracil and gene expression profile was measured by qPCR. (A), (B) Principal component analysis of gene expression data presented as sample scores (A) and gene loading (B). (C) Bar-plot analysis of gene expression of 2D (Ci), 3DPS (Cii) and PDS (Ciii) cultured cells treated with 5-fluorouracil at increasing concentrations. The gene expression profile was measured by qPCR (n = 3) and 2D control was arbitrary set to a value of zero for each gene. Mean ± SEM is shown (n = 3); two-way ANOVA; Sidak's post hoc test for multiple comparison (2D); Tukey's post hoc test for multiple comparison (3DPS and PDS). * p-value < 0.05, ** p-value < 0.01, *** p-value < 0.001. CTR = untreated control. X = drug dosage.
Download figure:
Standard image High-resolution image
The response to DOX treatment was similar for some genes when comparing cells cultured in 2D, 3DPS and PDS, manifested as increased expression of EMT (SNAI1), pluripotency (POU5F1) and cell cycle inhibition (CDKN1A) markers and decreased expression of EMT (MUC1) and proliferation (MKI67, CCNA2) markers. Interestingly, MCF7 cells showed a 3DPS and PDS specific response by increased expression of the drug exporter (ABCG2).
In contrast to DOX treatment, PCA illustration of the qPCR data from 5-FU treated MCF7 cells clustered 3DPS and PDS cultured cells separate from 2D (figures 8(A) and (B)). A common cell response between the culture conditions was a decreased expression of EMT (MUC1) and proliferation (MKI67 and CCNA2) markers and an increased expression of the cell cycle inhibitor (CDKN1A) (figure 8(C)). Importantly and similar as for DOX treatment, 3DPS and PDS induced scaffold specific responses for some of the genes, here illustrated by unaffected (SNAI1) and decreased (VIM) expression of EMT markers. The drug treatments (DOX, 5-FU) were shown to affect cell viability in both 2D and 3D cultured cells as measured by lactose dehydrogenase (LDH) release (figure S15(A)). Here, 2D relative 3D cultured cells displayed a higher LDH release whilst increasing dosages of 5-FU and DOX had no additional effect on cell viability in 3D cultured cells. Consistent with data on LDH release, total RNA levels were reduced in both 2D and 3D cultured cells upon drug treatment (figure S15(B)), supporting previous studies on 3D mediated drug resistance cells [48, 51]. However, whilst increasing dosages of 5-FU did not change the total RNA levels in 3D cultured cells, increasing dosages of DOX decrease the total RNA levels.
4. Discussion
Today, there is a plethora of 3D culturing systems for studying specific tumor characteristics [13]. The organoid model seems to be able to reproduce genotypic and phenotypic tumor characteristics as well as drug response in several cancer types and is one of the most widely used assays [52, 53]. Although having promising results, organoids do not have a surrounding ECM that is central for tumor progression and development [9, 54]. In attempts to recreate the ECM component in model systems, several studies have used molded Matrigel consisting of a mixture of ECM proteins from mouse sarcoma [55]. Whilst Matrigel has the advantage of being printed to form scaffolds with an editable architecture through the addition of other hydrogel components [56, 57], it has batch-to-batch composition differences [55], making it unsuitable for a reproducible production of hydrogels with a defined ECM. In addition, cells respond to mechanical properties and dimensional features (roughness, microstructure, porosity and pore size) [58, 59] as well as chemical properties of the culturing material (functional groups, charge, valency and conformation) [60–62]. Thus, it is pivotal to use a consistent and in vivo relevant 3D culture system in reproducible and high-quality cancer studies.
In the present study, alginate was used as a base substance for 3D printing and presented a high molecular mass as well as equimolar G/M residues along the alginate backbone, indicating that alginate could produce stiff and stable hydrogels [43]. The alginate was further examined for the presence of metal ions that may induce cell-stress, reduce efficacy of chemical functionalization as well as change of alginate solution viscosity from pseudoplastic to time-dependent thixotropic behavior [44, 63, 64]. Although a thixotropic behavior may be beneficial during 3D printing, it may also lead to an uneven printing-flow and inconsistent deposition that may cause poor filament dimensional accuracy and uncontrolled scaffold porosity. Here, alginate was shown to have a low concentration of mono- and divalent cations (table S2) and to produce reproducible print-outs as illustrated by cross-testing (figure 1(B)). Due to the complexity of the cell-material interactions and the forces acting at the interface, three different methods (SAOS, compression measurements, and nanoindentation) were used to study the mechanical properties at different length scales (macro, micro and nano). The SAOS method indicated no differences in G' between 2.5% and 12.5% alginate, although a slight shift in G' was observed between 12.5% and 15% alginate (figure S2(A)), potentially explained by the onset of chain entanglement that impedes chain reorganization upon load. In situations where anisotropic materials may be expected, micro- and nano-analysis of the surface can be used to study Ec and Er. Here, alginate showed an increase in both Ec and Er at the surface, suggesting an anisotropic material (figures 1(A) and S2(B)), likely caused by an external cross-linking mechanism where alginate chains diffuse towards the interface during cross-linking [65]. Microanalysis of alginate of increasing concentration showed Ec of 0.1–1.5 MPa, supportive of a stiff and stable hydrogel. Of note, nano analysis produced fluctuating results at higher concentrations of alginate (8%–15%), suggesting local variances in Er or/and that the surface roughness of the cross-linked alginate together with the curvature of the printed filaments impeded correct alignment of the indent probe, resulting in high variability in obtained Er.
The ER/PGR+ MCF7 breast cancer cells, initially seeded and cultured on 3DPS using varying concentrations of alginate, showed increased expression of a pluripotency (POU5F1) marker (p = 0.051) in parallel with increased alginate concentrations (figure 2(B)) [66]. These data further support the overall trend of an induced EMT (TWIST, SNAI1) and pluripotency (SOX2) response in the reporter cells cultured in 3DPS models with higher alginate concentrations, which is consistent with previous work [67] and in line with the increased elastic modulus (figure 1(A)). When comparing the response of MCF7 cells cultured on 3DPS of 8% alginate or Matrigel as the base growth support, the expression of selected marker genes were similar between the two different hydrogels. Thus, alginate serves as a suitable material for 3D printing, allowing for high-throughput production of hydrogels with a defined porous structure, ECM composition and heterogeneity while affecting reporter cells similarly as hydrogels with a more complex and varying ECM composition as Matrigel.
Although alginate is biocompatible, it is also known for its non-adhesive and anionic properties [42]. Several studies have therefore covalently linked the pan-integrin binding motif RGD to support cell attachment and proliferation [68]. However, immortalized mammary epithelial cells [47, 69], as well as bone-marrow-derived mesenchymal stem cells [29], proliferate on alginate gels without the RGD motif. The ER/PGR+ MCF7 and triple negative MDA-MB-231 breast cancer cell line were therefore seeded on alginate 3PDS or PDS, lacking patient derived cells as well as genomic DNA [10], in order to study cell attachment. As demonstrated, MCF7 cells were initially after cell seeding attached to a lesser extent on 3DPS compared to PDS and gathered in clusters, supporting a low attachment (figure 4(B)). However, after two weeks in culture, MCF7 cells expanded with a distinct phenotype as tight and layered sheets of cells covering the material surface (figures 3 and S6), indicating a cellular adhesion adaptation. In contrast to MCF7 cells, MDA-MB-231 cells attached to a similar extent on 3DPS and PDS (figure S10(B)) and were scattered on the material surface upon cell seeding (data not shown). After five days in culture, MDA-MB-231 cells remained scattered with a rounded phenotype and were shown by SEM to have cellular protrusions connected to the material surface, supporting cell adhesion. Thus, while both MCF7 and MDA-MB-231 cells attached to the 3DPS, the ECM composition seemed more important for the initial cell adhesion of MCF7 cells compared to MDA-MB-231 cells, which is consistent with the low migratory and high migratory phenotype of MCF7 and MDA-MB-231 cells respectively [70] (figures 5(F) and S11(F)).
Although cells cultured on 3DPS and PDS have a similar phenotype, neither MCF7 nor MDA-MB-231 cells were able to infiltrate the 3DPS as observed in PDS (figure 3). In accordance, mammalian cells lack the enzyme alginase required for degrading alginate [42]. Striving for cell infiltration similar to PDS, alginate has been shown to be susceptible to cell mediated degradation by introducing covalently bound generic matrix metalloproteinases (MMPs) sensitive peptides using carbodiimide chemistry [71]. As several MMPs are expressed in a range of breast cancer cell lines [72], this might be a useful approach in future material development. Besides the morphological and attachment differences between MCF7 and MDA-MB-231 cells cultured on 3DPS and PDS, the proliferative state of the two cell lines also differed. Attaching MCF7 showed a similar proliferation rate on 3DPS and PDS, contrasting the MDA-MB-231 cells that had a higher percentage of cells in S-phase when cultured on PDS compared to 3DPS (figures 4(A) and S10(A)). In addition, the relative number of cells between 3DPS and PDS at the day of cell seeding and two weeks post seeding were similar for MCF7 cells (figures 4(B) and 5(B)) whereas MDA-MB-231 cells had a lower cell number on 3DPS after two weeks of growth compared to PDS cultures (figures S10(B) and S11(B)). Thus, the ECM seems to be more important for the proliferative ability of MDA-MB-231 cells compared to MCF7 cells, which is consistent with the low and high proliferative properties of MCF7 and MDA-MB-231 cells respectively.
The functional response of the reporter cell lines cultured on 3DPS was also shown to be dependent on material additives. The combination of alginate with hydroxyapatite (AH) increased Er and ongoing atomic force microscopy studies point at a locally increased stiffness around the HA particles (data not shown). When comparing the additives, AH and AHP, no significance difference in holoclone formation was observed to PDS, whereas the holoclone formation between PDS and 2D cultured cells showed a significant difference (figures 5(E) and S11(E)). Gene expression analysis confirmed a higher expression of a pluripotent related marker (SOX2) associated with CSC for both MCF7 and MDA-MB-231 cells cultured on AH and AHP. This data is consistent with HA rendering a more stiff material, which in turn increases the ratio of CSC. Interestingly, periostin was shown to reduce cell migration in MCF7 cells whilst having no effect in the relatively higher migratory cell line MDA-MB-231 cells. Consistent with the migratory functional assay, periostin downregulated the expression of EMT related genes (TWIST, MUC1) in MCF7 cells whilst no effect on EMT related genes was observed in MDA-MB-231 cells (figures 6(A) and S13). In contrast, others have shown a higher periostin expression in metastatic-relative primary tumor sites [73] and a correlation with invasive breast cancer cell lines [32], which in relation to data in this study may be explained by the dynamic levels of stromal periostin and periostin binding-integrin receptors [31, 74]. Nevertheless, the respond of the reporter cell lines, as measured by functional studies on CSC and migratory properties, to the microenvironment of 3DPS and PDS is more similar with HA and periostin additives.
To test the 3DPS model as a platform for drug screening, AHP, PDS, and 2D cultured MCF7 reporter cells were treated with DOX and 5-FU followed by identification of expression differences for the selected gene panel. 3DPS and PDS cultured cells relative to 2D cultured cells showed lower proliferative (MKI67, CCNA2) and EMT (VIM) responses upon drug treatment. 3DPS and PDS cultured cells further induced drug specific responses showed by an increased expression of a drug transporter (ABCG2) after DOX treatment and a reduced (VIM) or an unaffected expression (SNAI1) of EMT markers after 5-FU treatment, contrasting to 2D cultured cells. These results are consistent with a drug transporter-mediated resistance of DOX [75], different to the variety of 5-FU-mediated resistance mechanisms [76]. In addition, a drug specific response was also shown by the observation that DOX treatment of 3D cultured cells reduced total RNA levels in a dose-dependent manner, contrasting the 5-FU treatment, whilst not effecting viability for neither drug. This also suggests that the effect on gene expression upon increasing dosage of DOX and 5-FU is primarily due to cell adaptation.
Of particular interest to cell adaptation, VIM has previously been reported to be linked to clinical outcome when analyzing a cohort of breast cancer patients using the PDS technique [10], demonstrating the ability of the 3DPS model to detect possible clinically relevant drug effects not observed in a 2D culture model. The described 3DPS model consequently has the necessary features that are needed for a relevant and scalable tool in cancer drug discovery. Both the alginate composition as well the selection of additives to the 3DPS can now be further optimized to fully resemble human PDS using the identified key genes for the various treatments.
5. Conclusion
Extrusion-based 3D printing was used to produce 3DPS with chemically and mechanically defined alginate, using HA and periostin as functional additives. Human de-cellularized microenvironments in the form of PDS were used to provide a comparative blueprint of a relevant cellular response to the produced 3DPS. The functional and transcriptional responses of the reporter cells distinguished 3DPS and PDS from 2D cultured cells. The cell responses to a 3D environment were also tunable by the additives HA and periostin and the reporter cells cultured in 3DPS and PDS were shown to respond similarly to cytotoxic drug treatments. In conclusion, this study presents proof-of-concept data highlighting alginate-hydrogel based 3DPS as a relevant model system for drug discovery.
Acknowledgments
We thank Dr Di Wan (Department of Mechanical and Industrial Engineering, NTNU) for the nanoindentation measurements and Dr Patrik Stenlund (Section for Medical Device Technology, RISE) for 3D printing assistance. We also acknowledge VINNOVA (UDI-programmet) (2017-03737); the Swedish Cancer Society (20 0306 PjF, 2019-0317, 2016-438, 2016-486); the Swedish Research Council (2019-01273, 2017-01392, 2016-01530, 2015-03256); Knut and Alice Wallenberg Foundation, Wallenberg Centre for Molecular and Translational Medicine, University of Gothenburg, Gothenburg, Sweden; the Swedish state under the agreement between the Swedish government and the county councils (ALF-agreement) (716321, 721091); Västra Götalandsregionen (RUN 2018-00017), Swedish Foundation for Strategic Research (FID15-0008); Johan Jansson Foundation for Cancer Research; Wilhelm and Martina Lundgrens Foundation; Assar Gabrielssons Foundation and the foundation Sigurd och Elsa Goljes Minne for funding this project.
Data availability statement
The data that support the findings of this study are available upon reasonable request from the authors.