


Abstract
This paper reports on the observation of enhanced Ar impurity confinement in high density, turbulence reduced ion-root confinement (IRC) scenarios in Wendelstein 7-X (W7-X). Compared to the central electron-root confinement (CERC), Ar densities are substantially increased up to one order of magnitude and Ar flux profiles switch from slightly positive to pronounced negative fluxes all along the plasma radius in IRC. Estimations of the diffusive D and convective V transport parameter profiles using the STRAHL impurity transport code suggest a fundamentally different behavior in CERC and IRC with, compared to neoclassical values, high diffusive D and typical V profiles in CERC versus strongly reduced D and pronounced negative V profiles in IRC.
Export citation and abstract BibTeX RIS

Original content from this work may be used under the terms of the Creative Commons Attribution 4.0 licence. Any further distribution of this work must maintain attribution to the author(s) and the title of the work, journal citation and DOI.
1. Introduction
The transport of impurities in the magnetic confined fusion device W7-X of the stellarator type is expected to be fundamentally different as compared to tokamaks. Due to its three dimensional magnetic field structure, stellarator specific impurity transport effects like the built-up of a radial electric field [1–3], variations of the electrostatic potential [4–6], or specific characteristics in the mixed collisionality regime [7–10] are theoretically expected. Some of these effects are expected to lead to increased confinement of impurities which can potentially cause a degradation of plasma performance or undesired radiative collapses of the plasma [11, 12]. Therefore, starting from the beginning of W7-X operations, the monitoring of impurity concentrations has been routinely performed using various complementary diagnostics [13–18]. Although predicted by neoclassical theory for specific plasma conditions, no impurity accumulation in medium density plasmas in the core electron root confinement (CERC) regime [19] has been observed in W7-X: short impurity confinement times, on the order of the energy confinement time, and a lack of impurity accumulation has been observed over a wide range of different impurity species and plasma conditions including long pulse operation of up to 120 s [20, 21]. As currently discussed, the reason for this absence of impurity accumulation can be attributed to a combination of a strong anomalous transport contribution [20, 22], most likely caused by microturbulence [10, 20, 23–25], and the presence of a positive neoclassical radial electric field (electron root) in a large portion of the plasma radius. However, with increasing density and, consequently, better collisional coupling between species, the thermalization among ions and electrons yields the plasma to be in ion root conditions (IRC) across the plasma core [26]. In the particular case of the injection of cryogenic hydrogen pellets, one additionally observes a significantly increased energy confinement and reduced anomalous transport in the IRC [27–29]. As in past experiments, energy confinement and impurity confinement have shown to be strongly coupled [21, 30], one would also expect an enhanced impurity confinement in IRC plasmas compared to CERC plasma scenarios.
In this work, a direct comparison of experimentally obtained Ar impurity transport is shown for a dedicated experiment program with a CERC to IRC and back to CERC transition [26], including pellet injections in the IRC phase. Making use of x-ray imaging spectrometer data, the temporal evolution of Ar15+, Ar16+, and Ar17+ density profiles are inferred using Bayesian analysis [14, 31] and from those, the Ar16+ flux  is derived using a previously developed neighboring charge state method [32].
After an introduction of the experimental method in section 2, the temporal evolution of experimentally observed Ar density and flux profiles is shown in section 3 comparing CERC and IRC scenarios. Finally, section 4 compares STRAHL simulated Ar density profiles to experimental ones for given D and V profiles, assuming reduced diffusion and negative, inwards directed convection of impurities in the IRC scenario.
2. Experimental method
For the characterization of Ar impurity transport at W7-X, the dynamic evolution of Ar densities and Ar fluxes has been evaluated during two different confinement scenarios CERC and IRC, both of which are seen within one experiment program.
In this study, Ar is used as a trace impurity for diagnostic purposes using the x-ray imaging crystal spectrometer (XICS) installed at W7-X [33]. As a noble gas, Ar is seen to have a high recycling coefficient close to one and, given constant plasma conditions, will maintain a constant density over several seconds after initial injection. This behavior of Ar is beneficial for the analysis performed here, as the impurity transport can be studied over an extended time interval without the need of refilling impurities, as in the case of non-recycling species like Ca, Al, Fe or others [15, 20, 34–36]. In the experiment programs discussed below, a single gas puff 100 ms after the start of ECR heating induced a small, non perturbing amount of Ar with nAr/ne ≈ 2 × 10⁻⁵.
For spatial resolution along the radial coordinate up to the last closed flux surface, Ar impurity flux profiles ΓAr(ρ) are determined from Ar density profiles nAr(ρ) measured by XICS. With its viewing geometry covering a large cross section of the plasma from the center toward the plasma edge, line integrated, radially resolved spectra of highly charged Ar are observed, yielding (beside ion and electron temperature profiles Ti(ρ) and Te(ρ) and radial electric field profiles Er(ρ) [26]) also  ,
,  , and
, and  density profiles from a spectral fit and tomographic inversion of the XICS data [21]. Note that XICS is currently not absolutely calibrated and there is an unknown calibration factor to the Ar density, yielding however correct Ar density profile shapes as well as a precise relative scaling between
  ,
,  , and
, and  profiles. Throughout this paper,
  is defined as the square root of the poloidal magnetic flux ψ, normalized by the magnetic flux of the last closed flux surface ψL and
  is the effective radius with the minor plasma radius a = 0.51 m for the standard W7-X magnetic configuration considered here. From the three neighboring Ar charge state profiles, the
  flux profile can be derived by integration of the continuum equation

over the effective radius r = aρ

with sinks and sources S of Ar16+ determined by recombination R and ionization I rate coefficients of Ar15+, Ar16+, and Ar17+

taken from the ADAS database [37]. Charge exchange recombination being important especially at the plasma edge was not included in the analysis. A detailed description of the method can be found in reference [32].
3. Measured Ar density and Ar flux profiles in CERC and IRC
In figures 1(a)–(c), time traces of the line of sight integrated electron density ne derived from the interferometer diagnostic [38], the electron cyclotron resonance heating power PECRH, and the temporal evolution of Ar density  , and Ar flux
  profiles are shown for the experiment program 201 712 07.006. Within this program, a CERC to IRC and back to CERC transition takes place that is driven by the injection of cryogenic hydrogen pellets [26], with improved energy confinement and reduced turbulence levels in the post-pellet IRC phase observed for this particular program [27], induced by a central density peaking as a consequence of the injection of cryogenic hydrogen pellets [39]. In the CERC phase (figure 2(i)), the radial electric field Er is positive in the core plasma (Er(ρ < 0.5) = 15 kV m−1) and negative in the edge plasma (Er(ρ > 0.5) = −10 kV m−1), while in the post-pellet IRC (figure 2(k)), Er is negative along the entire plasma radius with minimum values of Er ≈ −20 kV m−1 [26].
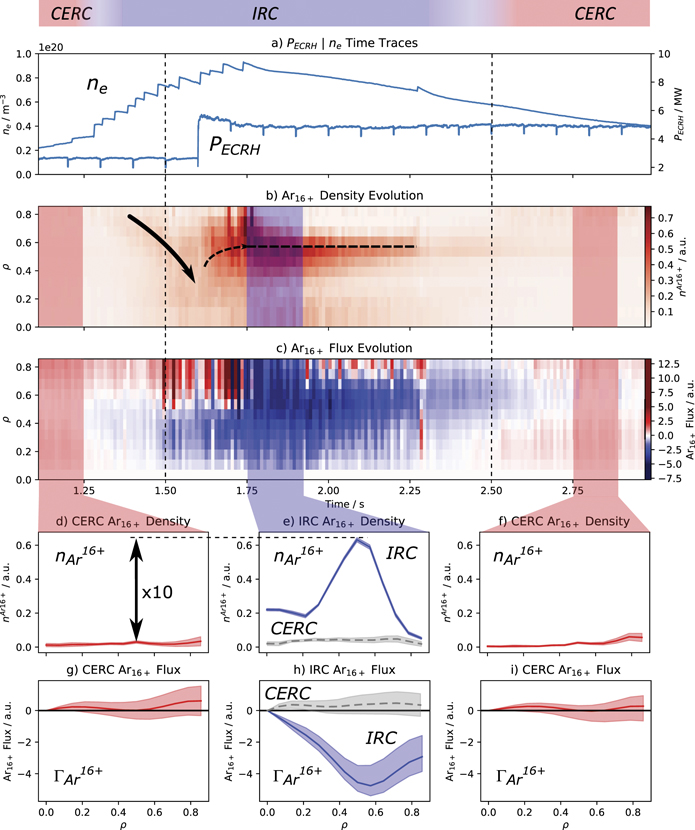
Figure 1. (a) Time traces of line integrated electron density and ECRH heating power. (b) Temporal evolution of Ar density profiles. (c) Temporal evolution of Ar flux profiles. (d)–(f) Ar density profiles for CERC (red) and IRC (blue) scenarios. (g)–(i) Ar flux profiles for CERC (red) and IRC (blue) scenarios.
Download figure:
Standard image High-resolution image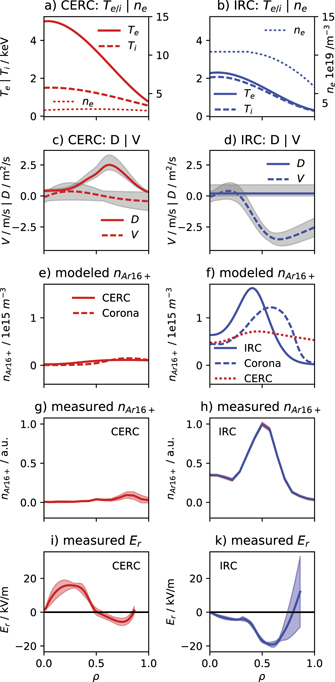
Figure 2. STRAHL modeled (e) and (f) versus experimentally obtained (g) and (h) impurity density profiles of Ar16+ for experimental temperature and density profiles (a) and (b) and assumed diffusive D and convective V transport parameter profiles for (c) high anomalous, CERC-like transport (left column) and (d) reduced IRC-like transport (right column) of impurities. The kinetic profiles shown in (a) and (b) are taken at times t = 1.25 s and t = 1.85 s for the CERC and IRC phases, respectively.
Download figure:
Standard image High-resolution image
In the time interval t = 1.5–2.5 s (see dashed vertical lines in figure 1), a pure IRC, that is a negative radial electric field along the entire plasma radius, is present. For t < 1.25 s and t > 2.75 s, the plasma is under CERC conditions and in between, there are two transition phases when the CERC Erslowly develops toward the IRC Er for t = 1.25–1.5 s and back from IRC to CERC Er for t = 1.5–2.75 s.
The above discussed dynamic evolution of Er and change of the turbulent transport do have a significant impact on the Ar density and fluxes, as shown in figures 1(b) and (c): in both CERC phases, marked by the red shaded areas, the observed  profiles are rather flat and the
  profiles are close to zero or slightly positive, see also figures 1(d), (g) and (f), (i). In contrast, the IRC phase (blue shaded areas) shows highly peaked
  profiles at ρ = 0.5 with steep density gradients, both positive and negative, and absolute densities increased by a factor of 10 compared to the CERC scenario, see solid line in figure 1(e). Also the Ar flux profile changes from slightly positive to significant negative fluxes in the IRC with a maximum negative flux at ρ = 0.5, see solid line in figure 1(h). Apparently, the Ar flux profiles are strongly coupled to the evolution of the radial electric field and changes in the turbulent transport properties: in pure IRC with negative Er, Ar fluxes are also significantly negative while in CERC, the Ar fluxes are close to zero or slightly positive. Moreover, in the Er transition phases mentioned above, also the Ar fluxes steadily develop from the CERC to the IRC fluxes, very similar to the Er profile evolutions [26].
The here observed  profile evolution can be understood in terms of the
  fluxes: with the onset of the IRC and the development of negative Ar fluxes close to the plasma center at ρ = 0.2 for t = 1.25–1.6 s (figure 1(c)), the Ar density starts to rise and is attracted toward the plasma center as indicated by the solid arrow in figure 1(b). With the onset of the 5 MW heating power, the radial position of the Ar flux minimum is shifted radially outwards to ρ = 0.6, accompanied by a change of the peaking position of the
  profile also toward ρ = 0.6, see dashed horizontal line in figure 1(b) and an overall increase of the Ar16+ density and flux. With the gradually decreasing negative Ar flux for t = 1.8–2.5 s, also the Ar density decreases until the Ar flux is close to zero for t > 2.6 s and also the Ar densities become broad as before the onset of the IRC.
As the Ar16+ density profile is also determined by the Te profile, and the central Te drops from 5 keV to 2 keV during the CERC to IRC transition (see also figures 2(a) and (b)), it is not obvious to what extend the observed Ar16+ density peaking in IRC may also be caused by the Te reduction. To explore this, the Ar16+ density and flux profiles of the experiment program 201 808 09.027 with a low central Te value of 2 keV but in CERC conditions have been evaluated and shown in dashed lines in figures 1(e) and (h) for a direct comparison to the post-pellet IRC case. As can be seen, the Te = 2 keV CERC Ar density and flux (dashed lines in figures 1(e) and (h)) differ strongly from the Te = 2 keV IRC scenario, but are nearly identical to the Te = 5 keV CERC Ar density and flux profiles in figures 1(d), (g) and (f), (i), showing the Te effect on the Ar profiles and fluxes being negligible compared to the effect of changing the confinement scenario from CERC to IRC.
The existence of two different confinement scenarios is further supported by the fact that impurity and energy confinement are increased, despite the heating power was stepped up from 3 to 5 MW. Following a simple scaling law however, one would expect a reduced confinement with increased heating power for both, energy [40] and impurity confinement [21].
4. Modeled Ar density and transport parameter profiles in CERC and IRC
For a better understanding of the observed changes in the transport properties of CERC and post-pellet IRC confinement scenarios, initial estimations of D and V profiles have been carried out using the impurity transport calculation code STRAHL [41] in order to achieve a reasonable match of measured and modeled  density profiles. STRAHL solves the continuum equation radially in one dimension for all charge states of selected impurities, providing the time dependent evolution of 1D impurity emission profiles with the additional option to include impurity transport using a linear ansatz of diffusive D and convective velocity V impurity transport parameter profiles [41]. While the diffusivity profile is only positive, V can adopt positive as well as negative values, corresponding to outwards (positive V) and inwards directed (negative V) impurity pinch velocities. To perform the simulations, Te, Ti, and ne profiles have been used as input parameters for STRAHL and set similar to experimental profiles in the CERC and IRC phase of program 201 712 07.006 (figures 2(a) and (b)). For the CERC scenario, typical D and V profiles [32] have been used for the STRAHL calculations (figure 2(c)). In particular, a high anomalous, non-neoclassical diffusivity up to D = 2.5 m2 s−1 and a neoclassical convection velocity profile has been used according to experimental findings of anomalous impurity transport in CERC plasmas of W7-X [20, 22, 32]. For the post-pellet IRC scenario, reduced anomalous transport has been observed [27, 39] and hence a reduced diffusivity is expected so that here, D has been assumed to be constant with D = 0.2 m2 s−1 (figure 2(d)). As the pronounced negative Er in the IRC is expected to attract the highly charged Ar16+ impurities (also reflected in the above observed negative Ar16+ fluxes), the convection velocity profile has been assumed accordingly with a negative value of up to V = −4.0 m s−1 (figure 2(d)). The resulting modeled
  profiles shown in figures 2(e) and (f) in solid lines do match the experimentally observed ones (figures 2(g) and (h)) reasonably well, both with respect to the profile shapes and also the ratio of 1/10 in the peak impurity densities comparing CERC and IRC.
To further investigate the impact of the transport parameters on the actual  profile shapes, these simulations are also compared to a simple case in which transport is neglected (v = D = 0) and the Ar density profiles are calculated by assuming a coronal equilibrium, as shown in dashed lines in figures 2(e) and (f). As for CERC, the Ar profile is rather flat already in the Corona case, the addition of a strong D does not change the profile considerably. The situation is different in the IRC case: due to the reduced Te profile, the Corona
  profile is enhanced and slightly peaked around ρ = 0.6, however still too broad and shifted outwards with respect to the experimental
  profile. Here, the assumption of the negative V profile is essential for reproducing the highly peaked experimental
  profile. Finally, assuming CERC transport properties with the D and V profiles of figure 2(c) but kinetic IRC profiles of figure 2(b) yields as expected a broad
  profile shape (dotted line in figure 2(f)) that does not match the experimentally observed IRC
  profile at all, but agrees well with the experimental CERC
  profile shown in figure 1(e), dashed line.
Compared to neoclassical expectations, the experimental D and V values in the post-pellet IRC phase are indeed reduced, but still not neoclassical. Actually, the neoclassical expected transport parameters for the IRC phase are further reduced by a factor of 10 to 5 with DNC = 0.013 m2 s−1 and VNC = −0.75 m s−1 and the corresponding modeled  density profile does not match the experimental one at all (not shown).
The in figures 2(c) and (d) shown D and V profile errors have been derived from an individual variation of D and V profiles, validating its effect on the modeled  profiles. Note also, that the experimental
  profiles exhibit significant uncertainties, dominating the
  error in figure 1(h). Improving the
  profile reconstruction is currently under investigation by e.g. making use of the 2nd XICS channel [14], monitoring Ar17+ directly. In addition, the individual impact of the different contributions of negative Er, reduced turbulence, and high density ne and its profile shape to the impurity confinement cannot be disentangled from each other for the present experiment program. Here, additional experiments are required.
5. Summary and conclusions
The in this work shown experimental results of observed enhanced impurity confinement in W7-X IRC plasma scenarios, yielding one order of magnitude enhanced Ar impurity densities, peaked Ar profile shapes around the plasma mid radius and pronounced negative, inwards directed Ar fluxes, have been compared against impurity transport simulations. The experimental  profile shapes could be matched by the simulations both in CERC and IRC scenarios. For the CERC phase a good match is found using D and V impurity transport profiles typical of W7-X medium density plasmas, for the post-pellet IRC phase a match can be found by assuming reduced anomalous transport (D = 0.2 m2 s−1) and an inward directed convection of impurities (V = −4 m s−1). The findings for the impurity transport correlates with the improved energy confinement and reduced turbulence observed in pellet fueled IRC scenarios [27, 39].
The enhanced confinement of impurities in post-pellet IRC and in particular, the negative impurity fluxes attracting impurities into the bulk plasma, suggests that impurity accumulation may become an issue if steady-state turbulence reduced IRC scenarios become accessible on W7-X (for example with advanced density profile control). Here, future experiments are needed to verify the long term behavior of impurity transport in high-performance pellet fueled W7-X plasmas and to explore possibilities of impurity control.
Acknowledgments
This work has been carried out within the framework of the EUROfusion Consortium and has received funding from the Euratom research and training programme 2014–2018 and 2019–2020 under Grant Agreement No. 633053. The views and opinions expressed herein do not necessarily reflect those of the European Commission.