
Abstract
Objective. Lower-limb amputees suffer from a variety of health problems, including higher metabolic consumption and low mobility. These conditions are linked to the lack of a natural sensory feedback (SF) from their prosthetic device, which forces them to adopt compensatory walking strategies that increase fatigue. Recently, both invasive (i.e. requiring a surgery) and non-invasive approaches have been able to provide artificial sensations via neurostimulation, inducing multiple functional and cognitive benefits. Implants helped to improve patient mobility and significantly reduce their metabolic consumption. A wearable, non-invasive alterative that provides similar useful health benefits, would eliminate the surgery related risks and costs thereby increasing the accessibility and the spreading of such neurotechnologies. Approach. Here, we present a non-invasive SF system exploiting an optimally-calibrated (just noticeable difference-based) electro-cutaneous stimulation to encode intensity-modulated foot-ground and knee angle information personalized to the user's just noticeable perceptual threshold. This device was holistically evaluated in three transfemoral amputees by examination of metabolic consumption while walking outdoors, walking over different inclinations on a treadmill indoors, and balance maintenance in reaction to unexpected perturbation on a treadmill indoors. We then collected spatio-temporal parameters (i.e. gait dynamic and kinematics), and self-reported prosthesis confidence while the patients were walking with and without the SF. Main results. This non-invasive SF system, encoding different distinctly perceived levels of tactile and knee flexion information, successfully enabled subjects to decrease metabolic consumption while walking and increase prosthesis confidence. Remarkably, more physiological walking strategies and increased stability in response to external perturbations were observed while walking with the SF. Significance. The health benefits observed with the use of this non-invasive device, previously only observed exploiting invasive technologies, takes an important step towards the development of a practical, non-invasive alternative to restoring SF in leg amputees.
Export citation and abstract BibTeX RIS

Original content from this work may be used under the terms of the Creative Commons Attribution 4.0 license. Any further distribution of this work must maintain attribution to the author(s) and the title of the work, journal citation and DOI.
1. Introduction
Lower-limb amputees suffer from a variety of motor and health deficits such as low balance, asymmetric gait and risk of falling [1]. The asymmetry in gait can be further linked to osteoarthritis in the intact limb and osteoporosis in the residual limb [2]. Notably transfemoral amputees also experience higher metabolic consumption when walking [3] and related higher cardiovascular morbidity [4–6] than healthy subjects. In addition to these physical effects, their reduced confidence affects their mobility and in turn their ability to participate in social activities [7].
Recent research implementing invasive solutions (implantable devices requiring a surgery) has demonstrated important functional benefits including a reduction of metabolic consumption that can be linked to improved gait symmetry [8] and increased confidence [9]. A reduction in risk of falls was also demonstrated through an increase in dynamic stability while walking over obstacles [10]. In addition to these functional benefits, these solutions provided a reduction in phantom-limb pain [10] contributing to a significant improvement in the health and quality of life of leg amputees. In these studies, neural interfaces [11–13] were implanted in the residual nerves at the thigh level of transfemoral (above the knee) amputees, allowing for the real time restoration of force and knee angle information as tactile and phantom calf muscle contraction respectively from the prosthetic leg.
Despite important benefits, invasive technology presents some drawbacks, such as a costly, and time-consuming training of a specialized surgeon to perform the precise electrode implantation surgery. This in addition to the surgery related risks, highlight the importance of the development of a functionally beneficial non-invasive alternative. The assessment methods used to evaluate the functional and health-related benefits of invasive solutions can be replicated when evaluating non-invasive sensory feedback (SF) systems. On the other hand, the non-invasive electrical stimulation policy implemented should be radically different since it must stimulate through multiple layers of skin and subcutaneous fat, a challenge that does not need to be considered with direct nerve stimulation.
Previous studies using non-invasive SF systems [14–17] have also shown interesting preliminary results, but have yet to demonstrate similar health benefits as the invasive studies.
In transtibial amputees, non-invasive solutions have shown limited functional improvements with remapped feedback. Previous systems have provided electrocutaneous feedback mapped to the skin on the thigh [15] and lower back [16] as well as vibrotactile feedback around the thigh [17, 18]. In most cases, ON–OFF stimulation with a fixed intensity was used to encode foot-ground information such as gait events [15], centre of pressure location [16], and foot sole force location [18]. Rusaw et al provided proportional feedback through vibration intensity that increased with higher foot-ground pressure in different locations on the foot sole [17]. These SF systems and encoding strategies were tested in level ground walking [15], quiet standing [16, 17], and walking down stairs [18]. They demonstrated improved postural control while walking [15] and standing [17] as well as the limitations of these types of systems through the over compensation of the healthy leg in these scenarios [16]. Limitations that come in these scenarios as well as improved foot placement walking down stairs. Improved foot placement while walking down stairs also suggests augmented proprioceptive awareness with non-invasive feedback that could potentially be linked to increased confidence [18]. The constrained testing scenarios of these studies are their main limitation as they report more mechanism-like findings rather than high level results such as reduced metabolic consumption or reduced cognitive load that can be better linked to daily life function [19]. The lack of natural sensation and imprecise calibration are other drawbacks of non-invasive systems when compared with invasive options that elicit a variety of natural sensations and precise calibration through direct nerve stimulation [10].
Somatotopic (not remapped) sensations have also been evoked in transtibial amputees, using a high-density electrode grid placed behind the knee [20]. Unfortunately, this was achieved in a non-functional scenario, since the patients were laying prone and unmoving. It is therefore very unlikely that this could be achieved while walking, due to the relative displacement of electrodes with respect to the target nerves.
Importantly, compared to transtibial amputees, transfemoral amputees have higher rates of energy consumption [9], disability [21, 22], mortality rate [23–25], as well as decreased balance [26] and gait symmetry [27] since they are required to move a larger prosthesis while missing a larger portion of their body. These reasons are all making sensory restoration even more important for this population.
In transfemoral amputees, somatotopic sensations have not been elicited non-invasively since nerves are difficult to target due to them being far from the surface of the skin, but non-somatotopic (remapped) SF has been implemented exploiting a similar encoding as in transtibial amputees. In a variety of cases, gait symmetry has been shown to increase in transfemoral amputees despite minimal encoding schemes using either unilateral [14, 28], or bilateral [29] vibrotactile feedback. Despite promising gait symmetry results, wider functional benefits have not yet been demonstrated.
Some of these functional benefits, such as reduced energy consumption while walking, have recently been of interest in the world of amputee rehabilitation. In a recent study on transfemoral amputees by Ishmael et al [30], metabolic consumption was found to significantly decrease by 15.6 ± 2.9% with the use of a powered hip exoskeleton in combination with a leg prosthesis.
The non-invasive interventions presented above provided real-time, spatially matched sensation feedback. However, none implemented pressure level encoding on the insole of the prosthetic foot making them less intuitive than the invasive solutions [31]. Despite the great potential for non-invasive approaches, a fully portable, intuitive SF system for transfemoral amputees has yet to demonstrate a useful set of functional benefits that would positively impact the functionality and health of the users. Indeed, a successful wearable, non-invasive system, able to improve metabolic consumption would be an important asset for improving the health of transfemoral amputees [9, 30]. Also, through augmented stability and confidence, it would take steps towards easily adoptable prosthesis that feel like real limbs, increasing satisfaction and reducing abandonment, furthering health benefits.
In this study, we present a wearable SF system that maps the foot pressure and knee joint angle to electro-cutaneous stimulation over the stump of the subject (figure 1(A)). It consists of a peripherally placed pressure sensitive insole and inertial measurement unit (IMU) sensor readouts (accelerometer and gyroscope) for knee angle readout as well as a microcontroller and electro-cutaneous stimulator [28]. The use of electrical stimulation, instead of mechanical [32] or vibratory [14], allows for precise modulation of the stimulation parameters and reduced delays. The multidimensionality of electrical stimulation allows for a more precise understanding of the sensory perceptual thresholds of the user, due to the many variables involved in the stimulation (i.e. frequency, amplitude, pulse-width, temporal pattern). This allows for more control over the type and intensity of sensations elicited [33, 34], compared to other non-invasive solutions.
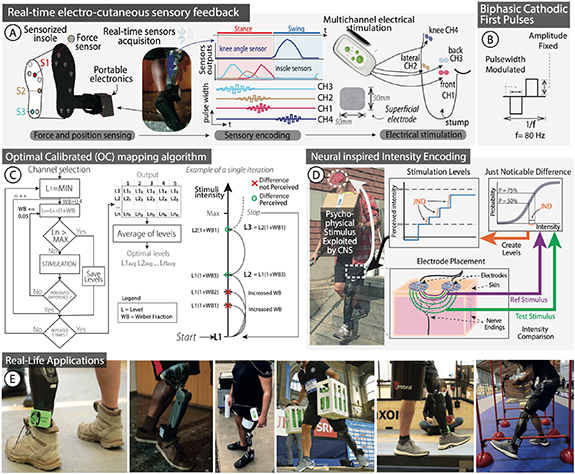
Figure 1. Optimally-calibrated non-invasive SF system. (A) An electrical cutaneous feedback system takes real-time force information from a sensorized insole and IMU data from the ankle, converts it to stimulation parameters modulated in pulse-width and stimulates the stump through pairs of electrodes. (B) Stimulation was given as trains of biphasic, cathodic first pulses at 80 Hz and modulated in pulse-width to modulate perceived intensity. (C) The WF was used to find each discretely perceived intensity level as part of the OC algorithm which then confirmed how many discrete levels each subject could perceive. (D) Surface electrodes stimulate nerve endings below the skin. These nerve endings perceive changes in intensity through different amounts of injected charge. The optimal differences in charge were found by determining the JND for each subject. The JND used was chosen at the difference resulting in 75% correct identification of stimulus intensity difference and was used to find each subject's WF. (E) Real-life applications of the feedback system from left to right, top to bottom are: indoor walking, stairs walking, outdoor walking, carrying weight while walking over an uneven surface, walking on a balance beam, and walking over and under obstacles.
Download figure:
Standard image High-resolution imageWith the aim of better understanding the functional effectiveness of non-invasive sensory restoration approaches, a series of experiments were conducted with three transfemoral amputees. Sensation characterization was performed to assess the location and quality of the sensation felt by the subjects. Functional tests analysed walking over level ground, confidence and metabolic consumption. The non-invasive SF system was successfully implemented and exploited both in- and out-side of the laboratory by all the subjects (figure 1(E)).
This study explores how a non-invasive system, providing personally-calibrated and intuitive sensory information in real-time, improves amputees' walking, metabolic consumption and prosthesis' confidence in ecological conditions [35].
2. Methods
A non-invasive system providing touch and knee joint angle feedback was developed and tested in three transfemoral amputees (Subject 1, 2, 3). To fully assess this technology impact, the subjects were asked to perform functional and health related tasks. Prior to functional testing, sensation characterization was performed to determine the location of the perceived stimulation and the appropriate current and pulse-width values for different intensity levels. During this phase, subjects were also asked to describe the type of sensation perceived during the stimulation.
2.1. Participants
Three subjects with unilateral lower-limb amputation at the transfemoral level participated in this study (table 1). All amputees were male and were respectively 54, 31 and 34 years old. Subject 1 and Subject 2 had undergone a traumatic amputation, and Subject 3 was amputated because of cancer. The experiments were approved by the ETH Zurich's ethics commission (EK 2019-N-97). The trial was registered with ClinicalTrial.gov (NCT04217005). All the subjects read and signed the informed consent.
Table 1. Patients' demographics.
| Sex | Age | Amputation level and side | Amputation cause | Year of amputation | K-level | Prosthesis | Frequency of use | Phantom limb pain | |
|---|---|---|---|---|---|---|---|---|---|
| Subj 1 | M | 54 | Distal two-thirds of the left leg (transfemoral) | Trauma | 2013 | 4 | Ottobock GENIUM X3 and Ottobock VARI-FLEX LP | Daily | No |
| Subj 2 | M | 31 | Distal two-thirds of the left leg (transfemoral) | Trauma | 2018 | 4 | Ottobock R and Össur PRO_FLEX XC foot | Daily | No |
| Subj 3 | M | 34 | Gritty–Stokes of the right leg (transfemoral) | Cancer | 2015 | 4 | Össur RHEO KNEE | Daily | Low |
2.2. Electro-cutaneous SF system
A remapped, non-invasive SF system using electro-cutaneous stimulation was developed and implemented using surface skin electrodes. Four pairs of electrodes (circular, 2.5 cm in diameter) were placed on the subject's stump in pre-defined locations (figure 1(A)). One pair of electrodes (CH1) conveyed information about the knee angle and was placed close to the iliac crest on the same side as the amputation. Three pairs (CH2, CH3 and CH4) were dedicated to providing pressure information, acquired through a sensorized insole where pressure readings from the central metatarsal, medial part, and heel of the insole were mapped to the anterior, lateral, and posterior sides of the stump respectively (figure 1(A)). All pairs of electrodes were placed as distally as possible in this same intuitive configuration for all subjects.
Overall, the system was composed of three key components: the sensorized insole (Sensars Neuroprosthetics sarl) with its associated system-controller (Odroid C2) and the electrical nerve stimulator (RehaMove3, Hasomed GmBh, Germany). A more exhaustive description of the system can be found in the work by Basla et al [28]. The pressure exerted by the subject was captured by sensors placed in ad-hoc produced insoles, and sampled at 50 Hz by a dedicated electronic circuit handled by a microcontroller (STM32). The electronic circuit was fully enclosed in a box attached to the prosthetic ankle of the subject. The force data were then sent via Bluetooth to the system-controller, which in turn employed a sensory encoding algorithm that drove the electrical stimulation. The knee angle information was obtained using an IMU embedded in the same electronic circuit as the force circuit at the prosthetic ankle of the subject. The IMU data were used to obtain an approximate estimation of the knee angle using a complimentary filter [36].
2.3. Electro-cutaneous stimulation and pressure sensors calibration
The electro-cutaneous stimulation was delivered as a train of balanced, cathodic-first pulses of current. The frequency of the trains was maintained at 80 Hz, and the current was fixed at a specific level determined by the calibration process per-channel per-session.
To find this fixed current value, the current was increased in increments on the order of 1 mA while the pulse-width was kept constant. The subjects were asked to report when they felt a sensation with an intensity of 5/10 where 0 indicated no sensation and 10 indicated the maximum strength sensation they could tolerate. This number system reporting scale for sensation intensity is the same used by Basla et al [28] in their wearable sensory leg neuroprosthesis. The variation of force exerted was encoded as an increase of pulse-width to increase the charge injected through each electro-cutaneous pulse. The size of each increment was determined through the finding of a just noticeable difference (JND) identified during the advanced optimal calibration (OC) process. This ensured a perceivable increase in stimulation intensity that corresponded to an increase in force and was personalized to each participant.
The stimulations were meant to be comfortable and localized to just under the electrode pairs, activating only skin mechanoreceptors as opposed to somatotopic nerves as in invasive interventions [9, 10]. Each subject was also asked to draw the location and size of the sensation as well as describe how it felt by picking from a list of descriptors [37] ('pressure', 'twitch/muscle contraction', 'tingling', 'touch', 'warm', 'cold', 'pain', 'electricity', 'pulsation', 'vibration'). These sensation locations and types in the three subjects are reported in figure S1.
A force threshold greater than sensor noise was selected and the maximum force exerted by the user was found by averaging the force maximums of ten steps recorded by sensorized insoles, while walking on level ground at a self-selected speed. These force threshold and maximum were mapped to the threshold and maximum charges found in the OC step (section 2.4). The variation of force exerted was encoded as an increase of pulse-width to increase the charge injected through each electro-cutaneous pulse.
2.4. Optimal calibration (OC) mapping algorithm
In order to provide an electrical stimulation that correctly maps an increase of exerted force to an increase in perception, an advanced OC algorithm was developed and applied in each subject (figures 1(C) and (D)). The OC works with the principles of the JND and Weber fractions (WFs). The JND is the minimum increase that results in a noticeable change by the subject (with 75% of correct identifications). The WF is defined as the relative increase between the lower stimulus and the higher stimulus. Therefore, to correctly pass from one level of perception to the next one, the increase in electrical stimulation must be equal to or higher than the JND at that level of perception [38]. The WF was not found to be constant over the whole range of perceived intensities for each subject within a stimulation channel. This means that at a lower value of perceived intensities, a lower WF could be enough, while at higher intensities, a higher fraction may be needed to obtain a noticeable difference. The OC algorithm was developed and applied to each electrode pair in order to determine the stimulation levels unique to each subject.
2.4.1. Comfortable range
The first step of the calibration was used to obtain the range of comfortable electrical stimulation. A linear increase in the intensity of stimulation was performed, asking the subject to report when they were starting to perceive something clear (perceptual threshold) at an intensity of 2/10. The subject was then asked to report whenever the intensity began to become stronger (remaining below an uncomfortable level) at an intensity of 8/10. The train of stimuli lasted 2 s and had a pause of 1 s in between. This procedure was repeated five times, through which, an average minimum and maximum value were calculated.
2.4.2. Multiple Weber fraction (WF) estimation
The minimum value was used as the first level in WF estimation. Starting from this value, the set of levels required to encode different force intensities and flexion levels was found. For each level, the subject was stimulated with two stimuli; one being the lower level (we refer to it as the 'reference') and the other being a possible higher level incremented by one fraction; the WF determined by the JND [39] (e.g. 40% of the lower level) (we refer to it as the 'test'). The two stimuli were presented in a randomized order, and the subject was asked to report which of the two he felt as more intense, or if they were equal. In case the subject provided a wrong answer, the pair of stimuli was repeated with the same reference and the test increased by a fixed 0.05 (e.g. test is now 45% of the reference). Once the subject answered correctly, the correctly perceived test became the new reference and it was compared to a new test that in incremented by one fraction (e.g. new test is the 40% of the new reference) (figure 1(C)). The process was concluded when a test or a reference that would have been higher than the previously determined maximum was reached. Each stimulus lasted 2 s with a 1 s pause between the two compared stimuli. This process of finding the levels from the minimum threshold charge to the maximum was repeated five times, obtaining a list of correctly identified intensity levels, each incremented from the level below it by its JND. The discriminable levels found through this process were used as the final optimal set of levels shown in figure S2(A).
2.4.3. Discrimination task
A further validation of these levels was performed with the following algorithm. Each pair of contiguous levels was provided as trains of stimuli lasting 2 s each, with 1 s of pause between the two. The stimuli were provided in a randomized order, after which the subject was asked to report which of the two was felt higher. This process was repeated ten times for each pair, and the performance of correct answers was compared to the percentage of correct identification that defines the JND (75%). A result equal or higher to 75% correct identification was considered a successful validation. These results can be found in figure S2(B) and table S1.
2.4.4. Just noticeable difference (JND) calculation
The JND was more precisely examined through the generation of a psychometric curve (figure 1(D) JND panel). This was done by taking the minimum and maximum pulse-width and generating ten intensity steps between them. The midpoint between these steps was the reference value that could be compared to 11 different test stimuli; five higher, five lower and one the same. Random pairs of stimuli made up of the reference value and one of the test stimuli were presented to the subject in pulse trains lasting 2 s with a 1 s pause between them. The subject was then asked to judge which stimulus was perceived to be stronger. Each pair of stimuli was repeated ten times. A psychometric curve was fit to the results and represents the probability of judging the test stimulus as stronger than the [40]. JND was then extracted from this curve as the difference between 50% and 75% probability and was used choose the levels of stimulation tested in the multiple WF estimation task.
2.5. Metabolic consumption test
Participants walked at a self-paced velocity over a flat grass surface between two designated points continuously (with a distance between the points of 23.5 m) for 6 min per session. The subjects' oxygen consumption during walking was measured with a wearable metabolic system, the Cosmed K5 (COSMED, Rome Italy) (figure 2). A 2 min baseline measurement was taken before each condition.
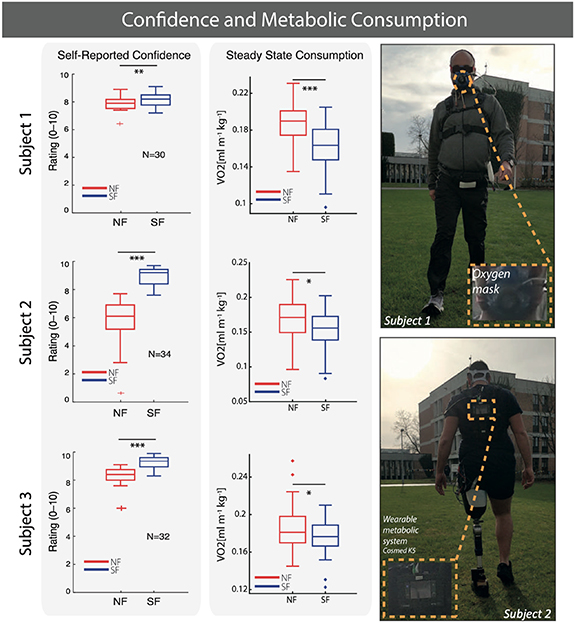
Figure 2. Confidence and metabolic consumption improve with SF. Self-reported confidence over all SF tests is reported and for all subjects (left panel). Net VO2 consumption while walking outdoors is presented for all subjects (middle panel). The mean and interquartile range of all values is reported by the box plots. All values are normalized by weight and distance covered. Statistical significance it marked with *p < 0.05, **p < 0.01, ***p < 0.001.
Download figure:
Standard image High-resolution imageThe values of oxygen consumption (VO2) were first normalized to the weight of the subject. Then the average of the baseline measured prior the start of the task was subtracted. The steady state consumption (SSC), identified as the average of the last 3 min of the session, was normalized by the distance covered and compared in the SF and no feedback (NF) conditions [9].
2.6. Treadmill walking with dynamic perturbations
Gait perturbations were performed on the GRAIL (Motek Medical B.V., Houten, Netherlands), a combined Vicon Nexus (Vicon Motion Systems, Oxford, United Kingdom) motion capture and split belt treadmill with embedded force plates system. The treadmill allowed mechanical movements in the medio-lateral (ML) direction, and used two different belts for the anterior-posterior (AP) movement, which required the movement of each leg at a different speed. The two belts allowed for an analysis of load forces divided between the two limbs. Before starting the recording sessions, subjects familiarized with the perturbations in a 4 min period. During the testing session, the participants walked for 1 min and then they were exposed to an initial set of random perturbations delivered both in the ML and AP direction, to avoid the first perturbation-related bias [41, 42]. Subjects were instructed to focus on a fixed point in front of them and avoid looking at their feet (visually monitored). Rest breaks were allowed between the different sessions to minimize fatigue.
Each subject performed four sessions in the SF condition and four sessions in the NF condition. Each session had 18 perturbations subdivided in eight slip (i.e. AP) and eight sway (i.e. ML) on the side of the prosthesis. To avoid biasing the subject, one slip and one sway were also performed on the healthy side. The order of perturbation was randomized for each session and for each subject. To prevent biasing in the results, the subjects did not know when and on which side they would receive the perturbation. Each perturbation was triggered after the subject walked freely for at least 5 s. After each perturbation, the treadmill was stopped with a deceleration of 0.8 m s−2, and a minimum of 2 s were given to the subject to recover equilibrium.
2.6.1. Slip
To simulate a slip perturbation on one limb, the ipsilateral belt was slowed down for a moment during the heel-strike. The speed of the perturbing belt was brought to the maximum amplitude and then to zero with an acceleration of 8 m s−2. The maximum speed of the belt was set at a Froude number [43] equal to 0.3. After the onset of the perturbation, the speed of the belt that was not perturbed was kept constant for 0.4 s and then brought to zero in 0.15 s with constant acceleration.
2.6.2. Sway
To simulate a lateral sway perturbation on one limb, the ML movement of the treadmill was triggered during the heel-strike of the perturbed limb. The decision to use also these perturbations was adopted because humans are laterally more unstable while walking [44–46]. The displacement of the belt was set to 60% of the leg length (from the anterior superior iliac spine to the medial malleolus) at an acceleration equal to the slips.
In both cases, participants wore a safety harness attached to an overhead track to prevent impact with the ground in case of irrecoverable loss of balance.
2.6.3. Post-processing analysis
The analysis of the reaction to perturbations was done separating SF versus NF sessions, and in these, splitting between the group of AP and ML perturbations. Then, the force load of the prosthesis, and the corresponding compensatory step on the healthy side, were analysed and compared between the SF and NF conditions. The compensatory steps in both types of perturbations were analysed up to the first load peak, which corresponded to a repeatable separated effort of the healthy leg. The force trace of the prosthesis step (i.e. the perturbed limb) was analysed completely (i.e. obtaining the classical m-shape) in the sway perturbation. Since the perturbation was delivered at the heel-strike (first peak), the analysis was performed up to the second peak only. All the steps were normalized (between 0% and 100%) in time for comparison. To analyse the stability of the step after the perturbation, its variability was analysed and compared between the SF and NF conditions. The variability was calculated using the dispersion of the step, obtained point-by-point from the normalized curve, using all the curves from the same condition. Depending on the step type, a different range of step percentage was used for the step variability evaluation (figures 3(D) and (E)). Considering that the perturbations occurred approximately at the 15% of the prosthesis step, the analysis of the perturbed step was performed from 20% to 80% of the normalized step for the case of the sway perturbation. In the case of the slip perturbation, the analysis was performed from 20% to 100%. For the compensatory steps, the analysis was from 0% to 100%.
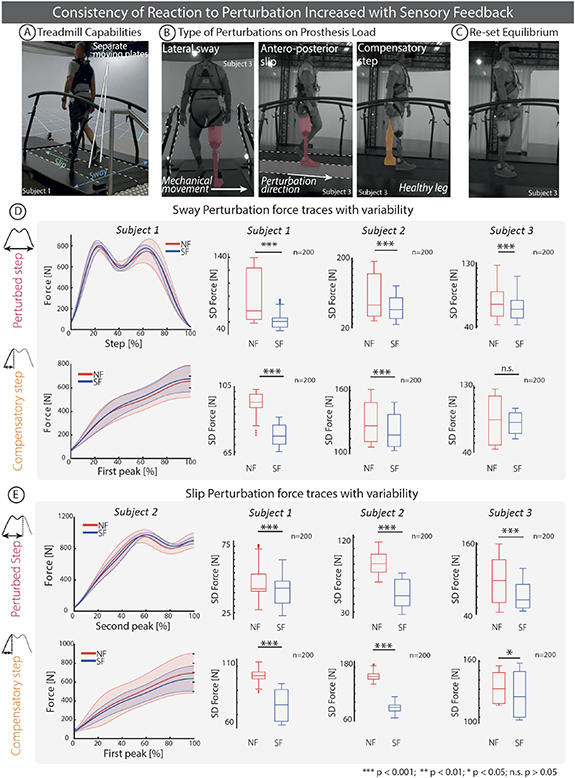
Figure 3. Dynamic perturbation task and self-reported confidence. (A)–(C) The subjects were asked to perform a task on the GRAIL system in which, while they are walking, AP (slip) or ML (sway) perturbations were delivered. (D) and (E) Both the force profiles of the perturbed steps and the compensatory steps were analysed and compared between SF and NF in all the subjects. The shaded areas denote the SD of the force profile for Sway (Subject 1) and Slippage (Subject 2) perturbations. The box plot indicate the standard deviation (SD) in the force trace. In each box plot, the thick horizontal line denotes the median, whereas the lower and upper hinges correspond to the first and third quartiles, the whiskers extend from the hinge to the most extreme value no further than 1.5× interquartile range from the hinge and the dots beyond the whiskers are outliers. All variability distributions were found to be non-normal and were analysed with the Wilcoxon rank sum test. Statistical significance is marked with *p < 0.05, **p < 0.01, ***p < 0.001, n.s. p > 0.05.
Download figure:
Standard image High-resolution image2.7. Treadmill walking with different inclinations
Participants walked on the treadmill at a self-selected speed in three distinct walking tasks: on a level surface, on a 5% grade incline, and on a 5% grade decline. Before each experiment, preferred walking speed was determined by gradually increasing the speed by 0.1 m s−1 until the participant reported that the speed was too fast. If necessary, the speed was reduced by 0.1 m s−1. Subjects were instructed to select a walking speed that was comfortably maintainable for 3 min in each of the three performed tasks. Subject 1 selected 1.25 m s−1, Subject 2 1.19 m s−1 and Subject 3 1.17 m s−1. Once determined, the walking speed was maintained constant during all the experiments. Each task included a 3 min session with SF active and a 3 min session with SF off (NF). The GRAIL was used to record data. Subjects were fitted with the marker set corresponding to the Plug-in Gait full body model. Their motion was tracked in 3D using ten motion capture cameras placed around the room, ground reaction forces were recorded by force plates in the treadmill, and video data were recorded by three cameras fixed on the right, left, and behind the subject.
2.8. Self-reported confidence
At the end of each motor task, participants were asked to assess their self-confidence while performing the task, using a 10 cm VAS scale (from 0 to 100) [9]. The data were acquired in SF and NF conditions in all the subjects.
2.9. Data collection and statistical analysis
Data were analysed using Matlab (R2019b, The Mathworks, Natick, MA, USA). Statistical analysis was performed using built-in Matlab functions. To test whether the collected data were normally distributed, a one-sample Kolmogorov–Smirnov test was performed. Normally distributed data were analysed using the two-sample paired t-test. For the few non-normal datasets, the two-sided sign rank test was used to evaluate statistical significance. Levels that were found to have a statistically significant difference with α = 0.05 and p < 0.05 were marked with an asterisk reported on the plots.
3. Results
3.1. Electro-cutaneous stimulation remapped the insole force and knee angle to the stump
As shown in figure 1(A) force insole values from the front, side and heel of the insole were mapped to electrically-induced sensations perceived at the front, side and back of the stump. The knee angle was linearly mapped to the stimulation intensity of the electrically-evoked sensation provided though an surface skin electrode pair placed above the hip. Details of perceived sensation location for each subject can be found in figure S1.
3.2. Electro-cutaneous stimulation evoked a range of identifiable sensation intensities
Prior to functional testing, sensation calibration was performed to determine the appropriate current and pulse-width values for different intensity levels. This JND-based encoding algorithm [38] allowed subjects to perceive distinct stimulation levels as opposed to just when the stimulation is ON or OFF.
As shown in the pulse-width column of table 2, Subject 1 perceived four different intensity levels and therefore had three pairs of intensity levels (L1–L2, L2–L3, L3–L4) to be confirmed for each of the four remapped stimulation channels. Subject 2 had four pairs on Ch1, three pairs on Ch2, and two pairs on Ch3 and Ch4. Subject 3 had two pairs on Ch1 and Ch2 and one pair on Ch3 and Ch4. The WFs found for each step between levels are shown in figure S2(A).
Table 2. Charge injected for each channel per level determined through calibration and implemented during functional tests.
| Stimulation channel | Pulse-width (µs) | Amplitude (mA) | |||||
|---|---|---|---|---|---|---|---|
| LI | L2 | L3 | L4 | ||||
| Subject 1 | Ch 1 | 136 | 198 | 278 | 391 | 7 | |
| Ch 2 | 140 | 196 | 278 | 390 | 7 | ||
| Ch 3 | 134 | 190 | 267 | 374 | 11 | ||
| Ch 4 | 134 | 191 | 278 | 390 | 10 | ||
| LI | L2 | L3 | L4 | L5 | |||
| Subject 2 | Ch 1 | 90 | 130 | 182 | 260 | 366 | 7 |
| Ch 2 | 156 | 219 | 307 | 430 | 10 | ||
| Ch 3 | 136 | 191 | 269 | 8 | |||
| Ch 4 | 129 | 184 | 264 | 8 | |||
| LI | L2 | L3 | |||||
| Subject 3 | Ch 1 | 184 | 264 | 371 | 10 | ||
| Ch 2 | 130 | 186 | 261 | 11 | |||
| Ch 3 | 390 | 586 | 7 | ||||
| Ch 4 | 226 | 342 | 9 | ||||
These levels were then validated in a discrimination task. The results of the validation for Subject 1 surpassed the 75% correct identification rate used to identify the JND in all cases except for Ch3 and Ch4 between L1 and L2 where the correct identification rate was 70% in both cases. Similarly, for Subject 2, the pairs of intensity levels correctly distinguished at the JND rate except for L3–L4 on Ch2 and L4–L5 on Ch1 where the correct identification rate was 70% in both cases. Subject 3 could only distinguish the difference between half of the intensity level pairs with an accuracy higher than the JND rate. The complete record of performances for each channel and subject is shown in figure S2(B) and table S1.
3.3. Leg amputees expend less oxygen while walking with the non-invasive SF system
All subjects walked on grass while their metabolic consumption was measured by a wearable system in two conditions: with (SF) and without (NF) SF. In this study, subjects walked back and forth over a 23.7 m long stretch of grass for 6 min while their oxygen consumption was being recorded. In both the SF and NF conditions, each Subject covered the same amount of distance on the grass course in each 6 min trial meaning their speed was not increased. Subject 1 walked 223 m both with NF and SF, Subject 2 walked 190 m both with NF and SF, Subject 3 walked 163 m with NF and 175 m with SF.
All three subjects had a lower normalized SSC (NSSC) during the SF condition. When compared to NF, Subject 1, Subject 2, and Subject 3 reduced their NSSC by 15.8% (p < 0.001), 7.9% (p < 0.05), and 5.0% (p = 0.05) respectively (figure 2).
3.4. Self-reported confidence in all tasks increased in the SF condition
Confidence was self-reported on a visual analogue scale (VAS scale) from 0 to 10 after the completion of each motor task. The confidence scores were 4.1% higher (p < 0.01) with SF (8.16 ± 0.56) than with NF (7.84 ± 0.54) for Subject 1, 56.8% higher (p < 0.001) with SF (8.91 ± 0.66) than with NF (5.68 ± 1.86) for Subject 2, and 12.8% higher (p < 0.001) with SF (9.31 ± 0.45) than with NF (8.25 ± 0.73) for Subject 3 (figure 2).
3.5. Step loading is more stable during gait perturbations with SF
All subjects performed the gait perturbation tasks where their loading forces in the SF and NF conditions were compared. Both the perturbed step (perturbation applied at the heel-strike) and the compensatory step (step immediately after the perturbed step) were analysed for both AP slip and ML sway perturbations (figures 3(A)–(C), movie S3).
3.5.1. Sways
All the subjects presented a lower variability (statistical power >99%) in loading force with SF with respect to NF, in the perturbed step (Subject 1 p < 0.05 N = 100; Subject 2 p < 0.001 N = 100; Subject 3 p < 0.001 N = 100). For the compensatory step only Subject 1 and Subject 2 had a lower variability (Subject 1 p < 0.001 N = 100; Subject 2 p < 0.001 N = 100; Subject 3 p = 0.21 N = 100) (figure 3(D)). The variability was reduced by 10.6% (NF = 43.07 N SF = 48.19 N) and 24.0% (NF = 102.6 N SF = 78.1 N) for the perturbed and compensatory step respectively in Subject 1; 48.0% (NF = 96.9 N SF = 65.5 N) and 9.0% (NF = 129.8 N SF = 118.1 N) in Subject 2; 10.8% (NF = 66.9 N SF = 59.7 N) and 5.5% (NF = 83.5 N SF = 78.9 N) in Subject 3 although reduction in variability of the compensatory step in Subject 3 was not statistically different.
3.5.2. Slips
All the subjects presented a lower variability (statistical power >99%) in loading force of the perturbed step during the SF condition compared to the NF condition, reducing the variability by: 46.3% (NF = 78.2 N SF = 42.0 N), 42.3% (NF = 91.7 N SF = 52.9 N) and 34.2% (NF = 102.7 N SF = 67.6 N) (p < 0.001 N = 100; p < 0.001 N = 100; p < 0.001 N = 100) in Subject 1, Subject 2, and Subject 3 respectively (figure 3(E)). They also all showed a lower variability in loading force on the compensatory step during the SF condition compared to the NF condition, reducing the variability by: 15.6% (NF = 92.3 N SF = 77.9 N), 46.1% (NF = 160.8 SF = 86.7 N) and 5.2% (NF = 131.6 N SF = 124.7 N) (p < 0.001 N = 100; p < 0.001 N = 100; p < 0.03 N = 100) in Subject 1, Subject 2, and Subject 3 respectively.
3.6. Non physiological heel-strike peak reduced with SF
The force subjects exerted on the treadmill was recorded and used to analyse heel-strike peak, described as the first of two loading peaks characteristic in amputee gait [27]. A statistically significant reduction in heel-strike peak was observed in all three subjects during different walking tasks when the SF was active. This peak in the force trace occurs before the weight-acceptance peak on the healthy leg and is considered to be an unhealthy characteristic of amputee gait [27] (figure 4). This heel-strike peak was decreased by 2.99% (p < 0.001) in Subject 1 during the incline walking task, 9.75% (p < 0.001) in Subject 2 during the level walking task, and 22.59% (p < 0.001) in Subject 3 during the decline walking task.
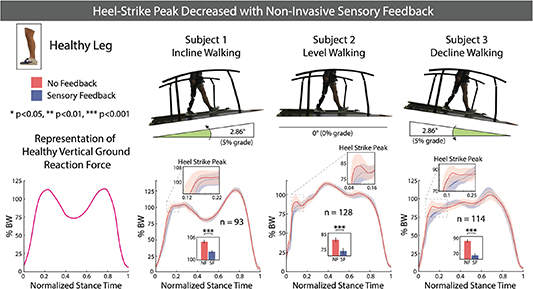
Figure 4. Heel strike peak decreased with non-invasive SF. Subjects performed a level, decline and incline walking task on a sensorized treadmill. Vertical ground reaction force during stance phase is displayed with bar graph insets that display heel-strike peak height in the NF and SF conditions as mean ± SEM. A two sample t-test was performed to test the statistical difference in Subject 1 (normally distributed data) and a Wilcoxon rank sum test was performed in Subject 2 and Subject 3 (non-normally distributed data). Statistical significance is marked with *p < 0.05, **p < 0.01, ***p < 0.001.
Download figure:
Standard image High-resolution image3.7. Prosthetic step length and width were diminished with SF
The Subjects' step length and width were analysed by isolating the x and y-components of the ankle marker (movie S1). The step length of the prosthetic leg was increased in SF during the incline walking task. In Subjects 1 and 3, step length was increased by 1.8% and 5.3% (p < 0.001 N = 166 and p < 0.001 N = 132) respectively (figure 5(A)). The step width of the prosthetic leg was decreased in SF during the level walking task. In Subjects 1 and 2, step width was decreased by 15.0% and 13.2% (p < 0.01 N = 154 and p < 0.001 N = 128) respectively (figure 6(A)).

Figure 5. Step length and push-off force increased with SF on incline walking task. Subjects performed an incline walking task on a sensorized treadmill while their kinematic data were being recorded by Vicon Nexus and force date recorded by embedded force plates. For subjects 1, 2, and 3, the number of steps used in the analysis were 147, 127, and 118 respectively. (A) The range of the y-coordinate (sagittal axis) of the ankle marker in each gait cycle was obtained to measure step length. Ankle marker trajectories are displayed with bar graph insets that display step length in the NF and SF conditions as mean ± standard error. A two sample t-test was performed to test the statistical difference. (B) Vertical ground reaction force of the healthy leg was recorded and normalized to the body weight of the subject. The mean and standard error of the force profiles are displayed and the bar graph insets display the mean ± standard error of the push-off peaks. A two sample t-test was performed to test the statistical difference. Statistical significance is marked with *p < 0.05, **p < 0.01, ***p < 0.001.
Download figure:
Standard image High-resolution image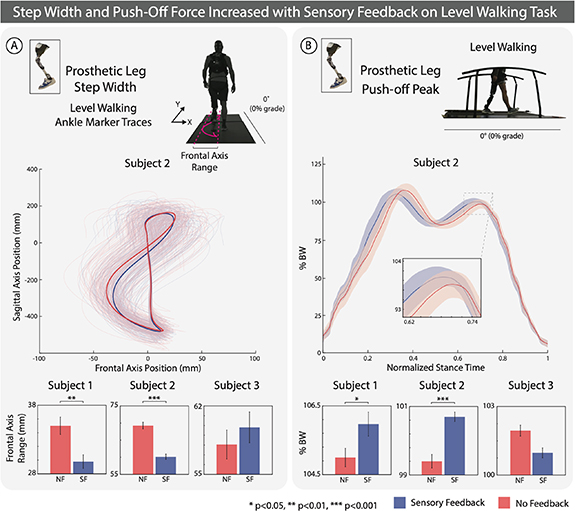
Figure 6. Step width and push-off force increased with SF on level walking task. Subjects performed an incline walking task on a sensorized treadmill while their kinematic data were being recorded by Vicon Nexus and force date recorded by embedded force plates. For Subjects 1, 2, and 3, the number of steps used in the analysis were 125, 134, and 132 respectively. (A) The range of the x-coordinate (frontal axis) of the ankle marker in each gait cycle was obtained to measure step width. Ankle marker trajectories are displayed with bar graph insets that display step width in the NF and SF conditions as mean ± SEM. A two sample t-test was performed to test the statistical difference. (B) Vertical ground reaction force of the prosthetic leg was recorded and normalized to the body weight of the subject. The mean and standard error of the force profiles are displayed and the bar graph insets display the mean ± standard error of the push-off peaks. A two sample t-test was performed to test the statistical difference. Statistical significance is marked with *p < 0.05, **p < 0.01, ***p < 0.001.
Download figure:
Standard image High-resolution image
3.8. Step push-off force was augmented with SF
The Subjects' step force was recorded by the force plates embedded in the treadmill used for walking. The push-off force of the healthy leg was increased during the incline walking task in Subjects 1, 2, and 3 by 0.89%, 1.30%, and 2.44% (p < 0.01 N = 147, p < 0.05 N = 127, and p < 0.001 N = 118) respectively (figure 5(B)). The push-off force of the prosthetic leg was increased during the level walking talk in Subject 1, and 2 by 0.66% and 1.77% (p < 0.05 N = 125 and p < 0.001 N = 134) respectively (figure 6(B)).
4. Discussion
In this study, the functional effects of a non-invasive feedback system based on remapped electro-cutaneous stimulation was tested in three transfemoral amputees. Use of the system decreased metabolic costs, increased confidence, improved gait kinematics, and increased the dynamic stability of the prosthetic users. All the subjects enrolled in this study were able to successfully exploit the remapped feedback in their prosthesis in different functional tasks.
Metabolic consumption was reduced with the use of this non-invasive intervention while walking over natural terrain. In particular, the reduction of VO2 consumption in Subject 1 at 15.8% was comparable to the amount of reduction observed by Ishmael et al at 15.6% [30]. As hypothesized by Petrini et al [9] in an invasive study restoring SF with similar metabolic results, this may be a result of increased symmetry or increased self-selected speed due to SF, as they observed. Self-selected speed was recorded but not found to be increased with SF in the non-invasive system, indicating that it was not the increased efficiency of the pendulum-like mechanism described by Detrembleur et al [47] that decreased metabolic costs. Since differences were not observed in walking speed, gait symmetry is likely the more relevant factor that contributed to a decrease in metabolic consumption. SF led to increased confidence and less compensatory movements while walking, reflected as increased gait symmetry. This contributed to less fatigue and therefore less metabolic consumption while walking.
In the validation of this system performed by Basla et al [28], symmetry while walking indoors was shown to increase, further supporting this as a possible mechanism for metabolic consumption reduction. Basla et al presented preliminary kinematic results in one transfemoral amputee as a way to validate their system. Here we demonstrate our functional results and associated kinematic mechanisms consistently in three individuals. Hip extension and flexion symmetry would be of particular interest to investigate as it has been linked to changes in metabolic consumption in a powered hip exoskeleton for transfemoral amputees [30] and healthy older adults [48]. Further analyses with this non-invasive system are necessary to investigate this particular point. Regardless of the mechanism, the large effect of SF on metabolic consumption found in the study is expected to be particularly beneficial in transfemoral amputees. Indeed, they have higher rates of energy expenditure when walking compared to other lower limb amputees such as transtibial or ankle disarticulation since they are required to move a larger prosthetic while missing a larger proportion of their body [3]. This highlights the impact of this improvement in the lives of transfemoral amputees.
This quality of life improvement is demonstrated through the increase of confidence scores averaged over all tasks with SF. Similar findings in invasive studies that also demonstrate an increase in confidence linked with a reduction in mental effort [9, 49]. With this said, it would be interesting to investigate the cognitive load required to understand and integrate this remapped stimulus [31].
The increase in the consistency of the perturbation recovery steps may be a potential explanation for the observed increase in confidence. This increased consistency suggests that the SF provided by this system was able to reverse some of the changes to the sensory-motor system caused by the amputation and improve balance recovery from trips [50]. Augmented confidence may also come from microscopic gait changes such as the decrease in the non physiological heel-strike peak, increase in step length, decrease in step width, and associated increases in push-off force that, when combined with perturbation recovery consistency, contribute to more natural and trustworthy gait. Furthermore, in the incline walking task, the increase in prosthetic step length in Subjects 1 and 3 is consistent with the increased push-off force on the healthy leg that may propel the prosthetic leg further forward (figure 5). In the level walking task, the decrease in prosthetic step width is consistent with the increase in prosthetic push-off force as this increased propulsion would result in a more efficient swing phase (figure 6). These factors all contribute to more physiological and healthy gait and contribute to the explanation of reduced metabolic consumption and increased confidence. This multimodal, non-invasive feedback system provides a distinct health benefit through reduced metabolic consumption and is able to augment confidence and dynamic balance by restoring a subset of the lost sensory information.
Nevertheless, the main drawback of this system lies in its non-invasive nature and the difficulty of eliciting natural, somatotopic sensations. The sensation mapping presented here is similar to other paradigms in how it is intuitively remapped [18] with the front, lateral and back of the foot mapped to the front, lateral and back of the thigh, and how it is intensity modulated [17] with higher forces corresponding to higher stimulation intensities. These features combined with a unique psychometric calibration method and the addition of proprioceptive knee angle feedback resulted in a multimodal SF that was intuitively exploitable by the user. In particular, the psychometric, OC algorithm generates stimulation levels mapped to levels of force and knee flexion that are easily discriminable and unique to each user [33, 51]. The WFs presented in figure S2(A) present a characterization of the sensory receptors under the electrodes. The slight variability in WF is likely due to slight intra-subject fluctuation since the JND and WF verification task were dependent on subject perception and concentration while stimulus was being presented. The WF is also expected to be higher for weaker signals [39], however, a lack of precise concentration over time while performing the JND task may also explain why this is not observed.
With this system and the OC method that accompanies it, all three subjects were able to identify distinct locations and levels of stimulation using the non-invasive system. This is consistent with other non-invasive solutions that stimulate distinct locations [14, 15, 17, 18], but is unique in that it is the only non-invasive system where transfemoral amputees can recognize and exploit different stimulation levels based on WF [39] and JND with respect to a reference. However, the complete evaluation of the effects of exploiting an optimally-calibrated (JND-based) encoding compared to a linear one in functional and ecological motor tasks is to be performed in the future.
A somatotopic non-invasive feedback may be able to provide a more diverse array of benefits through encoding more information and improving the intuitiveness of the SF through bypassing the remapping process that results in fewer evoked sensations and a reduced number of distinguishable sensation levels. Targeted sensory re-innervation has been shown to reduce phantom limb pain through a remapping of somatotopic sensations such they can be elicited through non-invasive touch, but the preparation of this naturally requires a surgery to retarget the nerves [52], defeating the point of having a non-invasive solution. Considering this, the presented method of non-invasive sensory restoration could be improved in future iterations of the device, if nerves near the surface of the skin on the stump can be stimulated non-invasively. This is quite difficult to achieve in transfemoral amputees where the tibial nerve is far from the surface of the stump. Although sensory nerves can be stimulated non-invasively from behind the knee in transtibial amputees [20], the scenario in which sensations are evoked with the subject lying prone are impractical for implementation in a functional prosthesis. With the non-invasive stimulation technology we have now, direct targeting of the nerve is difficult, but even with simple feedback strategies we are able to improve metabolic consumption, increase confidence, and increase dynamic stability. The main drawback of the system comes from the nature of the stimulation. A remapped feedback that provides non-natural sensations is not selective and necessitates reliable calibration in order for users to be compliant. The OC method takes into account user intuitiveness, but requires quite some time to produce a reliable calibration. The significant health benefits presented here suggest that the extra time to calibrate may have been worth it, and is also worth investigating in the future. Not only would better calibration increase user compliance and device accessibility, it would allow further investigation of how prostheses can be cognitively integrated and embodied with non-invasive solutions and how that could lead to a broader set of benefits that would improve the daily life of the users.
Acknowledgments
The authors are immensely grateful to the volunteers who freely donated their time to the advancement of knowledge and to a better future for traumatic leg amputees. The funder had no role in the experimental design, analysis, or manuscript preparation or submission. All authors had complete access to data. All authors authorized submission of the manuscript, but the final submission decision was made by the corresponding author.
Data availability statements
The data that support the findings of this study are available upon reasonable request from the authors.
Funding
This project has received funding from the European Research Council (ERC) under the European Union's Horizon 2020 research and innovation program (FeelAgain Grant Agreement No. 759998), Swiss National Science Foundation (SNSF) and Innosuisse under the Bridge Proof of Concept program (MYLEG No. 193724), Swiss National Science Foundation (SNSF) (MOVEIT No. 197271) and From Innosuisse ICT program (n. 47462.1 IP-ICT).
Author contributions
L C performed the experiments and the analyses, made the figures and wrote the manuscript; G V performed the experiments, supervised the analyses, discussed the results, reviewed the manuscript and made the figures; M M developed the calibration software and the overall system integration and performed the experiments and the analyses, made figures; G P performed the experiments, prepared the ethical protocol and reviewed the manuscript; F H and M X performed the experiments for the oxygen consumption assessment; R R discussed the results and reviewed the manuscript; S R designed and supervised the experiments, supervised the analyses, discussed the results and reviewed the manuscript. All the authors authorized submission of the manuscript, while the final submission decision was taken by the corresponding author.
Conflict of interest
S R holds shares of 'Sensars Neuroprosthetics', a start-up company dealing with potential commercialization of neurocontrolled artificial limbs. The other authors do not have anything to disclose.