

Abstract
To determine the Avogadro constant NA by the x-ray crystal density method, the density of a 28Si-enriched crystal was determined by absolute measurements of the mass and volume of a 1 kg sphere manufactured from the crystal. The mass and volume were determined by an optical interferometer and a vacuum mass comparator, respectively. The sphere surface was characterized by x-ray photoelectron spectroscopy and spectroscopic ellipsometry to derive the mass and volume of the Si core of the sphere excluding the surface layers. From the mass and volume, the density of the Si core was determined with a relative standard uncertainty of 2.3 × 10⁻⁸. By combining the Si core density with the lattice constant and the molar mass of the sphere reported by the International Avogadro Coordination (IAC) project in 2015, a new value of 6.022 140 84(15) × 1023 mol−1 was obtained for NA with a relative standard uncertainty of 2.4 × 10⁻⁸. To make the NA value determined in this work usable for a future adjustment of the fundamental constants by the CODATA Task Group on Fundamental Constants, the correlation of the new NA value with the NA values determined in our previous works was examined. The correlation coefficients with the values of NA determined by IAC in 2011 and 2015 were estimated to be 0.07 and 0.28, respectively. The correlation of the new NA value with the NA value determined by IAC in 2017 using a different 28Si-enriched crystal was also examined, and the correlation coefficient was estimated to be 0.21.
Export citation and abstract BibTeX RIS

Content from this work may be used under the terms of the Creative Commons Attribution 3.0 licence. Any further distribution of this work must maintain attribution to the author(s) and the title of the work, journal citation and DOI.
1. Introduction
The kilogram is the only base unit of the International System of Units (SI) still defined by an artefact, the international prototype of the kilogram (IPK), which is kept at the Bureau International des Poids et Mesures (BIPM) in Sèvres near Paris [1, 2]. The IPK mass is theoretically invariant: because it defines the kilogram, its mass is always exactly 1 kg. However, in the third periodic verification of national prototypes of the kilogram, it was found that the masses of the some official copies of the IPK changed with respect to the IPK by about 50 µg, or 5 × 10⁻⁸ in relative terms, for 100 years [3]. This has raised concern about the long-term stability of the IPK mass. Since it is now possible to compare two mass standards of the same material with an uncertainty of about 1 µg, such a large instability is a critical issue in performing reliable mass measurements.
To overcome this problem, the International Committee for Weights and Measures (CIPM) has proposed a change in the definition of the kilogram. The new definition will be based on a fixed value of the Planck constant h and is anticipated to be accepted in 2018 [4]. Toward the change in the definition, national metrology institutes (NMIs) are now being requested to continue attempts to link the kilogram to h with a relative uncertainty of a few parts in 10−8 [4]. The Avogadro constant NA is an important input datum in changing the definition of the kilogram, because h can be calculated from NA via the molar Planck constant NAh. Since the relative standard uncertainty of NAh has been estimated to be as small as 4.5 × 10⁻¹⁰ by the CODATA Task Group on Fundamental Constants (CODATA-TGFC) [5], an accurate and independent measurement of NA will play a crucial role in the determination of h in the new definition.
For these reasons, the National Metrology Institute of Japan (NMIJ) has determined the value of NA as a framework of the International Avogadro Coordination (IAC) project [6–10]. The method used was the x-ray crystal density (XRCD) method, where the Avogadro constant was determined from absolute measurements of the lattice constant, density and molar mass of a silicon crystal. The density was determined from the mass and volume measurements of 1 kg spheres manufactured from the crystal. Since the spheres were covered with surface layers, the sphere surface was characterized to determine the density of the Si core of the sphere excluding the surface layers. These quantities were measured for a 28Si-enriched crystal at the laboratories involved in the IAC project [7, 8]. The IAC project succeeded in determining the Avogadro constant with relative standard uncertainties of 3.0 × 10⁻⁸ in 2011 [7] and 2.0 × 10⁻⁸ in 2015 [8], and the correlation coefficient between the two values of NA was estimated to be 0.17 [9].
After the change in the definition, NMIs will realize the kilogram based on the Planck constant. To confirm the international equivalence of the ability to realize the new definition by NMIs, a pilot study to compare the realization based on the value of h provided by the CODATA adjustment of 2014 [5], organized by the Consultative Committee for Mass and Related Quantities (CCM), is now ongoing. The pilot study compares the realizations at the level of 1 kg obtained by experiments that are capable of determining mass with a relative standard uncertainty of less than 2.0 × 10⁻⁷. As a participant of this pilot study, NMIJ determined the mass of a 1 kg 28Si-enriched sphere based on the values of h by the XRCD method in 2017, in which the sphere mass was derived by measuring the volume of the Si core and the mass of the surface layers of the sphere [11]. The measurement data for the pilot study can be used to determine the Avogadro constant based on the present definition of the kilogram. However, our previous work was only focused on the determination of the sphere mass based on the new kilogram definition. In this paper, the measurement data are therefore used to derive a new value of the Avogadro constant.
The h value in the new kilogram definition will be determined using a least-squares adjustment by the CODATA-TGFC that takes into account the h values determined by various methods and the correlation between them. To make the NA value determined in this work usable for a future adjustment, the correlation with the previous determinations of the Avogadro constant [7, 8] is therefore examined in this paper.
2. XRCD method
The measurement of the Avogadro constant NA by the XRCD method using a silicon crystal is based on the following equation [7–10]:

where ρ, M and a are its density, molar mass and lattice constant, respectively. The density is determined from the mass and volume measurements of a 1 kg sphere manufactured from the crystal. The sphere is covered with surface layers whose main constituent is SiO2 as shown in figure 1. The basic concept of the XRCD method is the counting of the Si atoms in the sphere. The density of the Si core of the sphere excluding the surface layers is therefore necessary to determine NA. The density of the Si core is determined from its mass and volume. In this paper, these two parameters are designated as 'Si core mass (mcore)' and 'Si core volume (Vcore)', respectively. Equation (1) is therefore modified to

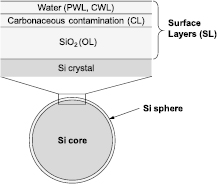
Figure 1. Surface layer model for the characterization of the 28Si sphere. CWL refers to a chemically adsorbed water layer that is still present under ultrahigh vacuum conditions. CL refers to a carbonaceous contamination layer formed by different adsorbed gases and contaminants, originating from the environment during the measurement, handling, storage and cleaning of the sphere. PWL refers to a physically adsorbed water layer, which must be included when the measurements are performed under ambient conditions.
Download figure:
Standard image High-resolution imageTo determine NA in this study, the 28Si-enriched crystal sphere AVO28-S5c, was used. This sphere was manufactured by the IAC project, and details of the sphere are given in [8]. The values of a, M, Vcore and mcore for this sphere were already measured by the IAC project to determine NA in 2011 [7] and 2015 [8].
On the other hand, the XRCD method will be used to realize the kilogram from the new definition of the kilogram based on the value of h [10]. From equation (2), the mass of the Si sphere msphere is related to h as
where R∞, α, M(e), c and mSL are the Rydberg constant, the fine-structure constant, the molar mass of electron, the speed of light in vacuum and the mass of the surface layers, respectively [10]. In the pilot study to realize the kilogram based on the new definition, the values of Vcore and mSL of AVO28-S5c were measured again by NMIJ in 2017 [11]. By combining these values with the values of a and M measured by IAC in 2015 [8] and the values of R∞, α and M(e) in the CODATA adjustment in 2014 [5], the sphere mass based on h msphere,h was determined using equation (3). The sphere mass based on the present definition of the kilogram msphere was also measured to confirm the reliability of the determination of msphere,h. Details of the realization are summarized in [11].
In this paper, the values of Vcore, mSL and msphere measured by NMIJ in 2017 are combined with the values of a and M measured by IAC in 2015 to give a new NA value using equation (2). A brief summary of the measurement by NMIJ in 2017 is also provided to elucidate the correlation between the determined values of NA.
3. Si core volume measurement by NMIJ in 2017
The Si core volume was determined on the basis of diameter measurement by optical interferometry. The measured diameter was the apparent diameter, which is not corrected for the phase shift due to the surface layers. To derive the Si core volume from the apparent diameter, the surface layers on the sphere were characterized.
3.1. Optical interferometry
The sphere volume was measured by an optical interferometer with a direct optical frequency tuning system [12–15]. The Si sphere was placed in a fused-quartz Fabry–Perot etalon. The sphere and etalon were installed in a vacuum chamber equipped with an active radiation shield to control the sphere temperature. The pressure in the chamber was reduced to 1 × 10⁻³ Pa. Measurements of the fractional fringe order of interference for the gaps between the sphere and the etalon, d1 and d2, and the etalon spacing L were carried out by phase-shifting interferometry. The sphere diameter D was calculated as D = L − (d1 + d2). The light source of the interferometer was an external cavity diode laser, and the required phase-shift for the diameter measurement was produced by tuning the optical frequency of the laser over the frequency range of 20 GHz [13]. The wavelength reference in the optical frequency tuning system was synthesized by a frequency comb at NMIJ from an atomic clock linked to coordinated universal time (UTC) [12]. The comb is also used as the national standard of length in Japan.
A sphere rotation mechanism installed under the sphere was used to measure the diameter from many different directions. In a set of the diameter measurement, the diameter was measured from 145 directions distributed near-uniformly on the sphere surface [12, 15]. The set of the diameter measurement was repeated 15 times. Between each set, the sphere was oriented to distribute all the measurement directions as uniformly as possible. The temperature of the sphere was measured using small platinum resistance thermometers (PRTs) inserted in copper blocks in contact with the sphere. The PRTs were calibrated using the Ga melting point and the water triple point according to ITS-90. The measured diameters were converted to those at 20.000 °C using the thermal expansion coefficient of the enriched 28Si crystal [16]. The measured diameter and volume were the apparent diameter and volume, which are not corrected for the phase shift due to the surface layers. Table 1 summarizes the apparent diameter Dapp and apparent volume Vapp. Details of the measurement results and the uncertainty estimation are given in [11]. The values of Dapp and Vapp in table 1 are slightly different from those in [11] due to a small correction based on the calibration of the temperature sensors after the volume measurement.
Table 1. Apparent diameter Dapp and volume Vapp of AVO28-S5c at 20.000 °C and 0 Pa obtained by NMIJ in 2017.
| Quantity | Value | ur |
|---|---|---|
| Apparent diameter Dapp |
93.710 811 44 (62) mm | 6.7 |
| Apparent volume Vapp |
430.891 2923 (86) cm3 | 20 |
aRelative combined standard uncertainty of each quantity. bDiameter observed by interferometry. cVolume observed by interferometry.
3.2. Surface characterization
The surface layers consisted of an oxide layer (OL), a carbonaceous contamination layer (CL), a physically adsorbed water layer (PWL) and a chemically adsorbed water layer (CWL) as shown in figure 1. To derive the Si core volume Vcore from the apparent volume, the thickness of each surface layer was determined by two different methods: x-ray photoelectron spectroscopy and spectroscopic ellipsometry.
3.2.1. X-ray photoelectron spectroscopy (XPS).
An XPS system of NMIJ was used for the surface characterization, whose main component was an ULVAC-Phi 1600C system equipped with a monochromatic Al Kα x-ray source. The pressure in the chamber was reduced to 1.5 × 10⁻⁶ Pa. The Si sphere was rotated around the horizontal axis and vertical axis by a manipulator to characterize the entire surface. The XPS spectra were measured at 52 points distributed near-uniformly on the sphere surface. Details of the XPS system are provided in [11, 17].
3.2.1.1. Determination of oxide layer (OL) thickness by XPS.
The thickness of the OL was determined by analyzing XPS Si 2p core-level spectra, in which peaks corresponding to the SiO2 layer and the interfacial OL (Si2O3, SiO and Si2O) were observed. To ensure the traceability of the OL thickness measurement to the SI, the attenuation lengths for the Si 2p electrons in SiO2, Si2O3, SiO and Si2O were determined by an SI-traceable x-ray reflectometry (XRR) system at NMIJ [18] using flat Si samples with different thicknesses of thermal SiO2. The OL thickness was determined as the sum of each OL. The average OL thickness at the 52 points was estimated to be 1.26(9) nm [11, 17].
3.2.1.2. Determination of carbonaceous contamination layer (CL) thickness by XPS.
In the XPS C 1s core-level spectra, peaks corresponding to the C–C/H, C–O, CF2 and CF3 bonds were observed. In our previous work [18], the main constituent of the CL was considered to be a hydrocarbon. However, the peaks assigned to both the C–C/H and C–O bonds were clearly observed in this work. Since ethanol was used in the final step of cleaning the sphere before the XPS measurement [11], the peaks assigned to both the C–C/H and C–O bonds were considered to be from ethanol and a hydrocarbon. The peaks assigned to the CF2 and CF3 bonds were assumed to be from perfluoroalkoxy (PFA). The thickness of the CL dCL was therefore determined on the assumption that the CL was composed of an ethanol sublayer, a hydrocarbon sublayer and a PFA sublayer. The average thicknesses of these sublayers at the 52 points were estimated to be 0.62(10) nm, 0.45(6) nm and 0.20(4) nm, respectively. From these results, the CL thickness was estimated to be 1.27(12) nm. In addition, the density of the CL was estimated to be 1.08(14) g cm−3 by considering the thickness and density of each sublayer. Details of the procedure to determine the thickness and density of the CL are given in [11, 17].
3.2.2. Spectroscopic ellipsometry.
A spectroscopic ellipsometer (Semilab GES5E) equipped with an automatic sphere rotation system was also used to determine the OL thickness [11, 19]. Its spectral bandwidth ranges from 250 nm to 990 nm. The reliability of the ellipsometer was checked using SiO2 layers on wafers certified by the SI-traceable XRR system at NMIJ [18].
The ellipsometer and automatic sphere rotation system were integrated into a vacuum chamber to characterize the surface layers both in air and in vacuum. The ellipsometric measurement of the 28Si sphere was performed at 812 points on the sphere both in air and in vacuum. The 812 points were distributed near-uniformly on the sphere surface [11].
The surface model shown in figure 1 was fitted to the measured ellipsometric data to obtain the OL thickness. In the fitting, only the OL thickness and the incident angle of the light were adjusted and the thicknesses of the other layers were fixed, where the thicknesses of the CWL and PWL determined by gravimetry [8] and the thickness of the CL determined by XPS [17] were used. The dispersion data of the optical constants (refractive index and extinction coefficient) of the CL were estimated by combining those of ethanol [20] and a hydrocarbon [18]. For the other layers and the Si substrate, the optical constants in the database of simulation software (SEA, Semilab Co. Ltd) were used. The PWL was not considered in the determination of the OL thickness in vacuum.
The OL thickness was evaluated to be 1.13(29) nm in vacuum and 0.89(30) nm in air. The weighted mean of the two thicknesses was 1.01(30) nm [19]. The uncertainties of the OL thickness determinations in air and in vacuum are almost same. In addition, the two thickness determinations are highly correlated [19]. The uncertainty of the weighted mean of the OL thickness is therefore almost same as the uncertainties of the thickness determinations in air and in vacuum. The OL thickness was also measured using the XPS system to be 1.26(9) nm as described in section 3.2.1.1. The weighted mean of the OL thicknesses determined by the two different techniques was 1.24(9) nm. This thickness was used as the OL thickness to evaluate the Si core volume and mass of the sphere. Table 2 summarizes the thickness of each layer evaluated by XPS and spectroscopic ellipsometry. In this table, the thickness of the CWL estimated by gravimetry [8] is also listed.
Table 2. Mass, thickness and density of surface layers.
| Layer | Thickness/nm | Density/g cm−3 | Mass/µg |
|---|---|---|---|
| OL | 1.24(9) | 2.2(1) | 75.2(6.3) |
| CL | 1.27(12) | 1.08(14) | 37.7(5.9) |
| CWL | 0.28(8) |
1.0(1) |
7.7(2.3) |
| Total | 2.79(17) | 120.6(8.9) | |
aValues from [8].
3.3. Si core volume
To determine the Si core volume, the total phase retardation upon reflection at the sphere surface δ was calculated in accordance with the procedure in [13]. To calculate δ, the thickness and the optical constants of each layer given in table 3 were used. The phase shift upon reflection (δ − π), was estimated to be −0.054(3) rad. The effect of this phase shift on the gap measurement Δd was 2.73(16) nm. This means that the actual diameter including the surface layers is larger than the apparent diameter by 5.45(32) nm. The actual diameter Dactual was therefore obtained using Dactual = Dapp + 2 Δd. The phase shift correction to obtain the Si core diameter from the apparent diameter, Δd0, was determined as Δd0 = 2 (Δd − dtotal), where dtotal is the sum of the thickness of each layer. The value of Δd0 was estimated to be −0.13(8) nm. Table 3 shows the uncertainty budget in the determination of Δd0. The Si core diameter Dcore was determined to be 93.710 811 32(63) mm using Dcore = Dapp + Δd0. The Si core volume Vcore was estimated to be 430.891 2905(87) ×10−6 cm3 with a relative standard uncertainty of 2.0 × 10⁻⁸.
Table 3. Uncertainty budget in the determination of the phase shift correction Δd0 to obtain the Si core diameter.
| Uncertainty source | Value | Standard uncertainty in Δd0/nm |
|---|---|---|
| Refractive index | ||
| CWL | 1.332(10) | 0.001 |
| CL | 1.40(15) | 0.078 |
| OL | 1.457(10) | 0.005 |
| Si | 3.881(1) | 0.000 |
| Extinction coefficient | ||
| CWL | 0 | |
| CL | 0.00(12) | 0.007 |
| OL | 1.54(1.00) × 10−8 | 0.000 |
| Si | 0.019(1) | 0.014 |
| Thickness | ||
| CWL | 0.28(8) nm | 0.009 |
| CL | 1.27(12) nm | 0.016 |
| OL | 1.24(9) nm | 0.014 |
| Combined standard uncertainty | 0.083 | |
4. Si core mass measurement by NMIJ in 2017
The Si core mass mcore was determined from the mass of the sphere including the surface layers measured by a mass comparator msphere and from the mass of the surface layers evaluated by the surface characterization mSL.
4.1. Mass measurement by a mass comparator
A vacuum mass comparator at NMIJ [21] was used to determine the mass of the sphere including the surface layers. The mass of the platinum–iridium kilogram standards of NMIJ was used as the reference in the measurement. Before the mass measurement of the sphere, the mass of the standards was calibrated in the Extraordinary Calibrations conducted by BIPM [22]. The mass of the sphere in vacuum msphere was estimated to be 999.698 4595(59) g. Details of the uncertainty evaluation are provided in [21].
4.2. Surface mass
The mass of the surface layers under vacuum mSL is given by

where mOL, mCL and mCWL are the masses of the OL, CL and CWL, respectively. The masses were calculated from the thickness and density of each layer. The calculated masses are summarized in table 2 along with the density and thickness of each layer. The total mass of the surface layers was estimated to be 120.6(8.9) µg.
4.3. Si core mass
To determine the Si core mass, the mass of the surface layers was subtracted from the mass of the sphere. In addition, owing to point defects, there is a difference between the mass of a sphere having Si atoms occupying all the regular sites and the measured mass value. The mass of the Si core mcore to determine the Avogadro constant was therefore calculated using

where mdeficit is the effect of point defects (i.e. impurities and self-point defects in the crystal) on the core mass [8]. The value of mdeficit for AVO28-S5c was estimated to be 3.8(3.8) µg [8]. The values of mcore was determined to be 999.698 343(11) g with a relative standard uncertainty of 1.1 × 10⁻⁸.
5. Avogadro constant
5.1. Determination of the Avogadro constant by NMIJ in 2017
From the values of Vcore and mcore determined in this study, the density of the Si core was determined with a relative standard uncertainty of 2.3 × 10⁻⁸. By combining the density with the lattice constant a and the molar mass of silicon M of AVO28-S5c determined by IAC in 2015 [8], the Avogadro constant was determined to be

with a relative standard uncertainty of 2.4 × 10⁻⁸ using equation (2). Table 4 shows the uncertainty budget of the NA determination. The largest uncertainty source is the determination of the Si core volume. This determination of NA from the data measured by IAC in 2015 [8] and from the data measured by NMIJ in 2017 is referred to as 'NA determination by NMIJ in 2017' in this paper.
Table 4. Uncertainty budget of the determination of the Avogadro constant NA by NMIJ in 2017.
| Quantity | Value | Relative standard uncertainty in NA | Source |
|---|---|---|---|
| Vcore | 430.891 2905(87) cm3 | 2.0 × 10⁻⁸ | This work, [11] |
| a | 5.430 996 219(10) × 10−10 m | 5.5 × 10⁻⁹ | [8] |
| M | 27.976 970 09(15) g mol−1 | 5.4 × 10⁻⁹ | [8] |
| msphere | 999.698 4595(59) g | 5.9 × 10⁻⁹ | This work |
| mSL | 120.6(8.9) µg | 8.9 × 10⁻⁹ | This work, [11] |
| mdeficit | 3.8(3.8) µg | 3.8 × 10⁻⁹ | [8] |
| NA | 6.022 140 84(15) × 1023 mol−1 | 2.4 × 10⁻⁸ | |
5.2. Comparison with other results
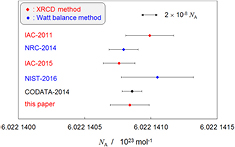
Figure 2 shows a comparison of the value of NA obtained in this work with those in our previous works [7, 8]. The bars on the data show the standard uncertainty. The NA values converted from the values of the Planck constant h determined by the watt (Kibble) balance experiments at the National Institute of Standards and Technologies of USA (NIST) [23] and the National Research Council of Canada (NRC) [24] are also shown. For the conversion, the molar Planck constant NAh = 3.990 312 7110(18) × 10−10 J s mol−1 in the CODATA adjustment in 2014 [5] was used. Because the relative standard uncertainty of NAh is as small as 4.5 × 10⁻¹⁰, the increase of the uncertainty of NA by the conversion is negligibly small. The value of NA determined in this work agrees with those in the previous works within their uncertainties.
Figure 2. Comparison of the values of NA using the XRCD method (IAC-2011 [7], IAC-2015 [8] and this paper) and the watt (Kibble) balance method (NIST-2016 [23] and NRC-2014 [24]). The recommended value by the CODATA adjustment in 2014 (CODATA-2014 [5]) is also shown. The bars on the data show the standard uncertainty.
Download figure:
Standard image High-resolution image
6. Correlation with the previous determinations of the Avogadro constant by the XRCD method
In 2011 and 2015, the IAC project reported the determinations of NA using the XRCD method [7, 8]. The correlation coefficient between the two NA determinations was estimated to make both NA values usable for the least-squares adjustment of the Planck constant by the CODATA adjustment in 2014 [9]. In this study, a new value of NA was determined on the basis of the measurement data obtained by NMIJ in 2017 and by IAC in 2015. To also make this new NA value usable for a future adjustment, the correlation coefficient with the values obtained in 2011 and 2015 are estimated in this paper in the manner described in [9].
6.1. Summary of the NA determinations in 2011 and 2015 by IAC
In 2011, the Avogadro constant was determined by measuring the lattice constant, molar mass, core volume and core mass of the two 28Si-enriched spheres named AVO28-S5 and AVO28-S8 [7]. The structure of the surface layers was investigated using various surface analysis techniques, and it was found that the spheres were covered with a thin layer contaminated with silicides of the metals Ni and Cu. This unexpected metallic contamination was one of the largest uncertainty sources in the determination of the Avogadro constant in 2011 [7]. To reduce the uncertainty contribution from this source, the metallic contamination was removed by Freckle™ etching after the 2011 NA determination [18]. However, the etching process degraded the shape of the spheres [25], and the spheres were therefore repolished to improve their sphericity. The measurements were repeated using the repolished spheres renamed AVO28-S5c and AVO28-S8c, and an NA value was published in 2015 [8].
In this study, a new value of NA was determined using AVO28-S5c. To simplify the analysis, we considered the correlations between the NA values obtained using AVO28-S5 and AVO28-S5c in the followings.
6.2. Mathematical model for the calculation of the correlation
The calculation of the correlation coefficient between the two NA determinations requires the correlation of each pair of input data: molar mass, lattice constant, core volume and core mass. To explain the estimation procedure of the correlation, let us consider the correlation between two output quantities obtained in 2015 and 2017, y2015 and y2017, as an example [9, 26]. The two output quantities are represented by


where f2015 and f2017 are the measurement functions in 2015 and in 2017, respectively, x1-2015 and x2-2015 are the input parameters for y2015, and x1-2017 and x2-2017 are the input parameters for y2017. The variance and covariance matrix associated with y, Uy,y, is represented by

where V(y2015) and V(y2017) are the variances of y2015 and y2017, respectively, and Cov(y2015,y2017) is the covariance between y2015 and y2017.
Uy,y, is given by

where Cx is the sensitivity matrix obtained by evaluating
and Ux,x is the variance and covariance matrix between the input parameters given by
The correlation coefficient between y2015 and y2017, Corr (y2015, y2017), is given by

In our previous paper [9], the relative variance and covariance matrix associated with y, Ur y,y, was used instead of Uy,y,
where Vr (y2015) and Vr (y2017) are the relative variances of y2015 and y2017, respectively, and Covr (y2015,y2017) is the relative covariance between y2015 and y2017. Equation (10) is therefore modified to

where
and
The correlation coefficient Corr (y2015, y2017) is calculated from the elements of Ur y,y as
7. Correlation with the NA determination by IAC in 2015
7.1. Lattice constant
For the NA determination by IAC in 2015, the lattice constant a of AVO28-S5c was determined at the Istituto Nazionale di Ricerca Metrologica of Italy (INRIM) using a combined x-ray and optical interferometer with a relative uncertainty of 1.8 × 10⁻⁹ [27], and the relative uncertainty contribution of a to the NA determination was 5.5 × 10⁻⁹. As described in section 5.1, the same value of a was used in the NA determination by NMIJ in 2017. The correlation coefficient between the uncertainty contribution of a to the NA determination in 2015 and that in 2017 was therefore estimated to be 1.
7.2. Molar mass
For the NA determination by IAC in 2015, the molar mass M of AVO28-S5c was measured independently by the Physikalisch–Technische Bundesanstalt of Germany (PTB), NIST and NMIJ using isotope dilution and multicollector inductively coupled plasma mass spectrometers [28–31]. The measured amount of substance of 30Si was confirmed by the measurement results with instrumental neutron activation analysis (INAA) by INRIM [32]. By combining these measurement data, the value of M for AVO28-S5c was determined with a relative uncertainty of 5.4 × 10⁻⁹ [8]. The relative uncertainty contribution of M to the NA determination was also 5.4 × 10⁻⁹. As described in section 5.1, the same value of M was used in the NA determination by NMIJ in 2017. The correlation coefficient between the uncertainty contribution of M to the NA determination in 2015 and that in 2017 was therefore estimated to be 1.
7.3. Si core volume
For the NA determination by IAC in 2015, the Vcore value of AVO28-S5c was determined independently by PTB and NMIJ. For the estimation of the correlation between the Vcore value obtained by IAC in 2015 VIAC-2015 and that by NMIJ in 2017 VNMIJ-2017, the correlations for the following three combinations were examined:
- 1.Corr (VNMIJ-2015, VNMIJ-2017),
- 2.Corr (VPTB-2015, VNMIJ-2017),
- 3.Corr (VNMIJ-2015, VPTB 2015),
where VNMIJ-2015 and VPTB-2015 are the Vcore values determined by NMIJ and PTB in 2015, respectively.
7.3.1. Correlation between VNMIJ-2015 and VNMIJ-2017.
Table 5 summarizes the relative contributions and correlations of the uncertainty sources to the Si core volume determinations of AVO28-S5c by NMIJ in 2015 and 2017. The uncertainty sources were composed of the interferogram analysis, the sphere temperature measurement, the diffraction effect and the standard deviation of the mean volume.
Table 5. Relative contributions and correlations of the uncertainty sources to the Si core volume determination of AVO28-S5c by NMIJ in 2015 and 2017.
| Uncertainty source | Relative contribution to uncertainty of VNMIJ-2015 |
Relative contribution to uncertainty of VNMIJ-2017 | Correlation |
|---|---|---|---|
| Interferogram analysis | 10.3 × 10⁻⁹ | 10.3 × 10⁻⁹ | 0 |
| Temperature | 4.8 × 10⁻⁹ | 4.8 × 10⁻⁹ | 0.21 |
| Diffraction effect | 16.0 × 10⁻⁹ | 16.0 × 10⁻⁹ | 0.25 |
| Surface | 2.5 × 10⁻⁹ | 2.7 × 10⁻⁹ | 0 |
| Standard deviation of the mean volume | 3.3 × 10⁻⁹ | 3.7 × 10⁻⁹ | 0 |
| Total | 20.1 × 10⁻⁹ | 20.1 × 10⁻⁹ | 0.17 |
aValues from [15].
In the interferogram analysis to determine the gaps and the etalon spacing by interferometry, a polynomial was fitted to the interferogram. The mean residual of the fitting was used as the uncertainty in the interferogram analysis [15]. Because this is a random uncertainty due to the noise in the interferogram, the uncertainty contributions from this source in 2015 and 2017 are not correlated.
The sphere temperature was measured by the same small PRTs installed in the interferometer in 2015 and 2017 [13, 15]. They were calibrated using the same temperature fixed-point cells before and after the measurements. The correlation between the temperature measurements in 2015 and 2017 arises from the uncertainty of the temperature fixed-point cells and the non-uniqueness of the PRTs. The total uncertainty and systematic uncertainty in the temperature measurements in 2015 and 2017 were estimated to be 0.62 mK and 0.28 mK, respectively [9]. The correlation of the uncertainty contributions of the sphere temperature measurements was estimated to be 0.21.
In the volume measurements by interferometry in 2015 and 2017, the directions of the diameter measurement were determined based on 145 directions distributed nearly uniformly on the sphere surface [11, 15]. In a set of the diameter measurement, the diameter was measured in the 145 directions, and the volume was determined from the average diameter. The set of the diameter measurement was repeated 10 times in 2015 and 15 times in 2017. Between each set, the sphere was oriented to distribute all the measurement directions as uniformly as possible. The standard deviation of the mean volume was used as an uncertainty source for the Si core volume measurement. This is a random uncertainty, and the uncertainty contributions from this source in 2015 and 2017 are therefore not correlated.
The largest uncertainty source in the volume measurements in 2015 and 2017 is the diffraction effect [8, 11, 15]. In the NMIJ interferometer, the beams reflected from the etalon and the sphere diverge differently and do not propagate along exactly on the same path. The effect of the difference in the Gouy phases of the two beams on the diameter measurement was estimated to be 0.65 nm by rigorous ray-tracing using the matrix method [13, 14]. The uncertainty of this correction was conservatively estimated to be 0.5 nm owing to the insufficient information to evaluate the uncertainty [13]. The relative uncertainty contribution of this correction to the Si core volume determination is 16.0 × 10⁻⁹ and is represented as 'Diffraction effect' in table 5. Though the uncertainty of the correction was estimated to be 0.1 nm by simulation [33], the simulation results have not been verified experimentally. We therefore cautiously assumed that the systematic fractions of the uncertainties of the diffraction effect in 2015 and 2017 have a uniform probability in the interval [0,1]. The expected values of systematic fractions are both 0.5, and the expected correlation coefficient is 0.25 as estimated in [9].
As to the surface characterizations, the determinations of the thicknesses of the CL and OL in 2015 are uncorrelated with those in 2017, because they were measured using different surface analysis techniques; in 2015, the CL thickness was determined by x-ray fluorescence analysis and the OL thickness was determined by spectroscopic ellipsometry [18], and in 2017, the thicknesses of the CL and OL were determined mainly by XPS at NMIJ independently as described in sections 4.1 and 4.2. On the other hand, the CWL thickness determinations in 2015 and 2017 are strongly correlated because the thicknesses were estimated from the same literature data [34] and the effects of the CWL on the Si core determinations were estimated using the same thickness and optical constants. However, the uncertainty contributions from the thickness and optical constants of the CWL to the Si core determination in 2017 are negligibly small as shown in table 3. The contributions to the Si core determination in 2015 were also negligibly small as shown in table 5 in [15]. Consequently, the correlation coefficient between the uncertainty contribution of the surface characterization to the Si core determination in 2015 and that in 2017 was estimated to be 0.
From the relative contributions and correlations of the uncertainty sources in table 5, the correlation coefficient between VNMIJ-2015 and VNMIJ-2017 was estimated to be 0.17.
7.3.2. Correlation between VPTB-2015 and VNMIJ-2017 and correlation between VPTB-2015 and VNMIJ-2015.
In the sphere volume measurement by PTB in 2015, an optical interferometer with a spherical etalon was used [8, 35]. The optical configuration and phase-shifting algorithm of the PTB interferometer were completely different from those of the NMIJ interferometer used in 2015 [8, 15] and 2017 [11]. The uncertainty contributions of the sphere volume measurements by the two interferometers are therefore uncorrelated.
In the surface characterization by PTB in 2015 and that by NMIJ in 2017, the determined CWL thicknesses are strongly correlated because the thicknesses were estimated using the same literature data [34]. In the surface characterizations by PTB and NMIJ in 2015, the determined thicknesses of the CWL and CL are strongly correlated because PTB and NMIJ used the same thicknesses of these layers to derive the Si core volumes [8]. However, the uncertainty contributions of the surface characterizations to the Si core volume determinations were significantly smaller than those of the volume measurements by interferometry [8, 11, 15]. Taking into account the correlations in the volume measurements by interferometry and the surface characterizations, the correlation coefficient between VPTB-2015 and VNMIJ-2017 and that between VPTB-2015 and VNMIJ-2015 were therefore estimated to be 0.
7.3.3. Correlation between VIAC-2015 and VNMIJ-2017.
Table 6 summarizes the relative uncertainties and correlations of the Si core volume determinations by PTB and NMIJ in 2015 and 2017.
Table 6. Correlations between the Si core volume measurements by PTB and NMIJ in 2015 and 2017.
| Institute, year | Relative uncertainty ur | Correlation coefficient | ||
|---|---|---|---|---|
| VNMIJ-2015 | VPTB-2015 | VNMIJ-2017 | ||
| VNMIJ-2015 | 20.1 × 10⁻⁹ | 1 | 0 | 0.17 |
| VPTB-2015 | 26.7 × 10⁻⁹ | 0 | 1 | 0 |
| VNMIJ-2017 | 20.1 × 10⁻⁹ | 0.17 | 0 | 1 |
The Si core volume obtained by IAC in 2015 VIAC-2015 was the weighted mean of VNMIJ-2015 and VPTB-2015. The weights of VNMIJ-2015 and VPTB-2015 in VIAC-2015 are (1/[ur(VNMIJ-2015)]2)/(1/[ur(VNMIJ-2015)]2 + 1/[ur(VPTB-2015)]2) = 0.64 and (1/[ur (VPTB-2015)]2)/(1/[ur(VNMIJ-2015)]2 + 1/[ur(VNMIJ-2015)]2) = 0.36, respectively. Equation (15) is therefore modified to
where
The correlation coefficient between the volume measurements by IAC in 2015 and by NMIJ in 2017 was estimated to be 0.14.
7.4. Si core mass
Table 7 shows the relative contributions and correlations of uncertainty sources to the Si core mass determinations of AVO28-S5c by IAC in 2015 and by NMIJ in 2017. The Si mass obtained by IAC in 2015 was the weighted mean of the values obtained by three laboratories, BIPM, PTB and NMIJ, in which the weight of NMIJ's result was 0.19 [8]. On the other hand, the Si mass obtained by NMIJ in 2017 was determined only by NMIJ.
Table 7. Relative contributions and correlations of the uncertainty sources to the Si core mass determinations of AVO28-S5c by IAC in 2015 and by NMIJ in 2017.
| Uncertainty source | Relative contribution to uncertainty of mcore by IAC in 2015 | Relative contribution to uncertainty of mcore by NMIJ in 2017 | Correlation |
|---|---|---|---|
| BIPM mass scale | 3.0 × 10⁻⁹ | 3.3 × 10⁻⁹ | 0.91 |
| Mass difference measurement | 1.8 × 10⁻⁹ | 4.9 × 10⁻⁹ | 0.04 |
| Surface layers mass | 10.0 × 10⁻⁹ | 8.9 × 10⁻⁹ | 0.18 |
| Point defect mass | 3.8 × 10⁻⁹ | 3.8 × 10⁻⁹ | 1 |
| Total | 11.3 × 10⁻⁹ | 11.3 × 10⁻⁹ | 0.32 |
The uncertainty sources of the mass measurements were composed of the BIPM mass scale, the mass difference measurement, the surface layers mass and the point defect mass. The mass measurement results obtained by IAC in 2015 and by NMIJ in 2017 were both traceable to the BIPM mass scale established at the Extraordinary Calibrations from 2013 to 2014 [36, 37], which provided us the newest linkage to the IPK. The uncertainty due to this BIPM mass scale was estimated to be 3.0 µg [9] and 3.3 µg for IAC's result in 2015 and NMIJ's result in 2017, respectively, and the common systematic uncertainty between them was estimated to be 3.0 µg. Consequently, the correlation coefficient was given by (3.0 µg)2/(3.0 µg × 3.3 µg) = 0.91.
The mass of the Si sphere including the surface layers was determined independently by the mass difference measurement by each laboratory by comparison with a reference weight traceable to the BIPM mass scale. The uncertainty due to this mass difference measurement was estimated to be 1.8 µg [8, 9] and 4.9 µg for IAC's result in 2015 and NMIJ's result in 2017, respectively, and the common systematic uncertainty between them was estimated to be 0.19 × 3.1 µg = 0.6 µg, where the value of 0.19 is the weight of NMIJ's result in IAC's result in 2015 and the value of 3.1 µg is the estimated common systematic uncertainty between NMIJ's result in 2015 and 2017. Consequently, the correlation coefficient for the mass difference measurement was estimated to be (0.6 µg)2/(1.8 µg × 4.9 µg) = 0.04.
The uncertainty due to the surface layers mass was estimated to be 10.0 µg [8, 9] and 8.9 µg for IAC's result in 2015 and NMIJ's result in 2017, respectively. The same values of the density of the OL and the mass of the CWL were used for IAC's result in 2015 and NMIJ's result in 2017, and the corresponding common systematic uncertainties were estimated to be 3.4 µg and 2.2 µg [9], respectively. Consequently, the correlation coefficient for the surface layers mass was estimated to be [(3.4 µg)2 + (2.2 µg)2]/[(10.0 µg × 8.9 µg] = 0.18.
The uncertainty due to the point defect mass was estimated to be 3.8 µg [8, 9] both for IAC's result in 2015 and NMIJ's result in 2017. Since the same value of the point defect mass was used for IAC's result in 2015 and NMIJ's result in 2017, the correlation coefficient between them was estimated to be 1.
In conclusion, the correlation coefficient between the Si mass determinations by IAC in 2015 and by NMIJ in 2017 was estimated to be 0.32.
7.5. Correlation between the NA determinations in 2015 and 2017
Table 8 summarizes the relative contributions and correlations of the uncertainty sources to the determination of NA by IAC in 2015 and that by NMIJ in 2017. The correlation coefficient between the NA determinations was estimated to be 0.28, indicating that the correlation is not particularly strong even though the same 28Si sphere was used for the NA determinations. This result is explained by the following considerations. Though the same values of M and a of AVO28-S5c were used for the NA determinations as described in sections 7.1 and 7.2, the uncertainty contributions from a and M are small compared with those of the Si core volume and mass as shown in table 8. In addition, the covariances between many of the large uncertainty sources in the determinations of the Si core volume and mass are relatively small as shown in tables 5 and 7. The correlations between the Si core volume and mass determinations in 2015 and 2017 are therefore not particularly strong. Consequently, the correlation coefficient between the NA determinations in 2015 and 2017 is relatively small.
Table 8. Relative contributions and correlations of the uncertainty sources to the NA determinations by IAC in 2015 and by NMIJ in 2017.
| Uncertainty source | Relative contribution to NA determination | Correlation | |
|---|---|---|---|
| NA by IAC in 2015 | NA by NMIJ in 2017 | ||
| Molar mass M | 5.4 × 10⁻⁹ | 5.4 × 10⁻⁹ | 1 |
| Lattice constant a | 5.5 × 10⁻⁹ | 5.5 × 10⁻⁹ | 1 |
| Si core volume Vcore | 16.0 × 10⁻⁹ | 20.2 × 10⁻⁹ | 0.14 |
| Si core mass mcore | 11.3 × 10⁻⁹ | 11.3 × 10⁻⁹ | 0.32 |
| Total | 21.0 × 10⁻⁹ | 24.4 × 10⁻⁹ | 0.28 |
8. Correlation with the NA determination by IAC in 2011
8.1. Lattice constant
The correlation between the uncertainty contributions of the lattice constant to the 2011 and 2015 NA determinations by IAC was examined thoroughly, and the correlation coefficient was estimated to be 0.15 in [9]. As described in section 5.1, the same lattice constant was used for the NA determinations by IAC in 2015 and by NMIJ in 2017. The correlation coefficient between the uncertainty contribution of the lattice constant to the NA determination in 2011 and that in 2017 was therefore also estimated to be 0.15.
8.2. Molar mass
The correlation between the uncertainty contributions of the molar mass to the 2011 and 2015 NA determinations was examined thoroughly, and the correlation coefficient was estimated to be 0 in [9]. As described in section 5.1, the same molar mass was used for the NA determinations by IAC in 2015 and by NMIJ in 2017. The correlation between the uncertainty contributions of the molar mass to the NA determinations in 2011 and 2017 was therefore also estimated to be 0.
8.3. Si core volume
In the 2011 NA determination, the Si core volume of AVO28-S5 was determined independently at NMIJ and PTB. To estimate the correlation between the uncertainty contributions of the Si core volume to the NA determinations in 2011 and 2017, the correlation coefficients of the following three combinations were estimated:
- 1.Corr (VNMIJ-2011, VNMIJ-2017),
- 2.Corr (VPTB-2011, VNMIJ-2017),
- 3.Corr (VNMIJ-2011, VPTB-2011),
where VNMIJ-2011 and VPTB-2011 are the Vcore values determined by NMIJ and PTB in 2011, respectively.
8.3.1. Correlation between VNMIJ-2011 and VNMIJ-2017.
Table 9 summarizes the relative contributions and correlations of the uncertainty sources to the Si core volume measurements by NMIJ in 2011 and 2017. The relative contributions of the uncertainty sources in the 2011 measurement are from [13]. Because the same optical interferometer was used for the Si core volume measurements in 2011 and 2015, the correlation coefficients between the uncertainty sources regarding the interferometric measurement in table 9 are the same as those between the Si core volume measurements in 2015 and 2017 listed in table 5.
Table 9. Relative contributions and correlations of the uncertainty sources in the determinations of the Si core volume by NMIJ for AVO28-S5 in 2011 and AVO28-S5c in 2017.
| Uncertainty source | Relative contribution to uncertainty of VNMIJ-2011 |
Relative contribution to uncertainty of VNMIJ-2017 | Correlation |
|---|---|---|---|
| Interferogram analysis | 36.3 × 10⁻⁹ | 10.3 × 10⁻⁹ | 0 |
| Temperature | 4.8 × 10⁻⁹ | 4.8 × 10⁻⁹ | 0.21 |
| Diffraction effect | 16.0 × 10⁻⁹ | 16.0 × 10⁻⁹ | 0.25 |
| Surface | 2.5 × 10⁻⁹ | 2.7 × 10⁻⁹ | 0 |
| Standard deviation of the mean volume | 29.7 × 10⁻⁹ | 3.3 × 10⁻⁹ | 0 |
| Total | 49.8 × 10⁻⁹ | 20.1 × 10⁻⁹ | 0.07 |
aValues from [13].
In the surface characterizations, the thickness determinations of the CL and OL in 2011 are uncorrelated with those in 2017 because they were measured using different surface analysis techniques [7, 11]. One of the dominant uncertainty sources in the 2011 surface characterization was the thickness determination of the metallic contamination layer [7]. Because this contamination layer was removed after the 2011 measurement [18], the contributions from this source are also uncorrelated. On the other hand, only the CWL thickness determinations are strongly correlated because the thicknesses were estimated from the same literature data [34], and the effects of the CWL on the Si core determinations in 2011 and 2017 were estimated using the same thickness and optical constants. However, the uncertainty contributions from the thickness and optical constants of the CWL to the Si core determination in 2017 are negligibly small as shown in table 3. The contributions to the Si core determination in 2011 were also negligibly small as shown in table 5 in [13]. Consequently, the correlation coefficient between the uncertainty contribution of the surface characterization to the Si core determination in 2011 and that in 2017 was therefore estimated to be 0.
From the uncertainties and correlations in table 9, the correlation coefficient between VNMIJ-2011 and VNMIJ-2017 was estimated to be 0.07.
8.3.2. Correlation between VPTB-2011 and VNMIJ-2017 and correlation between VPTB-2011 and VNMIJ-2011.
The optical configuration and phase-shifting algorithm of the PTB interferometer used in 2011 were completely different from those of the NMIJ interferometer used in 2011 and 2017 [7, 13, 35]. The measurements by the two interferometers are therefore uncorrelated.
In the surface characterizations by PTB in 2011 and by NMIJ in 2017, the CWL thickness determinations are strongly correlated because the same thickness of the CWL was used to derive the core volumes [7]. On the other hand, the thickness determination of the CWL and CL by PTB in 2011 is strongly correlated with that by NMIJ in 2011, because PTB and NMIJ used the same thicknesses of these layers to derive the Si core volumes [7]. However, the uncertainty contributions of the surface characterizations to the Si core volume were significantly smaller than those of the volume measurement by interferometry [7, 11]. Taking into account the correlations regarding the volume measurements by interferometry and the surface characterizations, the correlation coefficient between VPTB-2011 and VNMIJ-2017 and that between VPTB-2011 and VNMIJ-2011 were therefore estimated to be 0.
8.3.3. Correlation between VIAC-2011 and VNMIJ-2017.
Table 10 summarizes the correlations between the Si core volume determinations by PTB and NMIJ in 2011 and 2017. The weights of VNMIJ-2011 and VPTB-2011 in VIAC-2011 are (1/[ur(VNMIJ-2011)]2)/(1/[ur(VNMIJ-2011)]2 + 1/[ur(VPTB-2011)]2) = 0.35 and (1/[ur (VPTB-2011)]2)/(1/[ur(VNMIJ-2011)]2 + 1/[ur(VPTB-2011)]2) = 0.65, respectively. Taking these weights into account, the correlation coefficient between the volume measurements by IAC in 2011 and NMIJ in 2017 was estimated to be 0.04.
Table 10. Correlations between the Si core volume measurements by PTB and NMIJ in 2011 and 2017.
| Institute, year | Relative uncertainty | Correlation coefficient | ||
|---|---|---|---|---|
| VNMIJ-2011 | VPTB-2011 | VNMIJ-2017 | ||
| VNMIJ-2011 | 49.8 × 10⁻⁹ | 1 | 0 | 0.07 |
| VPTB-2011 | 36.6 × 10⁻⁹ | 0 | 1 | 0 |
| VNMIJ-2017 | 20.1 × 10⁻⁹ | 0.07 | 0 | 1 |
8.4. Si core mass
Table 11 shows the relative contributions and correlations of the uncertainty sources to the Si core mass determination of AVO28-S5 by IAC in 2011 and that of AVO28-S5c by NMIJ in 2017. The Si mass obtained by IAC in 2011 was the weighted mean of the values obtained by three laboratories, BIPM, PTB and NMIJ in 2011, in which the weight of NMIJ's result was 0.25 [7]. The mass measurement result by each laboratory was revised in 2015 on the basis of the Extraordinary Calibrations from 2013 to 2014 [36, 37]. On the other hand, the Si mass for the NA determination by NMIJ in 2017 was determined only by NMIJ.
Table 11. Relative contributions and correlations of the uncertainty sources to the Si core mass determination of AVO28-S5 by IAC-2011 and that of AVO28-S5c by NMIJ in 2017.
| Uncertainty source | Relative contribution to uncertainty of mcore by IAC in 2011 | Relative contribution to uncertainty of mcore by NMIJ in 2017 | Correlation |
|---|---|---|---|
| BIPM mass scale | 3.0 × 10⁻⁹ | 3.3 × 10⁻⁹ | 0.91 |
| Mass difference measurement | 1.8 × 10⁻⁹ | 4.9 × 10⁻⁹ | 0.07 |
| Surface layers mass | 14.5 × 10⁻⁹ | 8.9 × 10⁻⁹ | 0.13 |
| Point defect mass | 2.4 × 10⁻⁹ | 3.8 × 10⁻⁹ | 0.63 |
| Total | 15.1 × 10⁻⁹ | 11.3 × 10⁻⁹ | 0.19 |
The mass measurement results obtained by IAC in 2011 and by NMIJ in 2017 were both traceable to the BIPM mass scale established at the Extraordinary Calibrations from 2013 to 2014 [36, 37]. The uncertainty due to this BIPM mass scale was estimated to be 3.0 µg [9] and 3.3 µg for IAC's result in 2011 and NMIJ's result in 2017, respectively, and the common systematic uncertainty between them was estimated to be 3.0 µg. Consequently, the correlation coefficient was given by (3.0 µg)2/(3.0 µg × 3.3 µg) = 0.91.
The mass of the Si sphere including the surface layers was independently determined by the mass difference measurement by each laboratory by comparison with a reference weight traceable to the BIPM mass scale. The uncertainty due to this mass difference measurement was estimated to be 1.8 µg [9] and 4.9 µg for IAC's result in 2011 and NMIJ's result in 2017, respectively, and the common systematic uncertainty between them was estimated to be 0.25 × 3.1 µg = 0.8 µg, where the value of 0.25 is the weight of NMIJ's result in IAC's result in 2011 and the value of 3.1 µg is the estimated common systematic uncertainty between NMIJ's results in 2011 and 2017. Consequently, the correlation coefficient for the mass difference measurement was estimated to be (0.8 µg)2/(1.8 µg × 4.9 µg) = 0.07.
The uncertainty due to the surface layers mass was estimated to be 14.5 µg [7, 9] and 8.9 µg for IAC's result in 2011 and NMIJ's result in 2017, respectively. The same values of the density of the OL and the mass of the CWL were used for IAC's result in 2011 and NMIJ's result in 2017, and the corresponding common systematic uncertainties were estimated to be 3.4 µg and 2.2 µg [9], respectively. Consequently, the correlation coefficient for the surface layers mass was estimated to be [(3.4 µg)2 + (2.2 µg)2]/[(14.5 µg × 8.9 µg] = 0.13.
The uncertainty due to the point defect mass was estimated to be 2.4 µg [7, 9] and 3.8 µg for IAC's result in 2011 and NMIJ's result in 2017, respectively, and the common systematic uncertainty between them was estimated to be 2.4 µg. Consequently, the correlation coefficient was given by (2.4 µg)2/(2.4 µg × 3.3 µg) = 0.63.
In conclusion, the correlation coefficient between the Si mass determinations by IAC in 2011 and by NMIJ in 2017 was estimated to be 0.19.
8.5. Correlation between the NA determinations in 2011 and 2017
Table 12 summarizes the relative contributions and correlations of the uncertainty sources to the NA determinations by IAC in 2011 and by NMIJ in 2017. The correlation coefficient between the two NA determinations was estimated to be 0.07, which is smaller than that between the NA determinations in 2015 and 2017 given in table 8. This result is explained by the following considerations. One of the largest uncertainty sources in the NA determination in 2011 was the mass determination of the surface layers. Because of the metallic contamination layer, it was not possible to determine the mass of the surface layers accurately [7]. After the measurements in 2011, this contamination layer was removed [18]. Consequently, the correlation between the Si core mass measurements in 2011 and 2017 is smaller than that in 2015 and 2017 as shown in tables 8 and 12. In addition, the correlations between the values of a and M in 2011 and 2017 are also significantly small compared to that in 2015 and 2017 as described in sections 8.1 and 8.2. As to the determination of the Si core volume determinations, the correlation coefficient between the Si volume measurements in 2011 and 2017 is smaller than that in 2015 and 2017 as shown in tables 8 and 12 because the weight of VNMIJ-2011 in VIAC-2011 is smaller than that of VNMIJ-2015 in VIAC-2015. Consequently, the correlation coefficient between the NA determinations in 2011 and 2017 is smaller than that between the NA determinations in 2015 and 2017.
Table 12. Relative contributions and correlations of the uncertainty sources for the NA determinations by IAC in 2011 and by NMIJ in 2017.
| Uncertainty source | Relative contribution to NA determination | Correlation | |
|---|---|---|---|
| IAC in 2011 | NMIJ in 2017 | ||
| Molar mass M | 7.9 × 10⁻⁹ | 5.4 × 10⁻⁹ | 0 |
| Lattice constant a | 10.5 × 10⁻⁹ | 5.5 × 10⁻⁹ | 0.15 |
| Si core volume Vcore | 30.2 × 10⁻⁹ | 20.2 × 10⁻⁹ | 0.04 |
| Si core mass mcore | 15.1 × 10⁻⁹ | 11.3 × 10⁻⁹ | 0.19 |
| Total | 36.2 × 10⁻⁹ | 24.3 × 10⁻⁹ | 0.07 |
9. NA value based on the determinations in 2011, 2015 and 2017
Table 13 summarizes the values of NA determined by IAC in 2011 and 2015 [7, 8] and by NMIJ in this work. The correlation between the three NA determinations estimated in [9] and this work are also listed.
Table 13. Values of the Avogadro constant NA determined by IAC in 2011 and 2015 and by NMIJ in 2017.
| Institute, year | NA | Correlation coefficient | ||
|---|---|---|---|---|
| IAC, 2011 | IAC, 2015 | NMIJ, 2017 | ||
| IAC, 2011 | 6.022 140 99(18) × 1023 mol−1 |
1 | 0.17 | 0.07 |
| IAC, 2015 | 6.022 140 76(12) × 1023 mol−1 |
0.17 | 1 | 0.28 |
| NMIJ, 2017 | 6.022 140 84(15) × 1023 mol−1 |
0.07 | 0.28 | 1 |
aThe NA value in [7] is 6.022 140 82(18) × 1023 mol−1. This was updated on the basis of a correction due to the recalibration of the mass standards [36, 37]. Details of the correction are provided in [8]. bValue from table 14 in [8]. cThis work.
The NA values in 2011 and 2015 were determined from the measurement results for the two spheres: in 2011, the two spheres AVO28-S5 and AVO28-S8 [7] were used, and, in 2015, the repolished two spheres AVO28-S5c and AVO28-S8c were used [8]. In each NA determination, the same measurements were performed for the two spheres manufactured from the same 28Si-enriched crystal using the same polishing procedure. The uncertainties of the NA determinations for the two spheres were almost the same, and the NA value was determined as the weighted mean of the NA values of the two spheres. Though the NA value by NMIJ in 2017 obtained in this work was determined from the measurement results only for AVO28-S5c, the correlations estimated in this work can be therefore used to elucidate the correlations between the NA value determined in this work and those in the 2011 and 2015 determinations using the two spheres. Taking the correlations into account, the weighted mean of the three NA values in table 13 is

with a relative standard uncertainty of 1.6 × 10⁻⁸, and the Birge ratio is 0.83. Details of the procedure to estimate the weighted mean, the uncertainty and the Birge ratio are summarized in appendix E of [38].
To check the consistency between the NA values determined by AVO28-S5 and AVO28-S5c, the NA value determined using AVO28-S5c in this work was compared with those by AVO28-S5 in 2011 and AVO28-S5c in 2015. Table 14 shows the comparison of the three NA values. As shown in this table, the NA value determined in study shows good agreement with the other two NA values within their uncertainties.
Table 14. Values of the Avogadro constant NA determined using AVO28-S5 and AVO28-S5c.
| Institute, year, sphere | NA |
|---|---|
| IAC, 2011, AVO28-S5 | 6.022 141 12(21) × 1023 mol−1 |
| IAC, 2015, AVO28-S5c | 6.022 140 72(13) × 1023 mol−1 |
| NMIJ, 2017, AVO28-S5c | 6.022 140 84(15) × 1023 mol−1 |
aThe NA value in [7] is 6.022 140 95(21) × 1023 mol−1. This was updated on the basis of a correction due to the recalibration of the mass standards [36, 37]. Details of the correction are provided in [8]. bValue from table 14 in [8]. cThis work.
10. Correlation with the NA value using a new 28Si-enriched crystal
Recently, we have determined the NA value using a new 28Si-enriched crystal, Si28-23Pr11 [39]. Two 1 kg spheres, Si28kg01a and Si28kg01b, were manufactured from the new crystal at PTB and were used for the NA determination by the XRCD method. NMIJ determined the NA value using Si28kg01a with a relative uncertainty of 2.3 × 10⁻⁸. By combining this NA value with those determined by PTB using Si28kg01a and Si28kg01b, the NA value was finally determined with a relative uncertainty of 1.2 × 10⁻⁸ [39]. The correlation between the NA value determined in this work using AVO28-S5c and that by NMIJ using Si28kg01a was estimated to be 0.26 by using the same procedure described in section 6 of this paper. The correlation between the two NA values determined by PTB using Si28kg01a and Si28kg01b was estimated to be 0.5 [40]. The correlation between the NA value determined by NMIJ using Si28kg01a and those by PTB using Si28kg01a and Si28kg01b was estimated to be 0.13. The correlations between the NA value determined by NMIJ using AVO28-S5c and those by PTB using Si28kg01a and Si28kg01b was estimated to be 0.12. The estimated correlation coefficients are summarized in table 15. Taking into account the correlations, the correlation between the NA values determined by NMIJ using AVO28-S5c in this work and that by PTB and NMIJ using Si28kg01a and Si28kg01b was estimated to be 0.21.
Table 15. Correlations between the NA determinations by PTB and NMIJ using AVO28 and Si28-23Pr11 in 2017.
| Institute, sphere | Crystal | Correlation coefficient | |||
|---|---|---|---|---|---|
| NMIJ, AVO28-S5c | NMIJ, Si28kg01a | PTB, Si28kg01a | PTB, Si28kg01b | ||
| NMIJ, AVO28-S5c | AVO28 | 1 | 0.26 | 0.12 | 0.12 |
| NMIJ, Si28kg01a | Si28-23Pr11 | 0.26 | 1 | 0.13 | 0.13 |
| PTB, Si28kg01a | Si28-23Pr11 | 0.12 | 0.13 | 1 | 0.5 |
| PTB, Si28kg01b | Si28-23Pr11 | 0.12 | 0.13 | 0.5 | 1 |
11. Conclusion
To obtain a new value of the Avogadro constant NA, the mass and volume of a 1 kg 28Si-enriched sphere were determined by a vacuum mass comparator and an optical interferometer, respectively. The sphere surface was characterized by x-ray photoelectron spectroscopy and spectroscopic ellipsometry to derive the mass and volume of the Si core excluding the surface layers. From the mass and volume, the density of the Si core was determined with a relative standard uncertainty of 2.3 × 10⁻⁸. By combining the density with the lattice constant and the molar mass of the sphere reported by the IAC project in 2015, a value of 6.022 140 84(15) × 1023 mol−1 was obtained for NA with a relative standard uncertainty of 2.4 × 10⁻⁸. The new NA value agrees with those determined in our previous works [7, 8] within their uncertainties. The correlation coefficients of the new NA value with the NA values determined by IAC in 2011 and 2015 were estimated to be 0.07 and 0.28, respectively. The correlation coefficient of the new NA value with the NA value determined by IAC in 2017 using a new different 28Si-enriched crystal [39] was estimated to be 0.21.
Acknowledgment
This work was supported in part by the Grant-in-Aid for Scientific Research (B) (KAKENHI 16H03901) from the Japan Society for the Promotion of Science.