

Abstract
A new single crystal from isotopically enriched silicon was used to determine the Avogadro constant NA by the x-ray-crystal density method. The new crystal, named Si28-23Pr11, has a higher enrichment than the former 'AVO28' crystal allowing a smaller uncertainty of the molar mass determination. Again, two 1 kg spheres were manufactured from this crystal. The crystal and the spheres were measured with improved and new methods. One sphere, Si28kg01a, was measured at NMIJ and PTB with very consistent results. The other sphere, Si28kg01b, was measured only at PTB and yielded nearly the same Avogadro constant value. The mean result for both 1 kg spheres is NA = 6.022 140 526(70) × 1023 mol−1 with a relative standard uncertainty of 1.2 × 10⁻⁸. This value deviates from the Avogadro value published in 2015 for the AVO28 crystal by about 3.9(2.1) × 10−8. Possible reasons for this difference are discussed and additional measurements are proposed.
Export citation and abstract BibTeX RIS

Original content from this work may be used under the terms of the Creative Commons Attribution 3.0 licence. Any further distribution of this work must maintain attribution to the author(s) and the title of the work, journal citation and DOI.
List of acronyms and abbreviation
| ANSTO | Australian Nuclear Science and Technology Organisation |
| CGPM | General Conference for Weights and Measures |
| CIPM | International Conference on Weights and Measures |
| CL | Carbonaceous contamination layer |
| CWL | Chemisorbed water layer |
| DLTS | Deep level transient spectroscopy |
| FTIR | Fourier transform infrared spectroscopy |
| HR-MC-ICP-MS | High resolution multicollector inductively coupled plasma mass spectrometer |
| IAC | International Avogadro coordination |
| IChHPS RAS | G G Devyatykh Institute of Chemistry of High-Purity Substances of the Russian Academy of Sciences |
| IHEP | Institute of High Energy Physics (People's Republic of China) |
| IDMS | Isotope dilution mass spectrometry |
| IKZ | Leibniz Institute for Crystal Growth (Leibniz-Institut für Kristallzüchtung, Germany) |
| INAA | Instrumental neutron activation analysis |
| INRIM | Istituto Nazionale di Ricerca Metrologica (Italy) |
| KEK | High Energy Accelerator Research Organization, Japan |
| MC-ICP-MS | Multicollector inductively coupled plasma mass spectrometer |
| MDCM | Monolithic double channel-cut monochromator |
| ML | Metallic Na layer |
| NIM | National Institute of Metrology (People's Republic of China) |
| NRC | National Research Council Canada |
| NIST | National Institute of Standards and Technology (USA) |
| NMIJ | National Metrology Institute of Japan |
| OL | Oxide layer |
| PF | Photon Factory of the High Energy Accelerator Research Organization (Japan) |
| PALS | Positron annihilation lifetime spectroscopy |
| PRT | Platinum resistance thermometer |
| PTB | Physikalisch-Technische Bundesanstalt (Germany) |
| PWL | Physisorbed water layer |
| SE | Spectral ellipsometry |
| SRLC | Self-referenced lattice comparator |
| SL | Surface layer |
| SPRT | Standard platinum resistance thermometer |
| SC 'PA ECP' | Stock Company 'Production Association Electrochemical Plant' |
| TMAH | Tetramethylammonium hydroxide |
| UTC | Coordinated universal time |
| XINT | X-ray interferometer of the AVO28 crystal |
| XPS | X-ray photoelectron spectroscopy |
| XRCD | X-ray-crystal density (method) |
| XRF | X-ray fluorescence analysis |
| XRR | X-ray reflectometry |
| XROI | Combined x-ray and optical interferometry |
1. Introduction
The International Conference on Weights and Measures (CIPM) plans to propose in autumn 2017 new definitions of four SI units, namely kilogram, ampere, kelvin and mole, to the General Conference for Weights and Measures (CGPM) [1]. The x-ray-crystal density (XRCD) method or 'atom counting' method [2] developed in its present experimental design by the International Avogadro Coordination (IAC) will be one of two accepted methods of highest accuracy listed in the mise en pratique of the kilogram [3]. The definition of the kilogram will be based on a fixed numerical value of the Planck constant h [4]. Although the XRCD method primarily determines the Avogadro constant NA, i. e. the number of entities in one mole of amount of substance, the well-known molar Planck constant NAh can be used to calculate the Planck constant with negligible loss of accuracy. The CODATA 2014 adjustment yielded a value of the molar Planck constant NAh = 3.990 312 7110(18) × 10−10 J s mol−1, with a relative uncertainty of 4.5 × 10⁻¹⁰ [5].
The first 5 kg 28Si single crystal Si28-10-Pr11 (short name: 'AVO28') was produced for the IAC in the years 2004 to 2007. In 2011 and 2015 results for the Avogadro constant with relative standard uncertainties of 3.0 × 10⁻⁸ and 2.0 × 10⁻⁸, respectively, were derived and published [6, 7].
In 2012 the PTB started a new project named kg-2 [8] for the production of two additional 5 kg 28Si crystals. The isotopic enrichment was this time performed at the Stock Company 'Production Association Electrochemical Plant' (SC 'PA ECP') in Zelenogorsk (near Krasnoyarsk, Russia). At the G G Devyatykh Institute of Chemistry of High-Purity Substances of the Russian Academy of Sciences (IChHPS RAS) in Nizhny Novgorod, Russia, the enriched 28SiF4 was transformed to silane, SiH4, and then purified, and eventually the silicon was deposited as polycrystalline material. The Leibniz Institute for Crystal Growth (Leibniz-Institut für Kristallzüchtung, IKZ) in Berlin, Germany, purified the polycrystal by multiple float-zone crystallizations and grew the single crystal.
The first new 28Si single crystal became available to PTB in 2015, named Si28-23Pr11, see figure 1. Its enrichment is about 99.9985 %, higher than the 99.9956 % enrichment of the AVO28 crystal. Two spheres, Si28kg01a and Si28kg01b, were manufactured at PTB from the new crystal for the determination of the crystal density and—after redefinition of the kilogram—for the realization of the kilogram. The new spheres deviate from perfect roundness only by 29 nm and 42 nm, respectively, and show no detectable metallic contamination on the surface. Additionally, a lot of smaller samples have been prepared for the determination of the crystal properties (see figure 1).

Figure 1. The new float-zone 28Si crystal Si28-23Pr11 and its cutting scheme. The isotopic enrichment is about 0.999 985. To determine density, two spheres (Si28kg01a and Si28kg01b) were manufactured from parts P and S. From the parts L, N, Q, U, and V small samples were prepared for the determination of other crystal properties. The parts U and V contain some cracks (thin irregular lines). No cracks were detected in the parts K to T.
Download figure:
Standard image High-resolution image2. Determination of the crystal properties
The basic equation of the XRCD method [2, 7] for the Avogadro constant is

with molar mass M, lattice parameter a of the silicon lattice and density ρ = m/V of the crystal. n = 8 is the number of atoms in one unit cell. The density ρ = m/V is determined by measuring the mass m and the volume V of two 1 kg spheres. The quantity N = 8V/a3 is the number of atoms in the volume V ('atom counting' method).
The molar mass is measured by a dedicated mass spectrometric method, see section 2.2.1. The amount of the 30Si isotope in the crystal is additionally measured by a neutron activation analysis (section 2.2.2).
The lattice spacing of the AVO28, which was measured by the combined x-ray and optical interferometry, is re-evaluated (section 2.3.1). The lattice parameter of the new crystal can be calculated from the value for the AVO28 crystal and then taking into account the differences in the point defect concentrations and a small effect from the difference in the isotopic compositions (section 2.3.2). More directly, the lattice spacings of the AVO28 and the Si28-23Pr11 are linked by the self-referenced lattice comparator, see section 2.3.3.
The volumes a3 and V have the same temperature dependence. Both quantities are determined in different laboratories at 20 °C using standard platinum resistance thermometers (SPRTs) calibrated traceable to the International Temperature Scale ITS-90. For the determination of N and NA only the difference in the temperature scales of the laboratories near 20 °C is crucial (i.e. that both values are referenced to the same 20 °C temperature). This consistency was checked in temperature comparisons, giving an agreement of some few 10 µK. From this an uncertainty of the temperature dependence of the volume ratio of 2.4 × 10⁻¹⁰ could be derived.
Since the single crystals used to determine the Avogadro constant still contain a few point defects, i.e. vacancies or chemical impurities, corrections have to be made to equation (1). The point defects slightly change the mean distance of the atoms in the crystal (see section 2.3). This effect cancels out for the determination of the Avogadro constant using a sphere, since it changes the volume of the sphere in the same way. Thus, only the mass change of the sphere by the point defects has to be taken into account, see section 2.6.3.
Additionally, the mass of the surface layers on the sphere has to be subtracted from the total mass of the sphere in order to determine the mass of the silicon 'core', see section 2.4. The surface layers have also a small influence on the interferometric diameter measurements of the core, see section 2.5.
Whereas the density of the crystal is determined with the spheres, the molar mass and the point defect concentrations are measured using small samples distributed over the whole crystal, thus allowing to determine the molar mass and point defect concentrations in the sphere by interpolation (see sections 2.1 and 2.2, respectively).
Section 3 calculates the Avogadro constant values for both spheres. Section 4 compares the value of the Avogadro constant reported here to previously reported values, and suggests a programme for additional measurements.
2.1. Point defects
The impurity concentrations Ni of substitutional carbon, interstitial oxygen as well as the shallow impurities boron and phosphorus were measured by low-temperature Fourier transform infrared spectroscopy (FTIR) at PTB and are summarized in table 1. A detailed description of the method can be found elsewhere [9]. A total number of 27 silicon samples from different axial and radial positions along the crystal axis were used to determine the impurity distribution within the silicon crystal (see table 1 and blue squares in figure 1). The front-end of the crystal from 76 mm to 223 mm shows carbon contaminations clearly below 2 × 1015 cm−3, thus indicating a very high purity of the crystal Si28-23Pr11. In addition, the impurity concentration of oxygen, boron and phosphorus in this region are approximately between 10 and 100 times lower than the carbon concentration. While the oxygen and boron concentration remain nearly constant along the crystal axis, the concentrations of carbon and phosphorus gradually increase due to the segregation effect during floating-zone purification toward the back-end of the crystal, up to ~5 × 1015 cm−3 for carbon and ~0.03 × 1015 cm−3 for phosphorus. Because of nitrogen doping during the growth of the single crystal, an increased nitrogen content to a value of 1.1(8) × 1014 cm−3 occurs at the end of the crystal. Other shallow impurities such as Al, As, Sb and Ga were not found in the far-infrared spectrum, since their concentrations are below the detection limit of FTIR spectroscopy, i. e. below ~1 × 1013 cm−3.
Table 1. Impurity contents of carbon, oxygen, boron and phosphorus (NC, NO, NB, and NP, respectively) in the 28Si crystal Si28-23Pr11 measured at PTB by Fourier transform infrared spectroscopy.
| Sample SIS-code | Axial distance from seed (mm) | Radial distance from centre (mm) | NC 1015 cm−3 | NO 1015 cm−3 | NB 1015 cm−3 | NP 1015 cm−3 |
|---|---|---|---|---|---|---|
| L.2 | 76.8 | 13.7 | 0.82(14) | 0.08(4) | 0.009 79(72) | 0.003 49(34) |
| N.3.1 | 118.2 | 7.0 | 0.37(14) | 0.06(3) | 0.003 34(88) | 0.003 84(51) |
| N.3.2 | 118.2 | 17.0 | 0.65(16) | 0.09(3) | 0.004 43(174) | 0.007 10(101) |
| N.3.3 | 118.2 | 24.6 | 0.43(11) | <0.06 | 0.003 41(88) | 0.006 59(57) |
| N.3.4 | 118.2 | 32.3 | 0.51(13) | 0.12(3) | 0.003 42(87) | 0.005 63(55) |
| Q.3.3.2 | 223.7 | 35.3 | 1.53(13) | 0.16(4) | 0.001 65(96) | 0.019 78(111) |
| Q.3.3.1 | 223.7 | 43.4 | 0.92(11) | 0.16(4) | 0.002 84(92) | 0.017 67(101) |
| Q.1.3.2.4 | 225.0 | 4.2 | 1.11(10) | 0.16(4) | 0.002 99(18) | 0.019 74(98) |
| Q.1.3.3.1 | 225.0 | 12.7 | 1.99(15) | 0.16(4) | 0.002 85(17) | 0.018 79(94) |
| Q.1.3.3.2 | 225.0 | 17.4 | 2.59(17) | 0.16(4) | 0.003 14(27) | 0.025 67(128) |
| Q.1.3.3.3 | 225.0 | 23.9 | 2.20(16) | <0.06 | 0.003 29(21) | 0.022 01(110) |
| Q.1.3.2.1 | 225.0 | 27.8 | 1.45(12) | 0.08(4) | 0.003 00(22) | 0.021 64(108) |
| Q.4.2.1 | 253.4 | 36.6 | 1.12(12) | 0.17(4) | 0.002 70(21) | 0.020 60(103) |
| Q.4.2.2 | 253.4 | 43.6 | 1.05(13) | 0.14(4) | 0.003 30(20) | 0.017 64(88) |
| S.1.1.1 | 256.8 | 30.3 | 1.17(13) | 0.18(4) | 0.002 55(29) | 0.016 66(83) |
| S.1.1.2 | 256.8 | 38.4 | 1.10(16) | 0.22(5) | 0.003 30(36) | 0.018 31(93) |
| S.1.1.3 | 256.8 | 46.1 | 1.65(15) | 0.17(5) | 0.002 55(17) | 0.023 31(116) |
| S.3.3.1 | 347.7 | 41.2 | 1.91(21) | 0.26(5) | 0.003 60(26) | 0.017 98(89) |
| S.3.2.1 | 351.5 | 41.2 | 1.64(13) | 0.23(4) | 0.003 00(19) | 0.019 29(96) |
| S.3.1.1 | 355.3 | 32.6 | 1.84(17) | 0.22(4) | 0.003 15(19) | 0.019 13(96) |
| S.3.1.2 | 355.3 | 40.3 | 2.02(16) | 0.24(4) | 0.003 45(20) | 0.019 45(97) |
| U.2.1 | 360.6 | 5.3 | 4.52(28) | 0.21(4) | 0.005 92(93) | 0.028 15(148) |
| U.2.2 | 360.6 | 11.7 | 5.35(33) | 0.23(4) | 0.006 99(95) | 0.030 22(158) |
| U.2.3 | 360.6 | 19.0 | 3.57(27) | 0.24(4) | 0.006 86(95) | 0.025 82(137) |
| U.2.4 | 360.6 | 27.0 | 3.02(21) | 0.19(4) | 0.005 02(91) | 0.023 87(128) |
| U.2.5 | 360.6 | 34.5 | 2.14(18) | 0.22(4) | 0.004 11(90) | 0.022 61(122) |
| V.4 | 364.6 | 33.3 | 2.32(16) | 0.23(9) | 0.004 14(46) | 0.021 59(110) |
The contamination by hydrogen was studied with deep level transient spectroscopy (DLTS); no hydrogen was found, to within the 5 × 1011 cm−3 detection limit [10].
As a prove of the purity, a large number of elements was investigated by instrumental neutron activation analysis (INAA) using a method previously developed and applied to a 28Si-enriched silicon material [11]. The neutron irradiation and γ-spectrometric measurements were performed at the OPAL reactor of the Australian Nuclear Science and Technology Organisation. The analysis quantified nine elements: the Cu concentration was 1.52(27) × 1013 cm−3 while the concentrations of Cr, Co, Ga, As, Br, La, W and Au were between 5.22(32) × 1010 cm−3 (W value) and 2.14(27) × 108 cm−3 (Au value). The corresponding overall concentration is 1.53(27) × 1013 cm−3 and the total overall mass fraction is 0.70(12) ng g−1. Detection limits of an additional 52 elements detectable by INAA were established within the range 1.3 × 1015 cm−3 (Ti value) and 3.3 × 106 cm−3 (Ir value); Sb is included, with a detection limit of 7.2 × 108 cm−3 [12].
Investigations with laser scattering tomography (LST) proved the absence of voids larger than the 30 nm detection limit [13] in the Si28-23Pr11 crystal.
The vacancy content in the AVO28 crystal was measured by means of positron annihilation lifetime spectroscopy (PALS), the result being Nvac = 3.3(1.1) × 1014 cm−3 [6]. Provisionally the same value is used for Si28-23Pr11.
The measurement of an upper limit to the number concentration of vacancies, Cvac, trapped into voids is planned by using a method based on Cu decoration and neutron activation. The method was formerly applied to a 5 cm long and 1 cm thick rectangular parallelepiped sample of natural silicon and a 1 × 1014 cm−3 upper limit of Cvac was established [14].
2.2. Molar mass
2.2.1. Molar mass determination by mass spectrometry.
The molar mass and isotopic composition of the new silicon crystal (Si28-23Pr11), which is more highly enriched in 28Si, has been determined by PTB and NMIJ as a function of the location of the sample in the original crystal. A detailed report of the procedures and results is given in [15, 16]. Here, only a brief description is presented.
A modified isotope dilution mass spectrometry (IDMS) method focusing on the isotopes 29Si and 30Si (virtual element, VE) only, was combined using isotope ratio mass spectrometry: a high resolution multicollector inductively coupled plasma mass spectrometer (HR-MC-ICP-MS) aided with a further improved experimental principle for the determination of calibration factors (K) to correct for mass bias [15, 17]. In the VE principle, mainly the ratios 30Si/29Si are measured in the enriched Si sample and a blend consisting of this sample and silicon material highly enriched in 30Si (spike). In this way, measurements of ratios related to 28Si (with an extreme enrichment) can be avoided and thus the uncertainty reduced. Isotope ratios are converted to amount-of-substance fractions x(iSi) which yield the molar mass M(Si) of the material using
with the respective molar masses M(iSi) of the ith isotope [18]. This method has been applied to similar crystal samples of the first 'AVO28' crystal Si28-10Pr11 also by the National Research Council Canada (NRC), the National Metrology Institute of Japan (NMIJ), the National Institute of Standards and Technology (NIST, USA) and the National Institute of Metrology (NIM, People's Republic of China) [19–22].
In order to get information about possible variations of M(Si), 10 samples from three axial locations (Parts N, Q, V of crystal Si28-23Pr11, see pink squares in figure 1) bracketing the locations of the two spheres (Si28kg01a and Si28kg01b of parts P and S, respectively) were used for measurements. In each main part, adjacent samples (approx. 500 mg each) were cut in radial orientations from the center to the outer part of the crystal.
After sample cleaning, etching and dissolution/dilution in aqueous tetramethylammonium hydroxide (TMAH), the samples were measured in a bracketing mode with the corresponding blanks matched in their TMAH concentrations to the sample solutions using a Neptune™ (Thermo Fisher Scientifc) MC-ICP-MS. This allows for a quantitative correction of natural silicon appearing in the solutions.
The sample V.5.3 was also measured, but due to contamination it was not considered in the data evaluation. All samples were prepared and measured by PTB. After the mass spectrometric measurements at PTB, the remaining amounts of solutions of samples N.2.2, N.2.3, Q.3.2.1, and V.5.2 were shipped to and measured by NMIJ. Table 2 contains the molar mass results of combined PTB and NMIJ measurements, separated for each sphere, indicating the exact position in the original crystal ingot.
Table 2. Molar mass of Si28-23Pr11 measured by the national metrology institutes (NMIs) PTB and NMIJ.
| Sample | NMI | Axial position (mm) | Radial position (mm) | M (g mol−1) |
|---|---|---|---|---|
| N.2.2 | PTB, NMIJ | 188.2 | 11.0 | 27.976 942 738(44) |
| N.2.3 | PTB, NMIJ | 188.2 | 17.9 | 27.976 942 682(39) |
| N.2.4 | PTB | 188.2 | 24.9 | 27.976 942 739(57) |
| Q.1.3.1.2 | PTB | 295.2 | 20.3 | 27.976 942 682(35) |
| Q.1.3.1.3 | PTB | 295.2 | 12.3 | 27.976 942 610(38) |
| Q.3.2.1 | PTB, NMIJ | 296.6 | 43.3 | 27.976 942 653(35) |
| Q.3.2.2 | PTB | 296.6 | 35.3 | 27.976 942 613(33) |
| Arithmetic mean Si28kg01a | 27.976 942 674(41) | |||
| Q.1.3.1.2 | PTB | 295.2 | 20.3 | 27.976 942 682(35) |
| Q.1.3.1.3 | PTB | 295.2 | 12.3 | 27.976 942 610(38) |
| Q.3.2.1 | PTB, NMIJ | 296.6 | 43.3 | 27.976 942 653(35) |
| Q.3.2.2 | PTB | 296.6 | 35.3 | 27.976 942 613(33) |
| V.5.2 | PTB, NMIJ | 433.1 | 15.0 | 27.976 942 698(41) |
| V.5.4 | PTB | 433.1 | 25.1 | 27.976 942 659(38) |
| V.5.5 | PTB | 433.1 | 32.4 | 27.976 942 590(35) |
| Arithmetic mean Si28kg01b | 27.976 942 644(37) | |||
The results from PTB and NMIJ agree very well and no significant variation in the molar mass has been detected. Thus, the molar mass distribution in the Si28-23Pr11 crystal can be treated as homogeneous within the limits of uncertainty.
2.2.2. Neutron activation analysis.
The amount of 30Si isotope was also quantified by instrumental neutron activation analysis (INAA) using a method based on the production of the 31Si radioisotope via neutron capture reaction 30Si(n,γ)31Si [23] using the sample Q.4.1 (see green circle in figure 1). The result, x(30Si) = 0.000 000 5701(88) mol mol−1 (standard uncertainty in parenthesis applies to the last digits) [24] is close to the result obtained by PTB with IDMS x(30Si) = 0.000 000 5984(34) mol mol−1 for the samples from the same part 'Q' of the crystal Si28-23Pr11 [16]. The difference in these x(30Si) values corresponds to a maximal difference in molar mass of 2 × 10⁻⁹ M.
2.3. Lattice parameter
2.3.1. Lattice parameter measurements at INRIM.
The INRIM measured the spacing of the {2 2 0} lattice planes of a highly pure and enriched 28Si crystal by combined x-ray and optical interferometry [25, 26]. From this measurement, the lattice parameter a and the unit cell volume a3 are obtained by geometrical relationships. The measurement apparatus and procedure are described in [25, 26]; here we provide only a short summary.
As shown in figure 2, a triple Laue interferometer consists of three Si crystal blades so cut that the {2 2 0} planes are orthogonal to the blade surfaces. X-rays, from a 17 keV Mo Kα source, are split by the lattices of the first two crystals (splitter and mirror) and recombined by the third, called the analyzer. When the analyzer is moved in a direction orthogonal to the {2 2 0} planes, a periodic variation of the intensity of the transmitted and diffracted beams is observed, the period being the diffracting plane spacing. The front-surface of the analyzer is a mirror, which is parallel to the {2 2 0} planes. In this way the analyzer displacements and rotations can be measured by optical interferometry. The measurement equation is d220 = mλ/(2n), where d220 ≈ 192 pm is the lattice spacing and n is the number of x-ray fringes observed in a displacement of m optical fringes having period λ/2 ≈ 266 nm. To ensure calibration, the interferometer light-source—a Nd-YAG laser—operates in single-mode and its frequency is stabilized against a transition of the 127I2 molecule. To eliminate the influence of the refractive index of air and to achieve 1 mK temperature uniformity and stability, the experiment is carried out in a thermo-vacuum chamber.
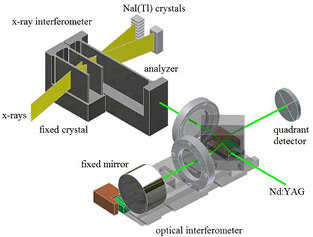
Figure 2. Sketch of a combined x-ray and optical interferometer.
Download figure:
Standard image High-resolution imageThe first d220 measurement was completed in 2011 [25]; it was repeated with an improved apparatus in 2015 [26, 27]. The point defect concentrations in the interferometer crystal used for these measurements are given in [9]. From these data, the lattice parameter of any highly pure, enriched, and perfect 28Si monocrystal can be obtained by extrapolation, by taking the different concentrations of point defects into account.
We assumed that—apart from the strain due to the different concentrations of point defects—the x-ray interferometer has the same lattice parameter as a 28Si sphere. However, this might not be the case because of stresses due to surface relaxation and reconstruction and the presence of amorphous or oxide layers. This problem was investigated by density functional theory calculations [28, 29]. For spheres having about 93.7 mm diameter, the lattice parameter change due to the surface stress was predicted to be irrelevant. However, the density functional theory predicted a significant bulk-strain of the x-ray interferometer blades, which are only 1 mm thick.
In order to carry out experimental checks, the INRIM and PTB designed and manufactured a two-thickness x-ray interferometer, where the surface stress will make different the d220 values of the thick and thin interferometer-parts [30]. Lattice strain measurements were carried out at the INRIM, by combined x-ray and optical interferometry, and at the Photon Factory (PF) of the High Energy Accelerator Research Organization (KEK, Japan), by using a self-referenced lattice comparator. The results evidenced clues of a compressive strain, but it was only possible to fix the 2.5 nm m−1 upper bound to the relevant correction. By assuming a uniform distribution, the mean correction and standard deviation are 1.25 nm m−1 and 0.72 nm m−1 [31].
As regards the diffraction of the laser beam, the relative difference of the fringe period from the plane wave wavelength is half the second moment about the beam axis of the angular power-spectrum of the complex amplitude.
The INRIM's measurements of the lattice parameter were corrected for the diffraction of the laser beam [25, 26]. Recently, a joint INRIM and PTB investigation revealed an error [32]. Specifically, the corrections, which are proportional to the central second moment of the angular power-spectrum, were calculated as relevant to the bivariate Gaussian-beams that most closely approach the spectra imaged in the focal plane of a converging lens. However, small spectrum components at relatively large angles went unnoticed, but they had a significant effect on the second moment. All the archived images were reexamined and the diffraction of the laser beam was re-evaluated.
The recalculated lattice spacing values of the XINT sample of the AVO28 crystal, published in 2011 and 2015, at 20.000 °C and 0 Pa, are

and

where no correction for the strain due to the point defect concentrations given in [9] has been applied. All temperatures stated in this paper are in terms of the ITS-90 scale.
The lattice parameter measurement of the XINT sample of the AVO28 crystal has been estimated by taking into account the last two corrected measurements. The weighted mean is used with a weak correlation between the two results of about 15 % [27]. The generalized weighted mean of the two values is

measured at a distance of 306 mm from the seed crystal, t90 = 20 °C, and p = 0 Pa.
2.3.2. Point defect and isotopic corrections of the lattice parameter.
The relative difference of the lattice spacing d of two samples 1 and 2 from the same 28Si crystal is calculated by taking into account the differences in the point defect concentrations:
In equation (4), βi is the lattice strain coefficient and Ni the concentration of the point defect 'i'.
The measured strain coefficients βi [33] are −6.9(5) × 10−24 cm3 for carbon, +4.4(2) × 10−24 cm3 for oxygen [34], −5.6(2) × 10−24 cm3 for boron, −1.3(2) × 10−24 cm3 for phosphorus, +5.7(1.0) × 10−24 cm3 for nitrogen, and +1.7(5) × 10−24 cm3 for vacancies [35]. The point-defect concentrations and concentration differences necessary to extrapolate the mean lattice parameter of the spheres from that of the x-ray interferometer (of crystal AVO28) and to correct the sphere mass were obtained by polynomial interpolations; they are summarized in table 3.
Table 3. (a) Point defect concentrations in samples from the Si28-23Pr11 crystal derived from polynomial interpolations of the values listed in table 1. For the calculation of the concentrations in the x-ray interferometer and the sample 4.12 of the AVO28 crystal (XINT) values from [6, 7] and new results were used. The samples M.2 of Si28-23Pr11 and 4.12 of AVO28 are used for the comparison of the lattice parameters, see section 2.3.2. (b) Differences of point defect concentrations of samples from the AVO28 and Si28-23Pr11 crystals.
| (a) | ||||||
|---|---|---|---|---|---|---|
| Defect | Unit (cm−3) | Si28kg01a | Si28kg01b | XINT | M.2 | 4.12 |
| Carbon | 1015 | 0.89(14) | 2.32(20) | 1.07(10) | 0.41(8) | 0.18(10) |
| Oxygen | 1015 | 0.132(21) | 0.180(22) | 0.369(33) | 0.075(23) | 0.196(25) |
| Boron | 1015 | 0.002 73(29) | 0.003 73(31) | 0.004(1) | 0.0039(5) | 0.0196(20) |
| Phosphorus | 1015 | 0.0124(10) | 0.0235(11) | 0.01(1) | 0.0040(10) | 0.01(1) |
| Nitrogen | 1015 | 0.01(1) | 0.05(3) | 0.061(15) | 0.01(1) | 0.01(1) |
| Vacancy | 1015 | 0.33(11) | 0.33(11) | 0.33(11) | 0.33(11) | 0.33(11) |
| (b) | |||||||
|---|---|---|---|---|---|---|---|
| Defect | Unit (cm−3) | Si28kg01a—XINT | Si28kg01b—XINT | 4.12—XINT | M.2—4.12 | Si28kg01a—M.2 | Si28kg01b—M.2 |
| Carbon | 1015 | −0.18(16) | 1.25(19) | −0.89(14) | 0.23(13) | 0.48(15) | 1.91(20) |
| Oxygen | 1015 | −0.237(30) | −0.189(26) | −0.173(28) | −0.121(31) | 0.057(29) | 0.105(29) |
| Boron | 1015 | −0.0013(9) | −0.0003(9) | 0.0156(19) | −0.0157(17) | −0.0012(3) | −0.0002(2) |
| Phosphorus | 1015 | 0.002(10) | 0.014(10) | 0.000(14) | −0.006(10) | 0.0084(10) | 0.0195(6) |
| Nitrogen | 1015 | −0.051(15) | −0.011(31) | −0.051(15) | 0.000(14) | 0.000(14) | 0.040(31) |
| Vacancy | 1015 | 0.00(16) | 0.00(16) | 0.00(16) | 0.00(16) | 0.00(16) | 0.00(16) |
For samples of different enriched crystals a small isotopic effect has to be taken into account. A relative lattice parameter difference between AVO28 and natural silicon of about 1.95 × 10⁻⁶ was measured [25]. Assuming that the lattice parameter scales linearly with the enrichment, a small difference of Δd/den = 0.68(39) × 10−9 due to the difference in the isotopic enrichments can be estimated.
Thus, the lattice spacing of the new 28Si spheres can be calculated, see table 4.
Table 4. Relative lattice spacing differences of the new 28Si spheres due to point defect (PD) and enrichment (en) differences and the resulting lattice spacings at t90 = 20 °C and in vacuum.
| Sample | (Δd/dPD)/10−9 | (Δd/den)/10−9 | d220 (pm) | Method |
|---|---|---|---|---|
| AVO28 Part XINT | 0 | 0 | 192.014 712 65(33) | Combined x-ray and optical interferometry |
| Si28-23Pr11 Si28kg01a | −0.09(1.23) | 0.68(39) | 192.014 712 76(41) | Point defect, enrichment |
| Si28-23Pr11 Si28kg01b | −9.54(1.75) | 0.68(39) | 192.014 710 95(48) | Point defect, enrichment |
2.3.3. Lattice parameter measurement at KEK.
The NMIJ and the IHEP have evaluated the homogeneity of the lattice parameter within sample Si28-23Pr11 Part M.2 (see brown sample in figure 1) by the self-referenced lattice comparator (SRLC) [36, 37]. And furthermore, we have performed the comparison measurements of lattice parameter between the samples, Si28-23Pr11 Part M.2 and AVO28 Part 4.12, by the SRLC. The 4.12 was cut off from the 4.R1. They were parts of the seed side of the 28Si ingot, AVO28, which was used for the determination of the Avogadro constant [6, 7]. The uniformity of lattice spacing for the 4.12 and 4.R1 was demonstrated in [38, 39].
The SRLC is installed at the beamline BL3C of the Photon Factory (PF) of the High Energy Accelerator Research Organization (KEK, Japan). The principle and mathematical model of the SRLC method were reported in [36, 37]. This method uses a pair of symmetrically equivalent diffractions, which are observed almost simultaneously from the sample crystal. The rotation angles of the two diffractions are very close to each other. In the present experiment, silicon crystal oriented in (1 0 0) was measured by the SRLC and the diffraction pair of (10 0 2) and (10 2 0) was used. The wavelength and Bragg angle were 0.1055 nm and 82.03°, respectively. The lattice spacing of the sample was measured relative to a precision monochromator, the monolithic double channel-cut monochromator (MDCM), which was manufactured at the PF Crystal Optics Processing Laboratory at the KEK.
When all the parameters are well tuned, the SRLC can measure the difference of the lattice spacing, Δd, between the sample and the MDCM divided by the lattice spacing, d, of the MDCM. It is enough to consider only the stability and sensitivity when the distribution patterns of mapped data are discussed. The Δd/d distribution given in this paper is the standard deviation obtained from one series of mapped data within a crystal. On the other hand, when the difference of the lattice parameter between the samples is sought, the mean values of the mapped data should be compared. The relative difference of lattice parameter between the samples can be derived by comparing the mean values of the data series of Δd/d mapping for the different samples.
2.3.3.1. Homogeneity of lattice spacing for the Si28-23Pr11 part M.2.
We performed the mapping measurements for the M.2 and the 4.12. The spatial resolution of the mapping is 1 mm in a horizontal direction and 0.5 mm in a vertical direction. In the present experiment, repeated measurements at a fixed position on the sample had a standard deviation of about 3.8 × 10⁻⁹. The samples were carefully aligned with respect to the x-ray beam monochromated by the MDCM. We adjusted the alignment and performed mapping measurements for the 4.12 and then did the same procedure for the M.2. These measurements were repeated again and finally we got two series of mapped data for each sample. The Δd/d distributions (standard deviation) for mapped data of the 4.12 were 9.6 × 10⁻⁹ and 7.3 × 10⁻⁹. These values were a little larger than that observed in [38, 39], which could be caused by possible instrument instability during the XZ mapping in the present experiment. Two series of the mapped data were also obtained for the M.2, and the Δd/d distributions of the M.2 were 8.3 × 10⁻⁹ and 8.9 × 10⁻⁹. Figure 3 shows one of the lattice spacing maps of the M.2. The difference between pure white and black is 1 × 10⁻⁷. No systematic inhomogeneity was observed in the figure. The 4.12 was very homogeneous and had a very low strain [38, 39]. The uniformity of the M.2 was almost the same as that of the 4.12, and the new crystal was also suitable for determining the lattice spacing.
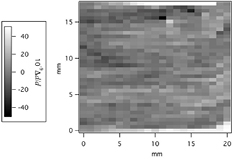
Figure 3. Lattice spacing of the M.2. The mean value of the mapped data was set at zero.
Download figure:
Standard image High-resolution image2.3.3.2. Comparison of lattice spacing between Si28-23Pr11 part M.2 and AVO28 part 4.12.
The relative difference of lattice spacing between two samples can be derived as the difference between the mean lattice spacing of mapped data for each sample. In the present experiment, we carefully tuned all the parameters of the SRLC in order to compare the mean values of the mapped data series obtained from the different samples. The total number of the mapping points for the 4.12 is fewer than that of the M.2, because we performed a wider area of mapping measurements for the M.2 than that for the 4.12 in order to characterize the homogeneity of the new crystal as shown in the previous section. Figure 4 shows the mean values of mapped data for two series of SRLC measurements for the M.2 and the 4.12. The reproducibility of mean values of each crystal was good.
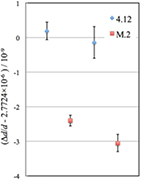
Figure 4. The mean values of mapped data for two series of SRLC measurements. The error bars show the standard deviation of the mean for each set of mapped data points.
Download figure:
Standard image High-resolution imageThe relative difference of the lattice parameters for M.2 and 4.12 was calculated by subtracting the mean value of two series of mapped data for 4.12 from that for M.2, and was thereby found to be

The uncertainty budget is shown in table 5. Uncertainties of yawing and rolling alignments are estimated to be 0.79 × 10⁻⁹ and 0.06 × 10⁻⁹, respectively. A similar analysis was discussed in [40]. Parasitic rotations with mapping movement of XZ stage cause the uncertainty of 1.0 × 10⁻⁹. Short-term stability of the temperature measurements is about 0.29 mK, which corresponds to the relative uncertainty of 0.72 × 10⁻⁹ in Δd/d. Uncertainty due to the angle difference (calibration of autocollimator) is 0.03 × 10⁻⁹. Uncertainty due to the self-weight deformation of the sample is 1.1 × 10⁻⁹. Finally, we obtain the combined standard uncertainty of 1.9 × 10⁻⁹.
Table 5. Uncertainty budget for the relative difference of lattice parameter between M.2 and 4.12.
| Contribution | Relative uncertainty in (Δd/d)/10−9 | |
|---|---|---|
| Statistics | 0.26 | |
| Alignment | Yawing (tilt) | 0.79 |
| Rolling | 0.06 | |
| XZ stage | 1.0 | |
| Temperature difference | 0.72 | |
| Angle difference | 0.03 | |
| Self-weight deformation | 1.1 | |
| Total | 1.9 | |
The relative lattice parameter difference measured by SRLC can be compared to the calculation using the point defect concentrations (see equation (4) and table 3) and the isotopic effect yielding ΔdM.2–4.12/d = −1.3(9) × 10−9, which is consistent with the SRLC result.
The lattice parameter of the AVO28 was well characterized in [7, 25]. The INRIM determined the {2 2 0} lattice-plane spacing of the AVO28 crystal by the combined x-ray and optical interferometer for the XINT crystal, as discussed in the previous section. The mean lattice parameter of the 4.12 is calculated to be

where difference of point defect concentration in the AVO28 is taken into account. Then, the lattice comparison measurements by the SRLC link the lattice parameters of 4.R1 and M.2 from the different ingots, AVO28 and Si28-23Pr11. The lattice spacing of M.2 at 20 °C and 0 Pa is found by this method to be

The lattice spacing of M.2 is experimentally determined with a relative standard uncertainty of 2.8 × 10⁻⁹ by SRLC.
Finally we obtained the mean lattice parameter of each sphere by taking account of the difference of point defect concentration between each sphere and the M.2, in the same manner as equation (4). Table 6 summarizes the lattice spacing of AVO28 and Si28-23Pr11 obtained via the SRLC route. The lattice spacings of the spheres, Si28g01a and Si28kg01b were determined with a relative standard uncertainty of 3.0 × 10⁻⁹ and 3.3 × 10⁻⁹, respectively.
Table 6. 28Si (2 2 0) lattice spacing difference and lattice spacing at t90 = 20 °C and in vacuum. Lattice spacing difference within the same ingot (XINT − 4.12, Si28kg01a − M.2 and Si28kg01b − M.2) were calculated from the point defect concentrations. Lattice spacing difference between ingots (AVO28 4.12 and Si28-23Pr11 M.2) was determined by the SRLC.
| Sample | (Δd/dPD)/10−9 | (Δd/dSRLC)/10−9 | d220 (pm) | Method |
|---|---|---|---|---|
| AVO28 part XINT | 0 | 0 | 192.014 712 65(33) | Combined x-ray and optical interferometry |
| AVO28 part 4.12 | 5.00(1.11) | 0 | 192.014 713 61(39) | Point defect (4.12 − XINT) |
| Si28-23Pr11 part M.2 | 0 | −2.6(1.9) | 192.014 713 11(54) | SRLC (M.2 − 4.12) |
| Si28-23Pr11 | −3.00(1.11) | 192.014 712 53(58) | Point defect (Si28kg01a − M.2) | |
| Si28kg01a | ||||
| Si28-23Pr11 | −12.51(1.71) | 192.014 710 71(63) | Point defect (Si28kg01b − M.2) | |
| Si28kg01b |
The final lattice spacing of the spheres in table 7 is calculated from the average of both methods (tables 4 and 6).
Table 7. 28Si (2 2 0) lattice spacing of the new 28Si spheres at t90 = 20 °C and in vacuum.
| Sphere | d220 (pm) | Method |
|---|---|---|
| Si28-23Pr11 Si28kg01a | 192.014 712 76(41) | Point defect, enrichment |
| Si28-23Pr11 Si28kg01a | 192.014 712 53(58) | SRLC, point defect |
| Si28-23Pr11 Si28kg01a | 192.014 712 72(40) | Average value |
| Si28-23Pr11 Si28kg01b | 192.014 710 95(48) | Point defect, enrichment |
| Si28-23Pr11 Si28kg01b | 192.014 710 71(63) | SRLC, point defect |
| Si28-23Pr11 Si28kg01b | 192.014 710 89(46) | Average value |
2.4. Surface characterization
As almost every material, the surface of the silicon spheres is covered by a thin oxide layer. Beside this oxide layer (OL) two additional sublayers of the surface layer (SL) have to be assumed: The carbonaceous contamination layer (CL) and a chemisorbed water layer (CWL) [41]. Due to the improved manufacturing technology, all possibly present metallic contamination layers are below the detection limit of the surface characterisation methods applied so far [7]. For the determination of the mass and the thickness of these surface layers, in the past and in this work, spectral ellipsometry (SE) has been applied to the spheres. The calibration of the SE mapping was performed with a combination of x-ray fluorescence analysis (XRF) and x-ray reflectometry (XRR).
Due to improved understanding of the chemical and physical form of the SL, both NMIJ and PTB have independently improved their instrumentation for surface characterization. Details of the methods applied at NMIJ and PTB are described in the following sections.
2.4.1. Surface characterization at PTB.
Former investigations on different 28Si spheres with x-ray photoelectron spectroscopy (XPS) have shown that the oxide layer consists only of SiO2, no evidence for other chemical modifications was found [41]. A physisorbed water layer (PWL) has to be taken into account only if measurements are carried out in air. For the determination of the thickness and the mass of these surface layers, the lowest relative uncertainty is required for the OL as it has by far the largest contribution. For the uncertainty of the SL mass an upper limit of u(mSL) = 10 µg is assessed.
2.4.1.1. Classical approach using XRR/XRF with synchrotron radiation and SE.
For this approach the variation of the SL thickness is measured by means of spectral ellipsometry (SE). At PTB a Semilab Type GES5E ellipsometer, modified for sphere measurements, is used (details of the instrumentation can be found in [7, 41]). With the aid of the automatic sample holder for the Si spheres, it is possible to map the sphere surface with a large number of data points (ranging from 5184 up to 15 552) in a few days. According to the basic principle of SE, during the measurement the change of the polarization of light reflected at the surface is analyzed. The refinement of the thickness is done by fitting numerically modelled data of the measured signal. In consequence, the precision of the SE is very high, and can be estimated for the present mapping with 20 pm.
On the other hand, the accuracy of SE is not sufficient according to the required uncertainty for the surface characterization of the Si spheres. The main uncertainties come from the optical constants of the surface layer, which differ for an ultrathin layer (<10 nm) from the values for the bulk material listed in literature. In addition, improving the alignment of the sample in the instrument decreases the uncertainty [42].
To overcome these limitations, a calibration of the ellipsometer is required. At PTB a so-called internal calibration is applied to the SE. With this approach the difficulties regarding the optical constants and the alignment can be eliminated or reduced. For this internal calibration the OL and CL thickness is determined at defined points on the specific sphere as described in the next paragraph, which then serve as calibration points for the SE. Consequently, the ellipsometer is now used in comparator mode, since only the change of the layer thickness compared to the reference point on the sphere is measured. The values of the optical constants need not be known in this configuration. Furthermore, the alignment requires only stability of the mechanical system during rotation of the sample, since only a relative change of the settings will have an impact to the uncertainty.
2.4.1.1.1. Measuring the internal calibration points on the Si sphere by XRR/XRF.
X-ray reflectometry (XRR) allows a traceable thickness determination by relating the observed oscillations of the reflectance to the wavelength of the incident radiation. By selecting photon energies (or wavelengths) around the oxygen K absorption edge at 543 eV, which are available at the PGM beamline in the PTB laboratory at the synchrotron radiation facility BESSY II [43], OL and CL can be distinguished, even on strongly curved surfaces [44]. However, for very thin layers with thicknesses below 3 nm, no oscillations occur. Therefore, the thickness of an SiO2 reference layer (nominal thickness 10 nm) on a Si wafer has been determined with the same XRR approach, followed by measurements with x-ray fluorescence analysis (XRF) at an excitation energy of 680 eV. Here a calibration factor is determined, relating the intensity ratio between the oxygen K fluorescence (at about 525 eV) and the silicon L fluorescence (at about 100 eV) to the oxide thickness determined by XRR. With the same XRF measurements on the sphere, the local OL thickness can be determined from the intensity ratio of the fluorescence lines, taking into account a correction for self-absorption of the Si L line in the thicker reference oxide layer. After the measurements on the sphere, the reference sample is measured again to prove that the calibration factor is constant.
A similar approach is applied for the CL. Here a carbon layer on a Si wafer (AXO DRESDEN GmbH) is used as reference layer for which a thickness of 12.75(25) nm and a density of 2.35(15) g cm−3 are determined from XRR measurements at different photon energies. The calibration factor is determined by XRF measurements at an excitation energy of 480 eV and the intensity ratio is determined between the carbon K fluorescence (at about 284 eV) and the silicon L fluorescence. Absorption effects in the reference layer and the verification of the calibration factor were treated in analogy to the oxide layer.
Measurements were performed on both spheres Si28kg01a and Si28kg01b in September and November 2016. Opposite to each of the three marks on the sphere (denoted +, T, Δ), 121 XRF spectra were acquired every 0.75 mm in three areas of 8 mm × 8 mm and an OL thickness was calculated for each area. As shown in figure 5, the results are very reproducible with deviations below 0.03 nm, corresponding to relative deviations of 3 %, indicating as well that the oxide thickness is already sufficiently stable. Also the variations between both spheres and between the three areas on each sphere are below 0.1 nm. Before applying a correction for the CWL, the mean thickness of the oxygen-containing (mainly oxide) layer from the three areas is 1.14(7) nm (sphere a) and 1.16(7) nm (sphere b), assuming the same density as for the reference oxide layer. For the CL, local variations are more pronounced and relative deviations of up to 15 % were observed. By using again the mean value of the three positions from both measurement runs, a mass of mCL = 14.2(1.8) µg (sphere a) and mCL = 13.5(1.8) µg (sphere b) can be derived. With an estimated density of 1.0(2) g cm−3, the associated thickness is dCL = 0.51(12) nm (sphere a) and dCL = 0.49(12) nm (sphere b).

Figure 5. Thickness of the oxide layer (before CWL-correction), determined with XRR/XRF opposite of the three marked positions (+, T, Δ) on each sphere in September and November 2016. The deviations between both measurement runs are below 0.03 nm.
Download figure:
Standard image High-resolution imageThe XRR/XRF-measurements at BESSY II are followed by two other steps: a correction for the CWL is applied to the oxide layer thickness, and the entire surface is mapped with SE.
For mass deposition of the chemisorbed water monolayer (CWL), which is the residual water on the sphere under vacuum conditions, the value 0.028(4) µg cm−2 measured by Mizushima [45] was applied. To account for the difference between the characteristics of the wafer and the sphere surfaces, the uncertainty of the Mizushima's value was increased by a factor of two. A 1.0(1) g cm−3 density of the water layer was assumed. The corresponding layer mass and thickness are 7.7(2.2) µg and 0.28(8) nm, respectively.
A 2.2(1) g cm−3 oxide density was assumed. Eventually, to observe in detail the variation of the oxide layer thickness, SE was applied to map the whole surface-layer and to generate a complete topography consisting of about 5500 data points.
With these data measured on the spheres Si28kg01a and Si28kg01b following methodology described above and in [7, 41], the thicknesses and masses for the sublayers and the complete SL have been calculated. The results are listed in tables 8 and 9.
Table 8. Thickness of surface layer and sub-layers.
| Sphere | NMI | dCL (nm) | dCWL (nm) | dOL (nm) | dML (nm) | dSL (nm) |
|---|---|---|---|---|---|---|
| Si28kg01a | PTB (XRR/XRF/SE) | 0.51(12) | 0.28(8) | 1.12(19) | 1.91(24) | |
| PTB (XRF/XPS) |
0.34(16) | 0.25(11) | 0.95(13) | <0.01 | 1.54(23) | |
| PTB (average) | 1.00(11) | 1.72(19) | ||||
| NMIJ | 0.43(7) | 0.28(8) | 0.93(10) | 0.05(2) | 1.69(15) | |
| Average (OL) | 0.98(8) | |||||
| Si28kg01b | PTB (XRR/XRF/SE) | 0.49(12) | 0.28(8) | 1.10(15) | 1.87(21) | |
| PTB (XRF/XPS) |
0.43(17) | 0.26(12) | 0.96(14) | <0.01 | 1.65(25) | |
| PTB (average) | 1.03(10) | 1.78(16) | ||||
aTo determine a thickness the measured mass deposition has to be divided by the density (increasing the uncertainty); here, the same values as for the XRR/XRF/SE experiments were used.
Table 9. Mass of surface layer and sub-layers.
| Sphere | Laboratory | mCL (µg) | mCWL (µg) | mOL (µg) | mML (µg) | mSL (µg) |
|---|---|---|---|---|---|---|
| Si28kg01a | PTB (XRR/XRF/SE) | 14.2(1.8) | 7.7(2.2) | 68.3(10.9) | 90.2(11.3) | |
| PTB (XRF/XPS) | 9.4(3.9) | 6.8(3.1) | 57.7(7.5) | <0.1 | 73.9(8.1) | |
| PTB (average) | 61.1(6.2) | 79.2(7.6) | ||||
| NMIJ | 10.1(2.4) | 7.7(2.2) | 56.5(6.6) | 1.34(55) | 75.6(7.4) | |
| Average (OL) | 58.9(4.5) | |||||
| Si28kg01b | PTB (XRR/XRF/SE) | 13.5(1.8) | 7.7(2.2) | 67.0(8.8) | 88.2(9.2) | |
| PTB (XRF/XPS) | 12.0(4.1) | 7.1(3.3) | 58.2(8.0) | <0.1 | 77.4(8.6) | |
| PTB (average) | 62.2(5.9) | 85.1(6.0) | ||||
2.4.1.2. Characterization with new XRF/XPS instrumentation of PTB.
In addition to the procedure described above, the mass deposition per unit area of all elements appearing in the surface layers of the spheres was measured by employing XRF and x-ray photoelectron spectroscopy (XPS) combined in a new tool. This tool allows for a complete mapping of the sphere surface. The tool was developed by PTB in Berlin and is now housed in a laboratory adjacent to the mass-comparator laboratory at PTB in Braunschweig [46].
The surface of both 28Si spheres Si28kg01a and Si28kg01b was investigated between several weighing runs in the mass comparator laboratory (see section 2.6.1). Sphere Si28kg01a was measured during weeks 38 and 41 of 2016, and sphere Si28kg01b was measured during weeks 39, 42, and 43. In order to minimize changes of the surface the transfer of the spheres between the vacuum chamber of the mass comparator and the XRF/XPS tool was done under vacuum conditions employing a sealed container compatible with the load locks of both tools. The scattering of the individual results of each sphere is only about 2 %. In the following only the mean results of each sphere will be presented and discussed.
First the mass deposition of oxygen was measured by XRF [46]. The calibration of the XRF instrument is based on five reference samples with thin silicon oxide films of different thicknesses between 3 nm and 10 nm. The reference samples have been qualified by reference-free XRF at PTB's plane grating monochromator beamline for undulator radiation at BESSY II [47] determining the oxygen mass deposition. Reference-free XRF is based upon calibrated instrumentation and knowledge of atomic fundamental parameters [48] and can provide reliable values of C and O mass per unit area of Si sphere surfaces [49]. The uncertainty of the oxygen mass per unit area was 8.2 % and the homogeneity of the reference oxide layer was found better than 1.5 %. Figure 6 shows a mapping of sphere Si28kg01b after the weighing runs. The mass deposition of oxygen shown is not perfectly homogeneous, but varies only in a range of about 10 %.

Figure 6. XRF-mapping of the 28Si sphere Si28kg01b showing the measured mass deposition mdO of oxygen. For this mapping 218 XRF spectra were measured employing the new XRF/XPS instrumentation of PTB. The location of these spectra is distributed in a manner that the surface of the sphere is evenly divided into patches of the same size. The same mapping was performed recording XPS spectra.
Download figure:
Standard image High-resolution imageIn the second step we employed XPS to measure the chemical composition of the surface layer of the 28Si spheres. In particular, to obtain the ratio between the number of Si atoms which are bound in oxide molecules (dioxide and sub oxides) and the number of all O atoms in the surface layer. With this ratio the mass per unit area of Si in the OL could be determined because of the O mass deposition known from XRF. Si atoms in hydroxide at the OL surface could not be detected by XPS because of the low energy shift (0.5 eV) to the elemental Si 2p peak. Hence, we had to apply a correction for the Si in the hydroxide which is described in [46]. With XPS we could also confirm that less than 2 at % of sub oxides are present in the OL. This result is consistent with the findings in [41]. The combination of the mass deposition value for oxygen obtained by XRF and the atomic concentration determined by XPS allows for a measurement principle that is not dependent on the measurement geometry towards the crystal planes. The signal from the monocrystalline Si-bulk which gets affected by the lattice planes (forward-focusing [50]) is not used for our data evaluation. Hence, every position at the surface of the sphere can be measured without any disturbing effects caused by the orientation of the crystal planes. In consideration of the minimal amount of sub oxides, we attribute a 2 at % uncertainty to the determination of the oxidized Si amount by XPS and we don't distinguish dioxide and sub oxides in the following. Using the surface area of the spheres (275.96 cm2) we can also calculate the total mass of the OL layers 57.7(7.5) µg and 58.2(8.0) µg (see table 9).
The resulting ratio of oxidized Si and O atoms is 0.428(39) and shows that we have more oxygen on the surface than can be bound to the oxidized silicon. We found that 14–15 % of the total oxygen does not belong to the OL but to CL and CWL. In addition, the ratio between O and C atoms could be obtained from the XPS results. The relative uncertainty of the O/C ratio is quite high (about 40 %) but still allows for a useful quantification of the C mass deposition in the CL discriminating three groups of carbon compounds with different oxygen content. However, for the sake of simplicity and comparability with the other methods we attribute all surplus oxygen to the CWL and nothing to CL. For the result of interest, the mass of the SL, this makes no difference to which sub layer we attribute this oxygen. In the case of layer thicknesses of CL and CWL which are needed for correction in the volume determination this can lead to small deviation of about 20 % but the impact on the correction is very low because of the dominating uncertainties of the optical parameters and the densities of these thin films. In [46] we have used the XPS information about the C–O bonds to estimate the amount of O in the CL layer. Attributing all surplus oxygen to the CWL we obtain a mass of 6.8(3.1) µg and 7.1(3.3) µg for the CWL of sphere Si28kg01a and Si28kg01b, respectively. The presented determination of the O content in CWL is only needed to estimate the correction for the mass of hydrogen in the CWL and for the separate determination of the thickness of each of the three surface layers using the same densities as in the XRR/XRF section (see table 8). The estimation of the content of H in the CL was done based on the three different groups of carbon compounds found with XPS as described in [46].
The mass deposition of carbon at the surface of one of the spheres obtained by combining the XRF and XPS results is shown in figure 7. Mostly we found a homogeneous and rather low carbon contamination; only one larger region close to the centre of the map shows an increased carbon deposition.
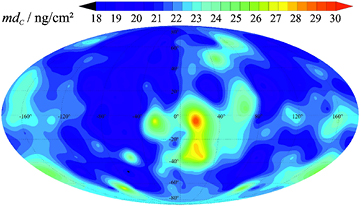
Figure 7. C distribution on the 28Si sphere Si28kg01b determined by XPS C and O peak area comparison based on O mass deposition retrieved from XRF measurements. For this mapping 218 XPS spectra were measured employing the new XRF/XPS instrumentation of PTB. The location of these spectra is distributed in a manner that the surface of the sphere is evenly divided into patches of the same size.
Download figure:
Standard image High-resolution imageBesides oxygen and carbon also small amounts of sodium were found by XPS at the surface of the spheres. However, the sodium contamination was not considered in further analysis. The main reason for neglecting the Na was the low mass deposition of 0.3 ng cm−2 (converted in a thickness about 0.004 nm) only, which is about two orders of magnitude lower than the uncertainties of the other components of the SL. In most of the measurements we could not detect Na. It seems that the Na contamination is usually well-removed by our cleaning procedure of the spheres.
Summing up the total mass of the SL results 73.9(8.1) µg for sphere Si28kg01a and 77.4(8.6) µg for sphere Si28kg01b. The uncertainties of the total mass of the SL are not a simple quadratic sum of the uncertainties of the sub layers because of the correlations, i.e. the mass deposition of oxygen. The detailed uncertainty budget can be found in appendix.
2.4.2. Surface characterization at NMIJ.
At NMIJ, the sphere surface of Si28kg01a was characterized by x-ray photoelectron spectroscopy (XPS) and spectroscopic ellipsometry (SE).
2.4.2.1. XPS at NMIJ.
An XPS system of NMIJ was used for the surface characterization. Its main component was an ULVAC-Phi 1600C XPS system with a monochromatic Al Kα x-ray source [51, 52]. The pressure in the chamber was reduced to 1.5 × 10⁻⁶ Pa. The Si sphere was rotated around the horizontal axis and vertical axis by a manipulator to characterize the entire surface. Details of the XPS system are described in [51]. The measurement was performed at 52 measurement points distributed nearly uniformly on the sphere surface [53]. Figure 8 shows the distribution of the measurement points. The intensity of the photoelectrons from the crystalline Si substrate will be increased along the main crystallographic directions, which is associated with the elastic scattering and interference with strong forward focusing along the low plane indices. This intensity increase was expected to increase the uncertainty of the thickness determination of the surface layers. To reduce the effect of the crystallographic orientation of the Si sphere on the thickness determination, the 52 measurement points were chosen while avoiding the line of longitude of crystallographic planes with low plane indices as much as possible, as shown in figure 8.

Figure 8. Mollweide map projection of 52 measurement points (open circles) and some crystal planes with low plane index (filled circles) on the sphere surface.
Download figure:
Standard image High-resolution image2.4.2.2. Determination of the oxide layer thickness by XPS.
Figure 9 shows the XPS Si 2p core-level spectrum of the sphere. A strong peak with closely spaced spin–orbit components (Si 2p3/2 and Si 2p1/2) corresponding to the Si atoms on the Si sphere was observed. Peaks at high binding energies provide information about the bonding characteristics of the Si atoms in the interfacial oxide (Si2O) and SiO2 layer on the surface of the sphere. Using the Si 2p core-level spectrum, the OL thickness dOL was determined from the following equations [54]:


where ISi,  , and
, and  are the intensities of the Si, SiO2, and Si2O contributions to the Si 2p peak, respectively,
  and
and  are the attenuation lengths for the Si 2p electrons in SiO2 and Si2O, respectively,
  and
and  are the intensity normalization parameters for the SiO2 and Si2O contributions to the Si 2p peak, respectively, and θ is the emission angle of the electrons with respect to the surface normal. In this study, θ was set to 30°. To ensure the traceability of the OL thickness measurement to the SI, the attenuation lengths for the Si 2p electrons in SiO2
  was determined by an SI-traceable x-ray reflectometry system at NMIJ using flat Si samples with different thicknesses of thermal SiO2 [51]. The average OL thickness was estimated to be 0.95 nm with a standard uncertainty of 0.10 nm. These results were used to calibrate the spectroscopic ellipsometer. Details of the calibration are described later.

Figure 9. XPS Si 2p core-level spectrum of the sphere (NMIJ).
Download figure:
Standard image High-resolution image2.4.2.3. Determination of the carbonaceous contamination layer thickness by XPS.
Figure 10 shows the XPS C 1s core-level spectrum of the sphere. The dominant components located around 285 eV and 287 eV correspond to C–C/H and C–O bonds, respectively. The CL thickness was determined from the following equations [55]


where dCL is the thickness of the carbonaceous contamination layer, (IC/ISi) is the ratio of the intensities of the peak from the carbonaceous material to that from Si substrate, L(E) are the attenuation lengths at a photoelectron energy of E, Q(E) are values as defined by Jablonski's analysis of the effects of elastic scattering at E, λ(E) are the inelastic mean free paths for electrons at E, σ are the values of total core level photoionization cross section, M are the relative atomic or molecular masses, and ρ are the densities. The subscripts C, Si and SiO2 denote the corresponding values for a carbonaceous material, Si, and SiO2, respectively. In our previous work, the main constituent of the CL was estimated to be a hydrocarbon [41]. However, as shown in figure 10, in addition to the peak assigned to C–C/H, the peak from C–O bond was clearly observed. Since ethanol was used in the final step during the cleaning of the sphere, the peak assigned to C–O bond was considered to be from ethanol. The main chemical species of the CL were therefore considered to be ethanol and a hydrocarbon. The densities of an ethanol sublayer and a hydrocarbon sublayer were assumed to be 0.79(20) g cm−3 and 0.99(20) g cm−3, respectively.
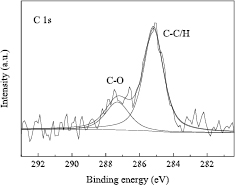
Figure 10. XPS C 1s core-level spectrum of the sphere (NMIJ).
Download figure:
Standard image High-resolution imageBy analysing the XPS C 1s core-level spectrum at the 52 measurement points, the average thicknesses of each sublayer were estimated to be 0.30 nm and 0.13 nm for an ethanol sublayer and a hydrocarbon sublayer, respectively. Consequently, dCL was estimated to be 0.43 nm with a standard uncertainty of 0.07 nm. The results are summarized in table 8.
2.4.2.4. Determination of the metallic layer thickness by XPS.
Figure 11 shows the Na 1s core-level spectrum of the sphere. Because the Na 1s electrons were clearly detected at all of the 52 measurement points, it was assumed that the metallic Na layer (ML) was distributed on the whole sphere surface. The ML thickness dML was determined from the following equations [56]:

where (INa/ISi) is the ratio of the intensities of the peak from the metallic material to that from Si substrate. The subscripts Na and Si denote the corresponding values for the metallic material and Si, respectively. The average ML thickness was estimated to be 0.05 nm with a standard uncertainty of 0.02 nm. The results are summarized in table 8.
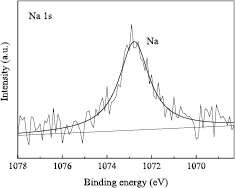
Figure 11. XPS Na 1s core-level spectrum of the sphere (NMIJ).
Download figure:
Standard image High-resolution image2.4.2.5. Evaluation of the distribution of the oxide layer thickness by SE.
A spectroscopic ellipsometer (Semilab GES5E) equipped with an automatic sphere rotation system was also used to evaluate the distribution of the OL thickness [52, 57]. Its spectral bandwidth ranges from 250 nm to 990 nm. The ellipsometer and automatic sphere rotation system were integrated into a vacuum chamber to characterize the surface layers in vacuum. Details of the ellipsometer are provided in [57].
At first, the measurement was performed at the same 52 points used for the XPS measurement. The identification of the measurement points was achieved by the three marks on the sphere. The ellipsometric data were analyzed based on the surface model of a SiO2 layer on a Si substrate. For the calibration of the ellipsometer, the following equation was used:

where dOL is the OL thickness, dXPS is the OL thickness measured by XPS, dSE is the OL thickness measured by SE and c is the calibration constant. From the average values of dXPS and dSE measured at the 52 points, the value of c was determined.
After the calibration, the ellipsometric measurement was performed at 812 points distributed nearly uniformly on the sphere surface [53]. The measured ellipsometric data were analyzed based on the surface model of a SiO2 layer on a Si substrate, and the determined thickness was corrected by c to obtain dOL. The measurement at the 812 points was repeated three times, and the total measurement point was therefore 2436. Between each set of the measurement at the 812 points, the sphere was oriented to distribute all the measurement directions as uniformly as possible. Figure 12 shows the distribution of the OL thickness for a set of the measurement at the 812 points. The average OL thickness on the 2436 points was estimated to be 0.93(10) nm.

Figure 12. Mollweide projection of the OL thickness in vacuum measured at NMIJ by spectroscopic ellipsometry. The measurement was performed at 812 points distributed nearly uniformly on the sphere surface.
Download figure:
Standard image High-resolution imageThe standard deviation of the mean of dOL for the three set of the measurement was 0.01 nm. As to the calibration of the ellipsometer, the standard deviation of the mean of the difference between dXPS and dSE at the 52 points was 0.02 nm. By combining these uncertainties with the uncertainty of the OL thickness determination by XPS, the uncertainty of the average OL thickness determination by XPS and SE was estimated to 0.10 nm. The results are summarized in table 8.
2.5. Volume
Both PTB and NMIJ measure the volume of spheres by interferometric means but with completely different set-ups. This allows an independent check of the results.
2.5.1. Volume measurement at PTB.
At PTB, both spheres of the crystal Si28-23Pr11, namely Si28kg01a and Si28kg01b, were measured with the sphere interferometer. This interferometer is based on spherical reference faces [58] and therefore allows high-resolution topography measurements. A set of measurements comprises about 30 different orientations of the sphere and is a sequence of alternating measurements of the empty etalon and the sphere (see figure 13).
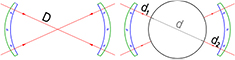
Figure 13. Principle of the diameter measurement at PTB.
Download figure:
Standard image High-resolution imageA sphere is then typically represented by 300 000 diameter values (see figure 14), from which the volume is calculated by the integral over its spherical harmonic representation [59]. The interferences were evaluated by a special Fizeau phase stepping algorithm [60] using wavelength tuning of an extended cavity diode laser. All wavelengths were servo controlled and traced back to a hyperfine component of an iodine stabilized laser. The measurements were performed in vacuum and very close to 20 °C (±3 mK). These deviations were measured and each diameter was individually calculated back to 20.000 °C using the coefficient of thermal expansion for 28Si [61].
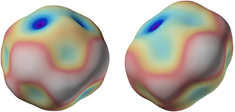
Figure 14. Topographies of Si28kg01a and Si28kg01b. The peak to valley values for the diameter amounts to 58 nm and 84 nm (PTB).
Download figure:
Standard image High-resolution imageFrom the volume, correctly integrated over all diameters, a mean 'apparent' diameter or radius is derived—still without correction for any surface layer. The knowledge of the surface layers from the PTB results in table 8 is used to calculate the retardation Φ0 of the optical wave which can be given as a small correction for the optical path [59]. The apparent diameter, the correction due to surface layers, the final diameter of the 28Si-core of the sphere and its volume are given in table 10.
Table 10. Results of the diameter and volume measurements of the two silicon spheres at t90 = 20 °C and in vacuum.
| Sphere | Lab. | Mean apparent diameter (µm) | 2ΔΦ0 (nm) | Mean diameter of Si core (µm) | Volume V of Si core (cm3) |
|---|---|---|---|---|---|
| Si28kg01a | PTB | 93 723.723 82(22) | −0.015(35) | 93 723.723 80(22) | 431.069 4336(30) |
| Si28kg01a | NMIJ | 93 723.723 61(61) | 0.092(41) | 93 723.723 70(61) | 431.069 4323(85) |
| Si28kg01a weighted mean | 93 723.723 80(21) | 431.069 4336(29) | |||
| Si28kg01b | PTB | 93 720.656 32(22) | −0.008(20) | 93 720.656 31(22) | 431.027 1095(30) |
The relative uncertainty for the volume amounts to 7 × 10⁻⁹ and consists in nearly equal parts of the uncertainty in interferometry, temperature and deviations from optical perfectness [62]. The influence of the sphere's form on the wavefront aberrations was calculated individually for each sphere [63].
2.5.2. Volume measurement at NMIJ.
At NMIJ, the volume of Si28kg01a was measured by an optical interferometer with a flat etalon [52, 64–67]. The sphere and etalon were installed in a vacuum chamber equipped with an active radiation shield to control the sphere temperature. The pressure in the chamber was reduced to 1 × 10⁻³ Pa. Measurements of the fractional fringe order of interference for the gaps between the sphere and the etalon, d1 and d2, and the etalon spacing L were carried out by phase-shifting interferometry. The sphere diameter D was calculated as D = L − (d1 + d2). The light source of the interferometer was an external cavity diode laser, and the required phase-shift for the diameter measurement was produced by tuning the optical frequency of the laser over the frequency range of 20 GHz [65]. The wavelength reference in the optical frequency tuning was synthesized by a frequency comb at NMIJ from an atomic clock linked to coordinated universal time (UTC) [64]. The comb is also used as the national standard of length in Japan.
A sphere rotation mechanism installed under the sphere was used to measure the diameter from many different directions. In a set of the diameter measurement, the diameter was measured from 145 directions distributed nearly uniformly on the sphere surface [64, 67]. The set of the diameter measurement was repeated 15 times, and the total number of the measurement directions was therefore 2175. Between each set, the sphere was oriented to distribute all the measurement directions as uniformly as possible. The temperature of the sphere was measured using small platinum resistance thermometers (PRTs) inserted in copper blocks in contact with the sphere. The PRTs were calibrated using temperature fixed points in ITS-90. The measured diameters were converted to those at 20.000 °C using the thermal expansion coefficient of the enriched 28Si crystal [61]. Figure 15 shows the Mollweide map projection of the diameter based on the measurement from the 145 directions. 3D plot of the diameters is also displayed in this figure.

Figure 15. Mollweide map projection of the diameter (left) and 3D plot of the diameter (right) based on the measurement from the 145 directions (NMIJ).
Download figure:
Standard image High-resolution imageThe measured diameter was the apparent diameter, which is not corrected for the phase shift due to the surface layers. The mean apparent diameter was 93 723.723 61(61) µm. The relative standard uncertainty of the volume measurement was 20 × 10−9. Table 11 shows the uncertainty budget for the determination of apparent volumes. The largest uncertainty source is the diffraction effect [66]. Details of each uncertainty source are given in [67]. Table 10 summarizes the mean apparent diameters of the 28Si spheres obtained by PTB and NMIJ.
Table 11. Uncertainty budget for the apparent volume measurement Vapp at NMIJ.
| Uncertainty source | Relative standard uncertainty in Vapp/10−9 |
|---|---|
| Interferogram analysis | 4.8 |
| Sphere temperature | 9.6 |
| Diffraction effect | 16.0 |
| Standard deviation of the mean volume | 3.5 |
| Relative combined standard uncertainty | 19.6 |
The agreement of the apparent diameter of sphere Si28kg01a between NMIJ and PTB is within Δd/d = 2 × 10⁻⁹, which is smaller than the stated uncertainty. As well the diameter topographies of Si28kg01a of both institutes are congruent. Figure 14 right and figure 15 left showing the same sphere, but due to different resolution and orientation of the plot in different depiction.
2.6. Mass
2.6.1. Mass determination at PTB.
The mass determination of the silicon spheres Si28kg01a and Si28kg01b was performed at PTB in September/October 2016. Before the mass measurements, both spheres were cleaned according to a procedure approved in the international Avogadro project [41, 68]. Based on the results of repeated observations, the uncertainty contribution of the repeatability of the cleaning procedure applied at PTB was estimated to be 3 µg. The mass comparisons were made on a Sartorius CCL1007 mass comparator. This mass comparator is equipped with a vacuum transfer system, which is compatible with the load lock of the combined XRF/XPS system used for the analysis of the surface layers on the spheres (see section 2.4.1.2). The silicon spheres were transferred between the mass comparator and the combined XRF/XPS system under vacuum by means of a sealed container. The measurements in the mass comparator were carried out in a pressure range between 3 × 10⁻³ Pa and 5 × 10⁻⁴ Pa. From previous measurements, the pressure during the transfer between the mass comparator and the combined XRF/XPS system in the sealed container is estimated to be <10 Pa. In the course of the mass determinations, the spheres Si28kg01a and Si28kg01b were transferred between the mass comparator and the combined XRF/XPS system under vacuum one and two times, respectively. Although the transfer between both systems requires additional handlings and surface contacts at different pressure ranges, a mass stability of both spheres in vacuum within ±1 µg was obtained.
Platinum–iridium sorption artefacts were used as transfer standards between the mass of the prototype of the kilogram no. 70 in air and the mass of the silicon spheres in vacuum [68–70]. The sorption artefacts consist of a platinum–iridium cylinder and a stack of eight discs produced from the same material with the same surface properties and adjusted to the same mass. From the change of the mass difference between the two artefacts in the course of the transfer between air and vacuum and the known difference of the surface areas, a sorption correction for the mass of the platinum–iridium cylinder of 2.3(1.2) µg was determined experimentally for a transfer between vacuum at a pressure of 5 × 10⁻⁴ Pa and ambient air with a relative humidity of 46 % at a temperature of 20.9 °C.
The traceability chain between the reference masses used at PTB and the prototypes of the kilogram at the BIPM is given in table 12. The certificate for the recalibration of the prototype no. 55 by the Bureau International des Poids et Mesures (BIPM) in December 2014 (certificate no. 21, April 2015) was issued in due consideration of the results of the 'Extraordinary Calibration' of the BIPM working standards with respect to the international prototype of the kilogram in anticipation of the redefinition of the mass unit [71]. In addition to this recalibration in 2014, revised drift corrections of the involved prototypes were considered based on the BIPM corrections for the calibration of the national prototypes in the period between 2003 and 2013 [72, 73]. The main uncertainty contributions to the combined standard uncertainties of the PTB results given in table 13 are uncertainties of the reference mass in air (5.9 µg), its sorption correction (1.2 µg) and the error of the mass position (1.0 µg).
Table 12. Traceability chain between the reference masses used for the mass determination of the 28Si spheres at PTB and the prototypes of the kilogram at the BIPM.
| Name | Last calibration by PTB | Name | Last calibration by PTB | Name | Last calibration by PTB | Name | Last calibration by BIPM |
|---|---|---|---|---|---|---|---|
| PtSk-Z | Sept. 2016 (against Pt70) | Pt70 | Jan. 2015 (against Pt52) | Pt52 | Dec. 2014 (against Pt55) | Pt55 | Dec. 2014 |
Table 13. Masses of the 28Si spheres as measured in vacuum. A covariance of (3 µg)2 for the traceability to the prototypes of the BIPM was assumed and taken into account for the calculation of the weighted mean.
| Sphere | Laboratory | Mass msphere (kg) | Core mass mcore (kg) | Date of measurement |
|---|---|---|---|---|
| Si28kg01a | NMIJ | 1.000 110 7791(59) | 1.000 110 7035(99) | Mar. 2017 |
| Si28kg01a | PTB | 1.000 110 7852(61) | 1.000 110 7060(97) | Sep./Oct. 2016 |
| Si28kg01a | Weighted mean | 1.000 110 7048(72) | ||
| Si28kg01b | PTB | 1.000 012 6010(61) | 1.000 012 5195(86) | Sep./Oct. 2016 |
2.6.2. Mass measurement at NMIJ.
NMIJ determined the mass of Si28kg01a in vacuum with a standard uncertainty of 5.9 µg, and the results are summarized in table 13. The mass comparison against platinum–iridium kilogram mass standard No. 94 was conducted using a Mettler-Toledo M_one mass comparator, which had a maximum weighing capacity of 1.2 kg, an electrical weighing range of 1.5 g, and a resolution of 0.1 µg [74]. To determine the mass difference between the sphere and standard No. 94, the mean of five weighing results measured over 16 h at a temperature of 21.1 °C and a pressure of less than 3 × 10⁻³ Pa after 30 h vacuum evacuation was used. The standard deviation of these weighing results was 0.2 µg. The mass value of standard No. 94 in vacuum was determined by applying a correction of −5.7(3.3) µg to that in humid air (H = 50 %), which corresponded to the mass decrease due to the desorption of water vapor from its surfaces. Prior to the mass determination, the sphere was washed using the recommended cleaning procedure [68].
Standard No. 94 used as the reference was calibrated with respect to standard No. 6 before and after the mass determination. NMIJ had established the traceability of its mass scale to the IPK using the four standards No. 6, No. 30, E59 and No. 94. Standards No. 6, E59, and No. 94 were calibrated by the BIPM from 1991 to 2015 four times in total. Two of the four calibrations were conducted for standards E59 and No. 94 in 2015 as a part of the second phase of the Extraordinary Calibrations by the BIPM [71, 72]. Using these calibration values traceable to the IPK as well as 17 mass difference data among the four standards measured at NMIJ from 1993 to 2015, the mass values of the standards were determined by the least-squares analysis with an exponential model [75]. From this analysis, the correction applied to the mass of standard No. 6 due to the surface contamination accumulated as of March 2017 was evaluated to be +12.8(2.3) µg over the 25.4 years after the cleaning and washing at the BIPM in October 1991.
At NMIJ, the standard uncertainty due to the influence of the difference in surface condition during the mass measurement and the surface analysis was estimated to be 2.9 µg assuming a rectangular distribution with a half width of 5 µg. Taking account into this uncertainty, the core mass was derived from msphere and mSL to be 1.000 110 7035(99) kg.
At PTB the 3 µg repeatability of the cleaning process has to be included for the XRR/XRF/SE method only and was taken into account for calculating the average SL mass in table 9.
2.6.3. Core mass and mass deficit.
To determine the mass of the silicon core, mcore, the mass of the surface layers was subtracted from the mass of the sphere, see tables 9 and 13.
Table 14. NA determination with the crystal Si28-23Pr11. Lattice parameter, volume, and density are measured at t90 = 20.0 °C and p = 0 Pa. In the brackets the NMI which performed the sphere measurements is indicated.
| Quantity | Unit | Si28kg01a (NMIJ) | Si28kg01a (PTB) | Si28kg01b (PTB) |
|---|---|---|---|---|
| M | g mol−1 | 27.976 942 674(41) | 27.976 942 674(41) | 27.976 942 644(37) |
| a | pm | 543.099 6218(11) | 543.099 6218(11) | 543.099 6166(13) |
| V | cm3 | 431.069 4323(85) | 431.069 4336(30) | 431.027 1095(30) |
| m | g | 1000.110 719(10) | 1000.110 721(10) | 1000.012 550(9) |
| ρ = m/V | kg m−3 | 2320.068 749(51) | 2320.068 748(31) | 2320.068 803(28) |
| NA | 1023 mol−1 | 6.022 140 513(138) | 6.022 140 516(85) | 6.022 140 539(84) |
In addition, the mass deficit is calculated by [7]

It determines the difference between the mass of a sphere having Si atoms on all regular sites and the measured mass value. In equation (16), m28 and mi are the masses of, respectively, a 28Si atom and of the ith point defect (a vacancy mass is zero and oxygen is associated with an interstitial lattice site, so that mO is the sum of oxygen and 28Si masses), V is the sphere volume, and Ni is the concentration of the point defect 'i'. Thus, a mass deficit of 15.2(2.7) µg was calculated for the Si28kg01a and a mass deficit of 30.6(3.2) µg for Si28kg01b. The difference in the mass deficits of the two spheres is caused primarily by the difference in the carbon concentrations, see table 3.
After the surface-layer mass was subtracted and the mass deficit was added, the mass m = mcore + mdeficit = msphere − mSL + mdeficit is obtained (table 14).
3. Avogadro constant determined with Si28-23Pr11
Table 14 gives the results of the measurements of molar mass, lattice parameter, volume, mass, and density of the spheres which are used in equation (1) for the calculation of the Avogadro constant. Three determinations are presented, for the three sphere investigations by NMIJ and PTB. Table 15 summarizes the uncertainty contributions. Although considerably improved, the sphere measurements, i. e. surface, volume and mass determinations, are still dominating the uncertainty of the Avogadro constant. The three Avogadro constant values of table 14 differ only by 7 × 10⁻⁹ NA, far below the uncertainty of the single determination.
Table 15. Summarized uncertainty budgets of the NA determinations by the crystal Si28-23Pr11.
| Quantity | Relative uncertainty/10−9 | ||
|---|---|---|---|
| Si28kg01a (NMIJ) | Si28kg01a (PTB) | Si28kg01b (PTB) | |
| Molar mass | 1.5 | 1.5 | 1.3 |
| Lattice parameter | 5.2 | 5.2 | 5.2 |
| Surface | 7.9 | 7.6 | 6.0 |
| Sphere volume | 19.5 | 7.0 | 7.0 |
| Sphere mass | 5.9 | 6.1 | 6.1 |
| Point defects | 4.7 | 4.7 | 6.2 |
| Total | 23.0 | 14.1 | 14.0 |
Taking into account the correlations due to molar mass, absolute lattice parameter and point defects measurements, the average Avogadro constant value for the Si28-23Pr11 crystal is

with a relative standard uncertainty of 1.2 × 10⁻⁸.
4. Conclusions
The value of NA determined for the new Si28-23Pr11 crystal differs by 3.9(2.1) × 10−8, relatively, from the 2015 value for the AVO28 crystal, taking into account the correlation coefficient of about 20 %. The Birge ratio is 1.85.
The difference between the two 28Si crystals is larger than expected and investigations were started to find the reason(s). Possible explanations for the difference are:
4.1. Undetected point defects (vacancies, impurities)
Vacancies increase the mass deficit (equation (16)), which is added to the core mass mcore, and thus decrease the Avogadro constant value. The vacancy concentration in the AVO28 was measured [6].
The impurity content was measured not only by FTIR spectroscopy, but also by INAA, see section 2.1. The lattice parameter comparison of the crystals by the SRLC confirmed that there was not any serious effect (e.g. by point defects) larger than a few parts in 10−9.
4.2. Molar mass
The uncertainty of the molar mass is extremely small. The method was checked and the results confirmed by many NMIs. Additionally, the x(30Si) amount was confirmed by neutron activation analysis. Nevertheless, a direct comparison by IDMS can be tried.
4.3. Lattice parameter measurements
Since the lattice parameter difference between the AVO28 and Si28-23Pr11 crystals was checked by the SRLC, the difference of the lattice parameter between the two crystals is explained by the point defect and enrichment corrections. A new lattice parameter apparatus is set up at PTB to confirm the INRIM results. In addition, the distribution and homogeneity of the lattice spacing within the ingot can be checked by the SRLC.
4.4. Surface measurements
The PTB set up a new instrumentation to measure the surface layer mass by combined XRF/XPS. The new surface characterization method by XRF/XPS at PTB yields about 10 µg to 20 µg smaller surface layer masses, but this can only partly explain the difference to the AVO28 results. A correction of the AVO28 values would decrease the value of the Avogadro constant and increase the difference to the NRC and NIST watt balances. New measurements of the AVO28 spheres at PTB and NMIJ are being planned.
For the new 28Si spheres the results by this method yielded significantly smaller layer masses than the conventional XRR/XRF/SE method. While the reasons for this difference are still being investigated, an XRF/XPS measurement of the AVO28-S8c resulted in an oxide layer mass about 20 µg smaller than measured during the Pilot Study by XRR/XRF/SE. For a gravitational calibration of the surface characterization methods, the PTB equipped a natural silicon sphere with a thicker oxide and measured the mass increase of the sphere in a vacuum mass comparator. The XRF/XPS result of this mass increase is only about 2 % smaller than the gravitational value. A comparison to XRR/XRF/SE measurements and a publication are planned. A correction of the surface layer mass by 20 µg would decrease the Avogadro constant value by 2 × 10⁻⁸, relatively. Up until now, a correction has not been made since new volume and mass measurements will be necessary.
4.5. Volume measurements
The volume determinations by NMIJ and PTB agree perfectly. An indirect volume comparison between an AVO28 sphere and a sphere of the Si28-23Pr11 crystal can be performed by the pressure-of-flotation method. Such measurements are planned at NMIJ and PTB.
4.6. Mass measurements
The mass measurements by NMIJ and PTB agree within a few micrograms.
4.7. Comparisons
Table 16 and figure 16 compare the XRCD results with the most accurate results of the watt (Kibble) balance projects of the National Research Council Canada (NRC) [76] and of the National Institute of Standards and Technology (NIST—USA) (NIST-3 [77], NIST-4 [78]). The values of the Planck constant measured by these experiments were converted into the corresponding NA values by NAh = 3.990 312 7110(18) × 10−10 Js mol−1, which has a relative uncertainty of 4.5 × 10⁻¹⁰ [5]. With that the relative difference to the NRC Kibble balance results amounts to −4.1(1.5) × 10−8.
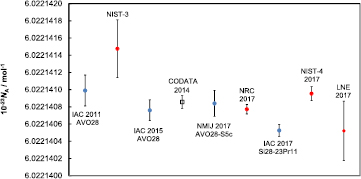
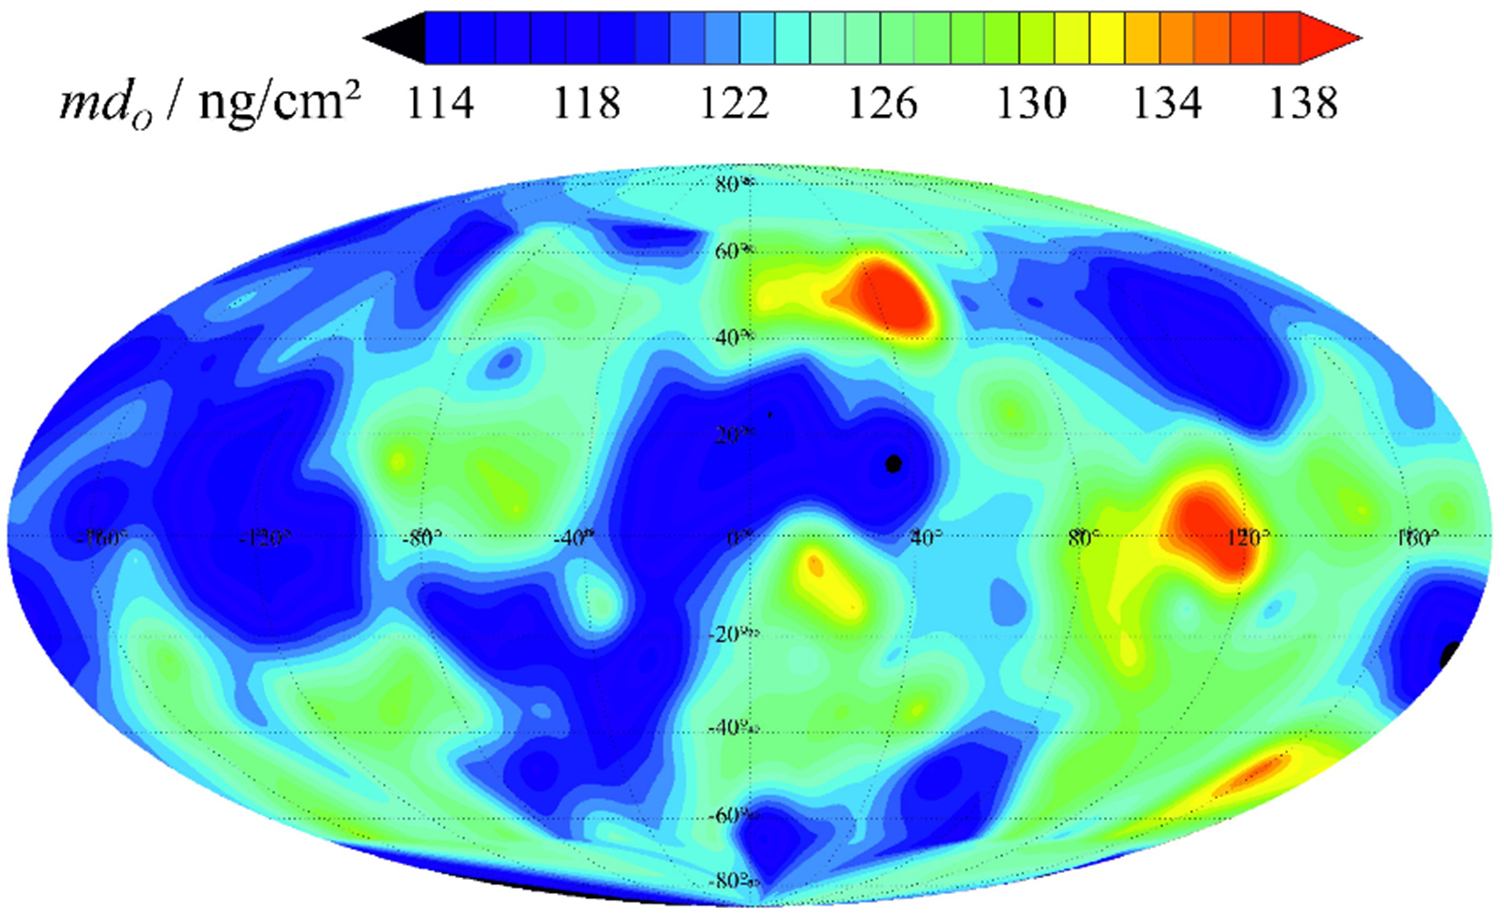
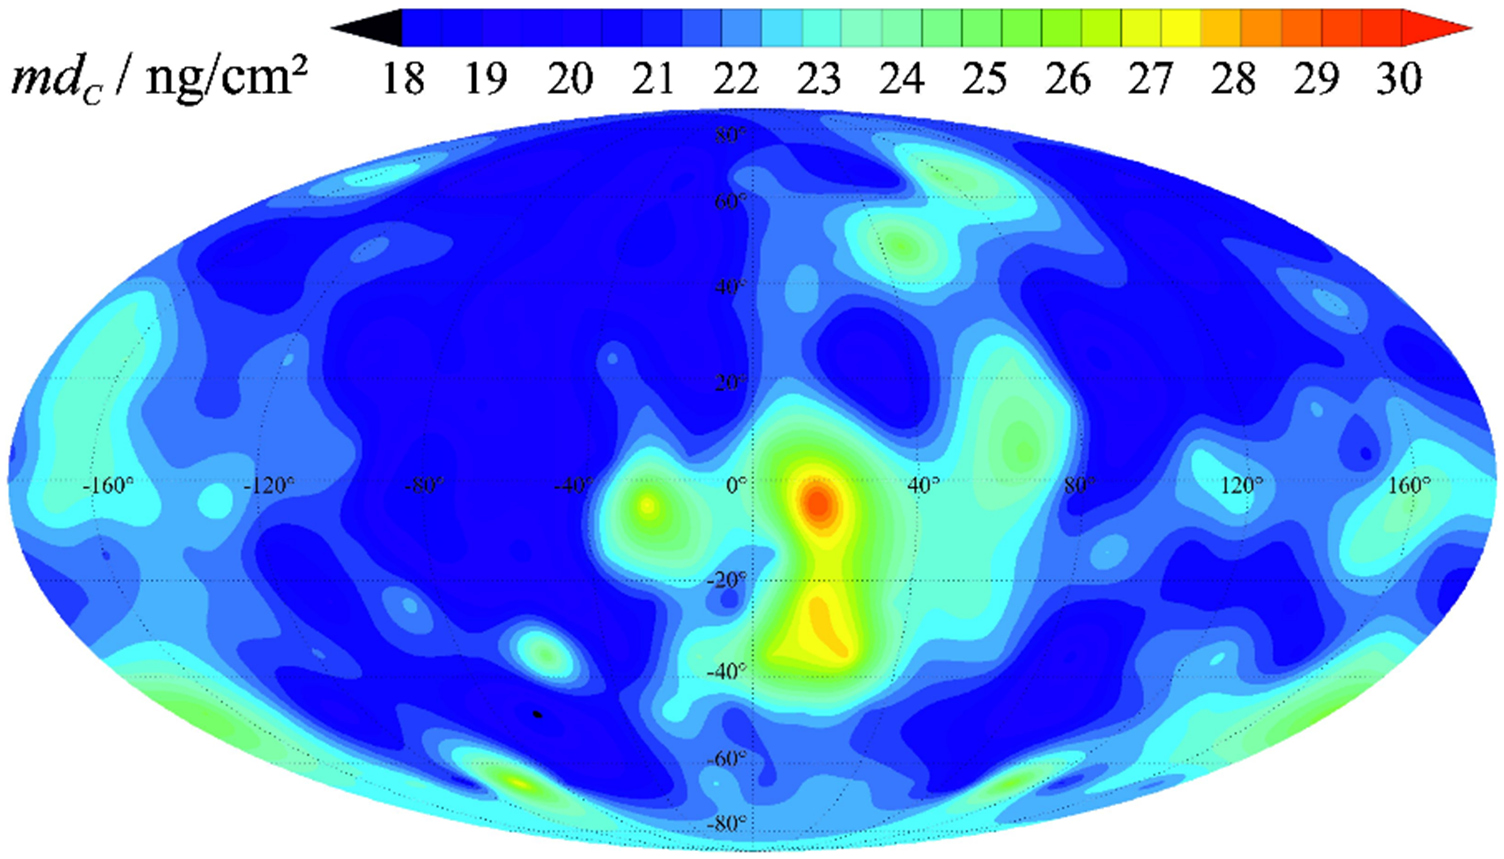
Figure 16. Avogadro constant determinations: comparison between the most accurate NA values at present available. Bars represent the standard uncertainty.
Download figure:
Standard image High-resolution image
Considering all those situations, the causes of the difference may be attributed to the existence of an undetectable amount of atomic scale vacancies or self-interstitials in the silicon crystals. For example, mono-vacancies increase the molar volume (M/ρ) of the silicon crystal while they do not change the lattice parameter measured by x-ray, and vice versa for self-interstitials. The other possible cause may be attributed to the surface measurements, as depicted in section 4.4. A few more experimental verifications are therefore being considered to identify the cause of the difference.
Although the difference in NA values determined from the two crystals is larger than we have expected, this is the first result which has verified that the independently grown 28Si-enriched crystals have shown an agreement at the level of a few parts in 108 in NA, confirming that the XRCD method is one of the methods for the realization of the new definition of the kilogram. For the fixing of the value of the Planck constant results from both crystals (AVO28 and Si28-23Pr11) should be used.
Table 16. Value of the Avogadro constant based on isotopically enriched silicon in comparison to Kibble balance (KB) experiments and to the CODATA value of 2014.
| NMI | NA/1023 mol−1 | ur /10−9 | Reference | Relative difference to CODATA 2014 | |
|---|---|---|---|---|---|
| AVO28 (2011) | IAC | 6.022 140 99(18) | 30 | [6, 7] | 22 × 10−9 |
| AVO28 (2015) | IAC | 6.022 140 76(12) | 20 | [7] | −16 × 10−9 |
| AVO28-S5c (2017) | NMIJ | 6.022 140 84(15) | 24 | [52] | −3 × 10⁻⁹ |
| Si28-23Pr11 | IAC | 6.022 140 526(70) | 12 | This paper | −55 × 10−9 |
| NIST-3 KB | NIST | 6.022 141 48(34) | 56 | [77] | 103 × 10−9 |
| NIST-4 KB | NIST | 6.022 140 953(81) | 13 | [78] | 16 × 10−9 |
| NRC (2017) KB | NRC | 6.022 140 772(55) | 9 | [76] | −14 × 10−9 |
| LNE (2017) KB | LNE | 6.022 140 52(35) | 57 | [79] | −56 × 10−9 |
| CODATA 2014 | 6.022 140 857(74) | 12 | [5] |
Acknowledgments
This work was supported in part by the Grant-in-Aid for Scientific Research (B) (KAKENHI 16H03901) from the Japan Society for the Promotion of Science. The authors are grateful to the KEK-PF Program Advisory Board for approving Project 2016S2-003 under which the SRLC measurement was conducted.
We wish to thank D Nietzold and H-J Pohl for their outstanding encouragement, Stock Company Production Association 'Electrochemical Plant' (SC 'PA ECP') in Zelenogorsk (near Krasnoyarsk, Russia) and the G G Devyatykh Institute of Chemistry of High-Purity Substances of the Russian Academy of Sciences (IChHPS RAS) in Nizhny Novgorod, Russia, for their dedicating work and the punctual delivering of the enriched material, H Riemann and his staff from the Leibniz Institute for Crystal Growth (Leibniz-Institut für Kristallzüchtung, IKZ) for the final crystal growth, R Meeß and his colleagues for the manufacturing of the spheres, our directors for their advice and generous financial support, and all our colleagues for their daily work.
Appendix
A.1. List of quantities for XRF/XPS (PTB)
| Quantity | Unit | Definition |
|---|---|---|
| mO | µg | mass of O |
| mdO | ng cm−2 | mass deposition of O |
| F | cm2 | surface area of the sphere |
| mCL | µg | mass of the carbonaceous contamination layer (CL) |
| MC | relative atomic mass of C | |
| MO | relative atomic mass of O | |
| cC | at% | atomic concentration of C |
| cO | at% | atomic concentration of O |
| mHinCL | µg | mass of H in the carbonaceous contamination layer (CL) |
| mCWL | µg | mass of the chemisorbed water layer (CWL) |
 |
at% | atomic concentration of SiO2 |
| cSiO | at% | atomic concentration of Si sub oxides |
| MH | relative atomic mass of H | |
| mOL | µg | mass of the oxide layer (OL) |
| MSi28 | relative atomic mass of 28Si | |
| mSL | µg | mass of the surface layer (SL) |
A.2. Model equations for XRF/XPS (PTB)
| mO = mdO * F/1000 |
| mCL = mO * MC/MO * cC/cO + mHinCL |
| mCWL = mO * (1 − 2 * cSi/cO) * (1 + 2 * MH/MO) |
| mOL = mO * cSi/cO * (2 + MSi28/MO) |
| mSL = mOL + mCL +mCWL |
A.3. Uncertainty budget of the SL mass of sphere Si28kg-01a obtained by XRF/XPS (PTB)
| Quantity | Value | Standard uncertainty | Uncertainty contribution (µg) | 100 × index |
|---|---|---|---|---|
| mdO | 126.8 ng cm−2 | 12.0 ng cm−2 | 6.6 | 67.5 |
| mdhydroxide | 8.65 ng cm−2 | 3.99 ng cm−2 | 1.1 | 1.9 |
| F | 275.96 cm2 | |||
| cC | 17.1 at% | 8.0 at% | 3.6 | 20.2 |
| cO | 57.9 at% | 2.0 at% | 1.1 | 1.7 |
 |
22.9 at% | 2.0 at% | 1.8 | 5.0 |
| cSiO | 2.05 at% | 1.15 at% | 1.1 | 2.0 |
| mHinCL | 1.64 µg | 1.25 µg | 1.1 | 1.8 |
| MO | 15.999 | |||
| MC | 12.011 | |||
| MH | 1.008 | |||
| MSi28 | 27.977 | |||
| mSL | 73.91 µg | 8.08 µg | ||
The calculation was carried out with the GUM Workbench software [80].