


Abstract
The duration of laser pulses and the carrier-envelope phase (CEP) play a crucial role in shaping kinetic energy release (KER) spectra. In this study, we performed theoretical calculations on pulse duration-dependent KER spectra, ranging from hundreds to sub-femtoseconds, focusing on the  scenario. Our findings reveal a distinct shift in KER peaks from sub-cycle pulses, deviating from the resonance energy. Utilizing two-level perturbation theory, we identify that this shift is attributable to the energy-dependent transition matrix elements. Moreover, our investigation uncovers a notable CEP effect in KER from sub-cycle pulses, arising from interference between counter-rotating and rotating terms within a single ultraviolet photon transition. To leverage this insight, we propose a novel pump-probe methodology for precise CEP characterization of ultra-short laser pulses. We hope this method would promise advancements in understanding and manipulating ultrafast processes.
Export citation and abstract BibTeX RIS

Original content from this work may be used under the terms of the Creative Commons Attribution 4.0 license. Any further distribution of this work must maintain attribution to the author(s) and the title of the work, journal citation and DOI.
1. Introduction
Over the last five decades, significant strides in ultrashort pulse technology have transformed the landscape of ultrafast dynamics research in atomic and molecular realms. Breakthroughs, such as chirped pulse amplification enabling optical laser pulses in the tens of femtoseconds [1, 2], high-harmonic generation leading to sub-femtosecond and attosecond extreme ultraviolet (UV) pulses [3–5], and the advent of free-electron lasers extending x-ray pulses into femto- and attosecond [6], have catalyzed transformative advancements in time-resolved spectroscopy [7–11]. These milestones empower researchers to delve into ultrafast molecular and electronic dynamics, probing the motion of nuclei and electrons [12–15]. This departure from traditional spectroscopy for studying atomic and molecular structures [16] has paralleled the evolution of time-resolved spectroscopy, now equipped with femtosecond and attosecond time-resolution capabilities. Illustrative impacts include unveiling vibronic molecular dynamics via femtosecond time-resolved photoelectron spectroscopy [17], identifying a two-electron excited Fano resonance through attosecond transient absorption spectroscopy [7], and imaging charge transfer processes during dissociation via femtosecond x-ray photoabsorption, offering insights through delay-dependent kinetic energy distributions of fragmental ions [9].
In the domain of time-resolved spectroscopy, a fundamental tenet asserts that shorter pulse durations enhance time-resolution. However, a trade-off arises as pulse duration decreases, leading to an increase in pulse bandwidth. This expanded bandwidth introduces intricacies into laser-matter interactions, giving rise to phenomena such as wavepacket formation and unconventional spectroscopic structures [18–20]. When exploring coherent wavepackets through photoionization with ultrashort pulses, photoelectron spectroscopy unveils additional structures carrying information about the coherent wavepacket itself [21]. Notably, studies on diatomic photodissociation utilizing weak sub-cycle pulses demonstrate that photofragment angular distributions are influenced by the carrier-envelope phase (CEP). These distributions deviate from conventional  - or
- or  - patterns resulting from the temporal neighboring rotational excitation, a result of the joint contributions of counter-rotating and rotating terms within a single UV photon transition [22].
While intense femtosecond UV pulses have sparked theoretical interest in photodissociation dynamics [23–40], scant research has delved into the impact of pulse duration on this process. Our focus is on the consequences of varying pulse duration—ranging from hundreds of femtoseconds to sub–femtoseconds—initiated by 'resonant' weak UV pulses, specifically exploring kinetic energy release (KER) spectra in diatomic molecules.
Two crucial findings emerge from this study. Firstly, diminishing pulse duration leads to a transformation of sharp KER peaks into a diverse array of broad structures. This metamorphosis is intricately influenced by pulse frequency, the initial vibrational state, and the complex interplay between the pulse's energy spectrum and the energy-dependent transition matrix element. Secondly, within the sub-femtosecond regime, both counter-rotating and rotating terms play a substantial role, amplifying the CEP effect's significance. To characterize the CEP effect accurately, we propose a novel pump-probe method. This method analyzes the KER spectrum generated through the simultaneous excitation of long pulses with known parameters and sub-cycle pulses with unknown CEP values. Leveraging the unique structure of the modulated coherent spectrum, we derive a nonlinear relationship associated with the CEP. This nonlinear dependence serves as a valuable complement to the standard approach for characterizing the CEP of isolated attosecond pulses.
2. Computational methods
2.1. Calculation: complete description for multiconfigurational time-dependent Hartree (MCTDH)
The comprehensive treatment of photodissociation dynamics has been previously outlined in several works [22, 36–41]. Here, we provide a concise description, focusing on the involvement of ground and dissociative electronic states characterized by nuclear wavepackets Φ11 and Φ22, respectively. The governing equation for the time-dependent nuclear dynamics is expressed as follows [42–44]:

and

where the first term presents the vibrational and rotational kinetic operators, mµ
is the reduced mass and q is the internuclear distance.  is the nuclear rotational angular momentum [45].
  and
and  are the potential energy curves (PECs) and permanent dipole moments of electronic state i = {1,2}, respectively, and the transition dipole moment is
  , all the relevant molecular parameters in this work are cited from [34] (see figure 1, panel (a) is the PECs of
  for the ground X
 and excited A
 electronic states).
  (
( ) or
) or  (
( ) is the angular transition operator [36–38], with
  being the projection of total orbital angular moment onto the molecular axis, and β is the Euler angle between molecular axis and space-fixed (SF) Z-axis, γ is the Euler angle representing rotation around the molecular axis [45]. We consider a linearly polarized radiation
  in SF Z-axis, with vector potential
  and the peak field intensity
  .
.  is the envelope of vector potential with full-width at half-maximum (FWHM)
  , and
, and  and
and  are the central frequency and CEP, respectively. On the right of the figure 1, panels
  are the pulses' electric field profiles in both time and energy domains for different duration, taking 100, 20, 5, 0.22 fs as an example, is indicated by black and blue lines, respectively.

Figure 1. (a) Potential energy curves (PECs) of  for the ground X
 and excited A
 electronic states (data are reproduced from [34]). A UV pulse with a frequency of
  is used to excite resonance from the ground state indicated by Φ11 (in sub-section (2.1), denoted by
  in sub-section (2.2)) to the dissociative state Φ22 (in sub-section (2.1), discrete levels named
  in sub-section (2.2)).
  Pulses' electric field profiles in both time and energy for different duration is indicated by black and blue lines, respectively (the color of the axis labels and the corresponding ticks matches the curves' color). The squared transition matrix element
  (detailed definition is given in sub-section (2.2)) from state X
 to A
to A of
of  with initial rovibrational state
  is represented by the blue dotted lines (sharing the scale axis and labels with the electric spectrum). The pink lines represent the transition dipole moments that actually operate under the corresponding spectrum broadening. The kinetic release energy is defined as
  , where
  is the excitation energy,
  represents the initial energy, and
  denotes the asymptotic energy of the final states.
Download figure:
Standard image High-resolution imageThe rovibronic equation is solved with the help of Heidelberg MCTDH package [46]. The vibrational degree of freedom (DOF) q is described by 381 sin-DVRs equally distributed in region 2 ∼ 40.0 a.u.; 51 basis functions have been used for the rotational DOF β by  -normalized Wigner D functions. A complex absorbing potential with form
  is implemented to calculate the KER of the dissociative channel with
  a.u. and
  a.u., as [47]
2.2. Perturbation theory
The transition from ground state to excited state can be simplified into a two-level system characterized by excitation energy  and transition dipole moment
  ,
,  and
and  are the wavefunctions for levels 1 and 2, respectively. For a weak pump case in the first-order time dependent perturbation frame
  1 [48, 49], the wavefunction of the excited state
  can be expressed as follows [22]

where  , and the first and second terms correspond to the counter-rotating and rotating terms, respectively.
In the context of a diatomic molecule, the dissociative state can be seen as a set of discrete levels denoted as  , characterized by their total angular momentum J and kinetic release energy E. The transition matrix element from the initial level
  to the final level
  is described as
  . In this work, we calculate
  following the methodology outlined in our previous research [50]. In the limit as time approaches infinity, the wave function
  becomes solely connected to the excitation energy
  in the weak field regime. The kinetic release energy is defined as
  , where
  represents the initial energy, and
  denotes the asymptotic energy of the final states. Moreover, the expected KER peak position is given by
  . In this case, the wavefunction of the excited state is the explicitfunction with explicit E, as shown below

The norm square of this wave function serves as the probability density for the kinetic energy release. Consequently, the KER spectra can be evaluated as

Which would reduce into the following usual one when considering the long pulses,

in this case the counter-rotating term can be neglected and the CEP does not contribute [22]. It's important to note that for  ,
,  is 6.342 eV, while the relevant
  values are 0.100 eV for
  =
=  and 1.018 eV for
  .
.
3. Results and discussion
In figure 2, we present the photofragment KER spectra, numerical simulations performed by MCTDH package, with the peak intensity normalized. The spectra are plotted against decreasing pulse duration ( ), ranging from hundreds of femtoseconds to sub-femtoseconds. These representations focus on a
  molecule ion in the dissociative electronic state A
 , excited by weak UV pulses of various frequencies (
 ), where the ground state is depleted by approximately 0.5
 . The pulse intensity varies between
  and
and  as the pulse duration decreases. The results are illustrated in both two-dimensional and one-dimensional scenarios, presented in the left and right panels of figure 2, respectively. In the left panels, a single KER peak is observed, gradually broadening and shifting significantly toward lower energy regions as the pulse duration decreases to several femtoseconds for different pump frequencies. Notably, as
  enters the sub-femtosecond regime, the spectra exhibit reduced sensitivity to both pulse duration and frequency.

Figure 2. The left panel shows the normalized KER spectra, on dissociative state A of
of  molecule ion with respect to the UV pulse duration
  with CEP = 0.0
 by different frequencies
  at the ground electronic
  with initial rovibrational state
  . At the right panel, the middle one shows the selected KER spectra presented in figure 2(a) for different
  and CEP with
  = 7.0 eV, with the pulse spectra of 100 fs pulse given in the upper panel, the transition matrix element
  from state X
 to A
to A of
of  with initial rovibrational state
  is given in the lower panel. The vertical dash line indicates the expected KER peak position
  , which is 0.76 eV for
  = 7.0 eV. The spectra marked as cycles in the middle panel are evaluated by equation (6) from perturbation treatment.
Download figure:
Standard image High-resolution imageTo understand the variations observed in the KER spectra concerning pulse duration and frequency, our initial step is to observe the first-order time-dependent perturbation treatment outlined in the COMPUTATIONAL METHODS. This approach allows us to intuitively analyze the analytical solution of the KER spectrum presented in equations (6) and (7), which encapsulate the fundamental physics underlying the KER spectra in relation to pulse duration. In essence, the exponential term in this equation encapsulates the pulse spectrum. For long pulses, the KER peak assumes the form of a Gaussian profile centered at  . In this scenario, the transition matrix element
  remains relatively 'invariant' within the limited spectral region. However, as
  decreases from 100 fs to 2 fs, the FWHM of the exponential term or the pulse spectrum broadens from 0.0155 eV to 0.775 eV. During this transition, the transition matrix element
  starts playing a significant role, and the KER structure becomes jointly determined by the spectral characteristics of both the pulse and
  . As
. As  continues to decrease into the attosecond regime, the detailed structures of
  begin to overlay on the broader background of the pulse spectrum. In this situation, the KER spectra start to follow the fine structure of
  and become less sensitive to variations in pulse duration. Figure 1
 intuitively illustrates the relationship between pulse duration and the squared transition dipole moment
  . The blue dotted lines represents
  from state X
 to A
to A of
of  with the initial rovibrational state
  , while the pink lines represent
  that operate under the corresponding spectrum broadening.
The spectra in figure 2(e) illustrate the impact of varying pulse duration ( ) while maintaining a fixed pulse frequency (
 = 7.0 eV). These spectra, computed using equation (3), are compared with cycles obtained from the perturbation formula (equations (6) and (7)). In figures 2(d) and (f), both the normalized pulse spectra and the squared energy-dependent transition matrix element
  are presented, respectively. When the pulse duration
  is set to 100 fs, the KER spectra exhibit peak positions and profile shapes virtually identical to those of the pulse spectrum. However, as
  is decreased to values less than 2 fs, the KER spectra increasingly resemble the structure of
  . This comparative analysis demonstrates that equations (6)–(7) effectively reproduce all the computed KER spectra. Moreover, as
  is further reduced, local maxima of
  surrounding the pulse frequency begin to emerge, causing a noticeable shift in the original KER peak positions toward these local maxima. It's noteworthy that the observed findings regarding KER profiles concerning pulse duration remain consistent even when considering more complex initial states, such as
  . For additional details, refer to the supplemental material [51], which includes [52]. This universality underscores the robustness of the observed behavior across different scenarios.
In figure 2(e), results with different CEPs under the same pulse conditions are visually represented by blue, red, and black lines corresponding to CEP values of 0.0 , 0.25
 and 0.5
 , respectively. An intriguing observation arises: before the light pulse enters the sub-femtosecond regime, outcomes for various CEPs perfectly coincide. However, as the pulse duration shortens into the sub-femtosecond range (equation (7) does not work any more), disparities among the results associated with different CEPs begin to emerge. These disparities can be attributed to the fundamental principles of the perturbation formula and the analyses discussed earlierr [22]. In the context of longer pulse durations, only the rotating term plays a significant role, and the impact of the CEP can be safely disregarded. However, as the system enters the sub-femtosecond regime, both the rotating and counter-rotating terms become active simultaneously, rendering the CEP effect non-negligible. Notably, when
  fs, the KER spectra exhibit a very strong dependence on the CEP. The deviations in KER associated with different CEPs within the sub-femtosecond regime underscore the intricate interplay between these two terms and their joint contribution to the dynamics.
To tackle the challenge of distinguishing the CEP effect within a sub-femtosecond pulse, we propose a novel method for characterizing the CEP. This approach involves using a longer pulse ( = 20 fs,
  = 6.5 eV) with known parameters as a probe pulse, which interacts with the target molecule concurrently with a sub-femtosecond pump pulse (
 = 0.11, 0.22, and 0.33 fs,
  = 7.0 eV) possessing an unknown CEP (
 ). With the help of equation (4), the joint wavefunction of the upper state within the perturbation regime by the two pulses could be rewritten as

where  ,
,  (i = 0,1) is the pulse area, and
  is the relative phase difference between two pulses. The sub-femtosecond pulse contributes the first term with both counter-rotating and rotating terms, while the long pulse contributes the second term with only the rotating term, which can coherently change the KER spectrum at around
  . Explicitly, by varying the relative phase difference
  (through the time delay) and considering the combined impact of these two pulses on the KER spectrum, a distinctive marker as a abrupt varying structure would emerge at around
  when the pulse areas of the two pulses become approximately equal, arising from the coherence established between the pump and probe pulses, leading to a discernible feature in the KER spectrum due to the faster attenuation of the probe pulse.
Figure 3 illustrates joint spectra involving the relative phase difference  for both sub-cycle (left panel,
  fs) and few-cycle pulses (right panel,
  fs) in three distinct scenarios. These scenarios encompass variations in pulse area and CEP, specifically considering CEP values of 0.0
 and 0.5
 . A notable distinction emerges between the spectra associated with sub-cycle and few-cycle pulses: for sub-cycle pulses, the two-dimensional spectra exhibit significant variations as CEP changes, while the few-cycle pulse spectra remain largely unchanged. This feature persists even when the probe pulse area changes from
  to
to  . Additionally, in the case of sub-cycle pulses, a distinct pattern strongly depending on CEP arises when
  is around
  . This phenomenon originates from the rapid attenuation dynamics mentioned earlier. However, beyond these special cases, other values of
  can also serve as indicators to identify the CEP effect, as they deviate from the original spectral structure. Further insights are gained through a comparison of normalized spectra, showing the ratio pattern between CEP = 0.0
 and 0.5
 under sub-cycle and few-cycle pulses (figures 3(b) and (d)). Upon analysis, it becomes evident that the spectra corresponding to CEP values of 0.0
 and 0.5
 undergo the most significant changes when the relative phase difference
  is set to
  . Consequently, a relative phase difference of
  proves to be a distinctive identification case, enabling a more pronounced and readily detectable indication of the CEP effect within the dynamics of sub-cycle pulses.

Figure 3. The KER spectra of CEP = 0.0 and 0.5
 with respect to the phase difference
  when the three pulse areas (
 =
=  ,
,  and
and  ) and the pulse durations
  are 0.22 fs (panels
  ) and 0.44 fs (panels
  ), respectively. Panels
  and
and  show the ratio pattern between the normalized spectra of CEP at 0.0
 and 0.5
 .
.
Download figure:
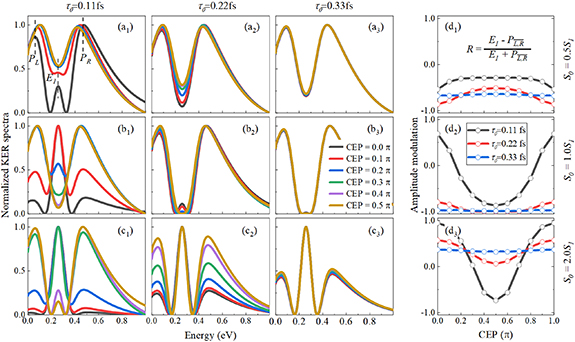
Standard image High-resolution imageBuilding upon the distinctive identification case highlighted in figure 3, we present the normalized coherent KER spectrum in figures 4(a1)–(c3) for  . This spectrum encompasses three different pulse areas (
 = 0.5, 1.0 and 2.0
 ) and pulse durations (
 = 0.11 fs, 0.22 fs and 0.33 fs), with the pulse CEP ranging from 0.0
 to 0.5
 . As it shows, the KER spectrum effectively illustrates the profound modulations observed in sub-cycle pulses influenced by a longer probe pulse. The coherent spectral lines exhibit additional peaks and valleys intricately governed by the characteristics of the pump pulse duration. Notably, with increasing pulse duration
  under the same pulse areas, the gap between KER spectra corresponding to different CEPs decreases, moving toward convergence. Moreover, when considering diverse pulse areas, the shape of the modulated KER spectrum for a given pulse duration
  displays discernible distinctions.
Figure 4.
 show the normalized coherent KER spectra with fixed phase difference
  for three pulse areas (
 =
=  ,
,  and
and  ) and three pulse durations (
 = 0.11 fs, 0.22 fs and 0.33 fs), with different colors representing different CEPs varying from 0
 and 0.5
 .
.  represent the amplitude modulation ratio
  with respect to the change of CEP, and different colors indicate different pulse duration.
Download figure:
Standard image High-resolution image
To provide a more concise characterization of the sub-cycle CEP effect, we introduce an amplitude modulation ratio, denoted as  , where E1 represents the peak or valley value of the coherent spectral component associated with the position of the long pulse peak, and
  , PL
and PR
represent the local maximum values of the left and right shoulders of the coherent spectral component, as depicted in figure 4(a1) for CEP = 0.0
, PL
and PR
represent the local maximum values of the left and right shoulders of the coherent spectral component, as depicted in figure 4(a1) for CEP = 0.0 . This ratio offers a convenient quantitative measurement of the amplitude modulation observed within the sub-cycle CEP effect. The relationship between the amplitude modulation ratio R and the CEP is illustrated in figures 4(d1)–(d3) for three distinct pulse areas. When keeping the same pulse area, a noticeable trend emerges: as the pulse duration
  increases, the ratio of change with respect to CEP levels off. Furthermore, when comparing different pulse areas, an increase in pulse area results in a significantly amplified change in the amplitude modulation ratio. This pronounced and predictable modulation associated with CEP variations and its correlation with amplitude modulation provide valuable insights for precise CEP determination. The discernible trend in the amplitude modulation ratio offers a valuable tool for accurately determining the CEP of sub-cycle pulses.
4. Conclusions
The influence of pulse duration on photodissociation dynamics and photofragment KER spectra diverges significantly from that of conventional long pulses. Our investigation focuses on the photofragment KER spectra in a diatomic molecule ion,  , excited from the ground electronic state X
 to the dissociative state A
 by linearly polarized UV pulses with varying pulse durations, ranging from hundreds of femtoseconds to sub-femtosecond timescales. Numerical simulations uncover that ultrashort UV pulses yield KER spectra with broadened and diverse structures, distinct from the well-shaped Gaussian profiles produced by long UV pulses. Utilizing a two-level perturbation model to reconstruct the KER spectra, we demonstrate that these features arise from the combined influences of the pulse energy spectrum and the energy-dependent transition matrix element. In the narrow bandwidth limit, where the transition matrix element remains nearly constant, the KER spectrum profile is predominantly determined by the pulse spectrum. Conversely, in the broad bandwidth limit, the structure of the KER spectrum is shaped by the energy-dependent transition matrix element or the photodissociation cross-section.
Notably, the CEP effect becomes particularly pronounced in the realm of sub-femtosecond pulses. This is attributed to the simultaneous involvement of both counter-rotating and rotating terms within sub-femtosecond pulses, leading to an amplified influence of the CEP. However, distinguishing this CEP effect becomes challenging following post-normalization due to inherent structural similarities within the spectra.
In light of these insights, we propose an innovative pump-probe method for the precise characterization of the CEP of sub-femtosecond pulses. This method involves generating a KER spectrum with a unique structure by combining a longer pulse with known parameters, acting as a probe pulse, with a sub-femtosecond pulse characterized by unknown values, serving as a pump pulse. Within the resulting pump-probe modulated coherent KER spectrum, a distinctive nonlinear relationship emerges, directly associated with the CEP. This nonlinear relationship constitutes a valuable addition to the existing approaches used for characterizing CEP within isolated attosecond pulses.
Ultimately, our study provides a comprehensive understanding of molecular dynamics, shedding light on the intricate interplay between light and matter in the context of ultrashort pulses. The insights derived from this work carry significant implications for advancing our comprehension of ultrafast phenomena and their applications across various scientific domains.
Acknowledgment
Grants from NSFC (Nos. 12374238, 11934004 and 11974230) are acknowledged.
Data availability statement
All data that support the findings of this study are included within the article (and any supplementary files).
Supplementary data (1.7 MB TEX)
Supplementary data (<0.1 MB TEX)