


Abstract
We study beaming properties of laser light produced by a plasmonic lattice overlaid with organic fluorescent molecules. The crossover from spontaneous emission regime to stimulated emission regime is observed in response to increasing pump fluence. This transition is accompanied by a strong reduction of beam divergence and emission linewidth due to increased degree of spatial and temporal coherence, respectively. The feedback for the lasing signal is shown to be mainly one-dimensional due to the dipolar nature of the surface lattice resonance. Consequently, the beaming properties along x and y directions are drastically different. From the measurements, we obtain the M2 value along both principal directions of the square lattice as a function of the pump fluence. Our work provides the first detailed analysis of the beam quality in plasmonic lattice lasers and reveals the underlying physical origin of the observed strong polarization dependent asymmetry of the lasing signal.
Export citation and abstract BibTeX RIS

Original content from this work may be used under the terms of the Creative Commons Attribution 4.0 licence. Any further distribution of this work must maintain attribution to the author(s) and the title of the work, journal citation and DOI.
1. Introduction
Many of the appealing features of plasmonic systems stem from the high near-field enhancement and confinement of light beyond the diffraction limit [1, 2]. Particularly promising application areas include sensing [3–6] and engineering of polarization [7], directionality or spectral features of light sources [8–10], as well as miniaturization of photonic devices [11].
Unfortunately, there exists a fundamental trade-off between the high field confinement and losses of plasmonic systems. Both ohmic and radiative losses can severely limit the applicability of plasmonic resonances. While ohmic losses can be minimized by choosing a low-loss metal, radiative losses can be significantly reduced by utilizing lattices of nanoparticles. The hybridization of the lossy plasmon resonance with a low-loss diffracted orders of the lattice results in so-called surface lattice resonances (SLRs) possessing extremely narrow linewidths [12–14].
Yet another approach to compensate for the high losses is to introduce optical gain into the vicinity of the metallic structure. Enhanced spontaneous emission rates, amplified spontaneous emission, as well as lasing have been reported for plasmonic structures combined with gain [15–17]. Recently, plasmonic nanoparticle lattice lasers have been studied by us and others [18–24]. The transition from spontaneous emission to lasing regime is associated with highly nonlinear increase of emission intensity in response to increasing pump power. In addition, drastically reduced emission linewidth and beam divergence are typically observed due to increased temporal and spatial coherence provided by the stimulated emission processes [25]. While previous reports provide convincing evidence of the lasing action in such lattices, quantitative evaluation of the beaming properties of plasmonic lattice lasers (PLLs) has not been reported. In contrast to conventional laser cavities, where the feedback is provided by the cavity mirrors, the operation principle of PLLs is based on the coupling of the nanoparticles via their in-plane radiation fields. Due to this, the intensity as well as the phase distribution at the source plane of the PLLs may be affected by a number of parameters, such as polarization state, the size of the lattice, defects and the size and shape of the nanoparticles. Naturally the beaming properties of the PLLs are affected by the intensity and phase distributions of the source plane [22], whose engineering could allow generation of light beams with diverse characteristics [26–28]. Besides studying the underlying physics related to these coherent nanoscale light sources, it is useful to evaluate their application potential by benchmarking them against existing beam quality standards.
Here, we measure the spatial coherence of a gold (Au)-based PLL at the source plane using a mirror-based wavefront-folding interferometer (WFI) [29, 30]. With the use of the WFI, the full four-dimensional spatial coherence function can be measured for nearly arbitrary light sources. Here, we demonstrate its suitability for the spatial coherence measurement of fairly low-intensity PLL sources. Due to dipolar feedback mechanism of PLLs, the spatial coherence exhibits strong asymmetry between the principal directions of the square lattice. We determine the quality of the beam by measuring its M2 values [31] in both x and y directions as a function of the pump power using the source-plane and far-field intensity as well as the spatial correlation functions. This work adds to the methodology of characterizing PLL sources [25] and other plasmonic-related light sources [32] which has thus far been limited to the measurement of spatial or temporal coherence. Moreover, the M2 value allows the assessment of beaming properties against well-known industry standards essential for evaluating the application potential of such lasers.
2. Theoretical background
The nanolasers considered in this work are pulsed light sources with picosecond-scale pulse length, having spectral linewidths on the nanometer scale. When optically pumped, they emit directional, pulsed, and linearly polarized beams that are anisotropic in the sense that the divergence properties in x and y directions are different. Since the emitting area of the laser is square-shaped, this indicates that the spatial coherence properties of the source differ in x and y directions. To present the results compactly we selected only the y-polarized emission for the study, but due to symmetry of the lattice, similar results are obtained for the x-polarization as well.
Here we present the equations that are necessary for the analysis of our experimental results—a detailed account and the derivation of the various quantities can be found in the supplementary information (https://stacks.iop.org/NJP/23/063037/mmedia). The electric field generated by the source is denoted by  , where
ρ
= (x, y) contains the transverse coordinates, and t is the time in the moving reference frame of the pulse. To quantify the spatial correlation properties of the field, we employ the time integrated mutual coherence function (MCF), defined as
, where
ρ
= (x, y) contains the transverse coordinates, and t is the time in the moving reference frame of the pulse. To quantify the spatial correlation properties of the field, we employ the time integrated mutual coherence function (MCF), defined as

where the angle brackets denote ensemble averaging over the pulses. If the two spatial coordinates are set to be equal, ρ 1 = ρ 2 = ρ , the time integrated MCF yields the spatial (average) intensity distribution, i.e. Γ( ρ , ρ ) = I( ρ ). The intensity can be used to define a normalized quantity

which is a measure of the complex degree of spatial coherence of the time-averaged pulsed field. Further, to get a single numerical value for the degree of coherence, we use the overall degree of spatial coherence,  , which is given by

It is possible to leave one of the spatial axes out from the above integration, thus producing overall degrees of spatial coherence along different directions, i.e.,  and
and  . This will be useful for our analysis later on.
Additionally, to quantify the beam propagation ratio reliably, we make use of the relationship between the K space (or far-field) intensity, I(r), and source plane correlation function, Γ( ρ 1, ρ 2), which in our case is given by

where  is the propagation constant at the center wavelength λ0 of the nanolaser, k0 = 2π/λ0, and
  contains the spatial frequencies also evaluated at the center frequency. The far-zone point r is linked to the full wave vector k0 = (
κ
0, k0z
) as r = r
k0/|k0|, with r = |r|. Considering the paraxial case, we can approximate k0j
≈ k0
θj
, with j = x, y, where θj
is the propagation angle, and k0z
≈ k0, after which it is possible to extract the divergence angle directly from the measured source plane correlation function. We remark that the measured source-plane coherence function is composed of waves propagating to the detector and does not contain information on the evanescent waves or (very) wide-angle propagating waves.
contains the spatial frequencies also evaluated at the center frequency. The far-zone point r is linked to the full wave vector k0 = (
κ
0, k0z
) as r = r
k0/|k0|, with r = |r|. Considering the paraxial case, we can approximate k0j
≈ k0
θj
, with j = x, y, where θj
is the propagation angle, and k0z
≈ k0, after which it is possible to extract the divergence angle directly from the measured source plane correlation function. We remark that the measured source-plane coherence function is composed of waves propagating to the detector and does not contain information on the evanescent waves or (very) wide-angle propagating waves.
The beam propagation ratio—also known as the M2 value or beam quality parameter—is generally used as a standard measure of the propagation properties of a light beam. Since the nanolaser beams considered here are not circularly symmetric but the major and minor axes of the cross-section intensity are oriented along the Cartesian axes, it is appropriate to consider the M2 values in orthogonal directions, defined for paraxial fields as [31]

where again j = x, y. Here Θj is the divergence half-angle and wj is the beam width whose definitions can be found in the supplementary information. For a completely coherent diffraction-limited Gaussian beam, the beam propagation ratio reaches unity, which is also its minimum value. It is straightforward to show that, e.g. for paraxial Gaussian Schell-model beams, the M2 value has an inverse relationship with the overall degree of coherence of the source [33], and thus the propagation ratio increases as the degree of spatial coherence reduces. The beam radius and divergence half-angle of measured data are commonly retrieved as the second moment widths—also known as the D4σ widths. We give these relations explicitly in the supplementary information.
3. Measurement schemes
The sample consists of a square lattice of cylindrical Au particles on a borosilicate substrate overlaid with a gain medium containing fluorescent IR792 molecules in BA:DMSO (2:1) solution, whose refractive index matches the substrate index. Figure 1(a) illustrates the optical setup used for the sample characterization. The sample was pumped with a circularly polarized femtosecond (fs) pulsed laser (792 nm, 1 kHz, 150 fs). Three different measurement schemes were applied, namely (1) WFI, (2) direct K space imaging, and (3) angle and wavelength resolved imaging.

Figure 1. (a) Schematic of the experimental setup. The sample was pumped with a circularly polarized femtosecond (fs) source. We selected the vertically polarized lasing signal for the sample characterization. The signal was divided into three main parts with beam splitters (BS). One part of the signal was directed to the wavefront-folding interferometer (WFI) for measuring the real space intensity distribution and spatial coherence; the second part was directed to the K space interferometer for the temporal coherence measurements and for recording the far-field intensity distribution whilst the last part was directed to the spectrometer for angle-resolved spectral measurements. For transmission measurement, a halogen light source was used. HWP: half-wave plate; LP: linear polarizer; L: lens; QWP: quarter-wave plate; M: mirror; OL: objective lens. (b) Scanning electron micrograph of the sample. The scale bar is 580 nm. (c) The WFI camera measures the interference pattern generated by the source plane intensity distribution overlapped with its replica which is flipped in both x and y directions with respect to array center. Thus WFI reveals phase correlations between points (x, y) and (−x, −y). The dashed lines indicate the flip axes.
Download figure:
Standard image High-resolution imageThe WFI characterizes the spatial coherence properties of the light emitted by the sample, see figure 1(c). The beam incident on the WFI was further divided into two arms with a 50:50 beam splitter: in one arm, the field is folded along the x direction, whereas the other arm folds along the y direction, after which the beams are recombined and directed to the camera. Therefore, the interference fringes imaged by the camera at a point (x, y) on the sample (with (0, 0) being the center of the array) indicates correlations between the source plane points (x, y) and (−x, −y). Note that the WFI is in a three-dimensional arrangement, detailed description can be found elsewhere [29, 30].
Beam divergence and autocorrelation measurements were performed by employing a Michelson interferometer for the far field emission. Angle (θy ) and wavelength resolved imaging was performed by focusing the back focal plane of the objective to the entrance slit of the spectrometer.
4. Results
Before considering the beam quality of the PLLs, we first examine its lasing characteristics. Figure 2 illustrates the measured spectra for two different pump powers (a), the wavelength and angle resolved transmission (b), the lasing output as a function of the pump power (c), and the autocorrelation of the pump and PLLs pulses (d).

Figure 2. (a) Spontaneous emission of dye molecules (top panel) and lasing signal (bottom panel) measured at 180 μJ cm−2 and 580 μJ cm−2, respectively. (b) Wavelength and angle resolved transmissivity (%) of the sample. The vertical dash line corresponds to the lasing wavelength. (c) Emission intensity and linewidth as a function of pump power. (d) The normalized autocorrelation for the pump and the PLL pulse.
Download figure:
Standard image High-resolution imageAt low pump powers (top panel of (a)), the emission of the system exhibits (1) a feature with a broad linewidth at around 844 nm, which is associated with the spontaneous emission of the IR792 dye, and (2) a second feature at 886 nm which is related to the SLR of the system.
As the excitation power increases, the PLL system transits to the lasing regime, with majority of photons occupying a very narrow spectral range, see figure 2(b). The transition is accompanied by a decrease in the linewidth from approximately 73 nm (spontaneous emission) to 1.7 nm (bottom panel of figure 2(a)) and a peak shift from 844 nm to 886 nm. Due to the narrow bandwidth of the PLL, we can treat it as a quasi-monochromatic source, in which case there is no need to make a distinction between the temporal and spectral domains when considering spatial correlations.
In order to recover the resonances supported by the lattice, wavelength and angle resolved transmission of the sample was measured, see figure 2(b). The lattice resonance at 0 degree is located at 881 nm with a natural linewidth of 9.7 nm. The recorded lasing wavelength is slightly shifted from the lattice resonance, as PLL sources are sensitive to their dielectric environment [34]. The shift can be due to the slight change in the effective refractive index, n, of the BA:DMSO solution when the IR792 dye is introduced. In addition to the environment, PLLs are also sensitive to the period P of the plasmonic lattice. The lasing wavelength is linearly dependent on these parameters, that is, λ ∝ Pn, for a symmetric system such as the one in our case. As long as the product of P and n overlaps with the gain window of IR792, lasing can be achieved.
From figure 2(c) we see the emission intensity as a function of the pump power, exhibiting a highly nonlinear behavior with increasing pump fluence. We note that increasing the pump power by 50% from 200 μJ cm−2 to 300 μJ cm−2, over 10-fold increase in the emission intensity is observed. The nonlinearity together with the narrow linewidth of the emission indicates that the overall gain in the system exceeds the losses [35], characteristic of the lasing regime. The saturation of the emission intensity at fluences above 400 μJ cm−2 is associated with the saturation of the gain medium and it is typically observed for PLLs [22].
Finally, figure 2(d) shows the measured autocorrelation for the pump and PLLs pulses, measured in the K space arm of the setup. The reference pump laser with a wider bandwidth shows an autocorrelation width of approximately 0.30 ps, whereas the PLL source has a width of τ ∼ 2.7 ps. We can use the relation Δλ = λ2/cτ to estimate the width of the lasing peak, yielding a value of Δλ ≈ 1 nm, which agrees well with the measured spectrum.
The delocalized nature of SLR modes is due to hybridization of the localized plasmon resonances with the delocalized in-plane diffracted orders [13, 14] of the lattice. In the lasing regime, a coherent transfer of energy from the gain medium to the SLR mode is bound to have an effect on the spatial coherence properties of the PLL source. The effect of increasing pump power on the spatial coherence as well as beam quality of PLL will be studied below.
Figure 3 delineates the typical intensity distributions of the PLLs on the sample surface (a) and in the far-field (b), which were captured using cameras 2 and 1, respectively. In figures 3(a) and (c), essentially similar widths of emission intensity along x and y axes are observed. The narrow emission linewidth observed in the lower panel of figure 2(a), at pump power 580 μJ cm−2, suggests that the overall emission is governed by stimulated emission processes. This observation, together with similar widths of emission along x and y axes in figures 3(a) and (c) might lead one to expect an equal intensity distribution for the far field emission as well. However, this is not the case. Instead, a very pronounced asymmetry between x and y directions is observed for the far-field intensity patterns in figures 3(b) and (d). We note that for x-polarization, a similar intensity pattern is observed, but in this case the intensity distribution is strongly localized along y-direction and delocalized in x-direction, see figure S1 in the supplementary information.
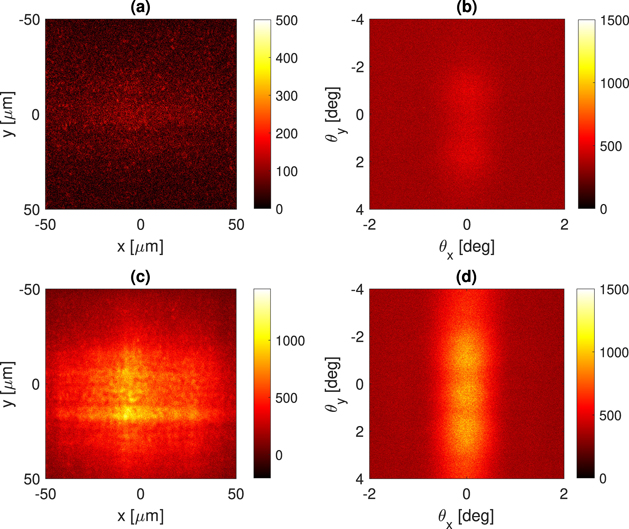
Figure 3. Illustration of the source plane (a) and (c) and far-field (b) and (d) intensity distributions. The pump-power for (a) and (b) is 275 μJ cm−2, and for (c) and (d) is 625 μJ cm−2. Measured parameters (a): wx = 48.63 μm, wy = 39.98 μm, (b): Θx = 0.93°, Θy = 4.11°, (c): wx = 43.20 μm, wy = 43.00 μm, (d): Θx = 0.79°, Θy = 3.55°.
Download figure:
Standard image High-resolution imageWe hypothesize that this asymmetry has its origin in the polarization dependent feedback mechanism of the PLL. The PLL studied here is based on the hybridization of the dipolar single particle plasmon resonance with the diffracted orders of the lattice. The feedback is established via polarization dependent radiative coupling between particles. For y polarization, the induced dipole moment in a particle will also be oriented along y direction, resulting in radiation primarily along x direction. Notably, such a dipole has negligible radiation along y direction. In figure 4, we employ a multiple scattering T-matrix method [36, 37] to study how a single nanoparticle driven with a y-polarized field radiates in a finite-size square lattice. The parameters, including the SLR frequency, periodicity, size and shape of the particles as well as dielectric functions of the materials used are matching those of the experiments. Note, however, that due to computationally demanding model, the particle number was limited to 71 × 71 in both x and y directions.
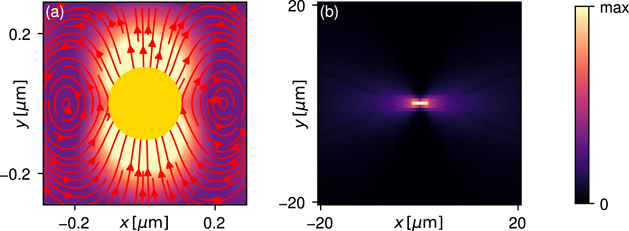
Figure 4. Simulated propagation of a local dipole excitation in a 71 × 71 nanoparticle array, obtained with the multiple-scattering T-matrix method. In the particle in the center of the array we artificially induce an electric dipole in the y direction at the frequency ω = 1.385 eV/ℏ, causing it to radiate; (a) shows the unit cell with a field pattern radiated by the central particle. The radiated field is further scattered by the other particles, propagating predominantly along the x direction and inducing y oriented electric dipoles in the other scatterers; the magnitudes of the induced y dipoles are shown in (b).
Download figure:
Standard image High-resolution imageFigure 4(a) shows both the electric field intensity in the unit cell of the driven particle, as well as the polarization currents related to the y-polarized dipolar excitation. In figure 4(b) the magnitude of induced dipole moments along y direction are plotted in a finite (71 × 71) particle lattice. Two conclusions can be drawn immediately, namely: (1) the dipole strength is highest in the center of the lattice, where the single particle is driven, and (2) the dipole radiative coupling along y direction is negligible, whereas the coupling along x direction is significantly stronger. In nonlinear response regime such as lasing, this polarization related asymmetry is expected to have profound effects on system response. In particular, the spatial coherence of the lasing signal at the nanoparticle (source) plane is expected to exhibit strong asymmetry between x and y directions.
An example of the spatial coherence measurement of PLL laser is presented in figure 5. The obtained interference pattern and its Fourier transform are shown in (a) and (b). The absolute value of the degree of coherence (c), as well as the corresponding phase (d) were obtained numerically from the measured interference image by utilizing equation (2), see also methods. Note that the interference at the WFI results from two source plane images of the PLL, which are flipped with respect to the center of the lattice in both x and y directions. Notably, the interference fringes are very pronounced along a horizontal line at Δy = 0. This suggests that in x direction there are well defined phase correlations that extend over the whole lattice. The spatial coherence is essentially limited by the size of the lattice in figure 5(c). Strikingly different behavior can be observed in the y direction: the fringes are pronounced only in a narrow region around Δy = 0. The strong asymmetry is also apparent in the obtained overall degrees of coherence given by equation (3):  , and
, and  in the x and y directions, respectively. The corresponding beam parameters are wx
= 43.28 μm, wy
= 43.85 μm, which we get from the WFI measurement, such as figures 3(a) and (c), and Θx
= 0.80°, Θy
= 4.38° estimated from K space measurements, such as figures 3(b) and (d).
in the x and y directions, respectively. The corresponding beam parameters are wx
= 43.28 μm, wy
= 43.85 μm, which we get from the WFI measurement, such as figures 3(a) and (c), and Θx
= 0.80°, Θy
= 4.38° estimated from K space measurements, such as figures 3(b) and (d).
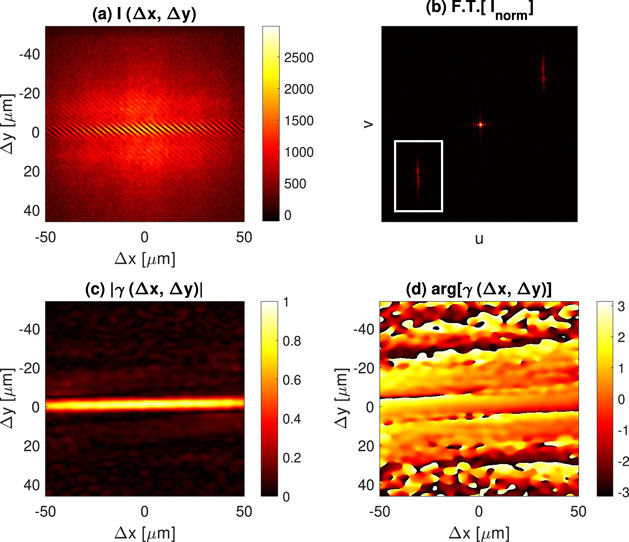
Figure 5. WFI measurement of the PLL source pumped with a fluence of 575 μJ cm−2. (a) Interference fringes obtained with both arms open. (b) Fourier transform of the normalized interference pattern. (c) and (d) Are the respective complex degree of spatial coherence and its phase.
Download figure:
Standard image High-resolution imageWe associate the strong asymmetry observed in figures 5(a) and (c) to the radiative feedback mechanism provided by the dipolar y polarized plasmon resonances of the lattice. In x direction, the radiative feedback is sufficient to phase lock the lasing signal. The negligible radiation intensity of y polarized dipoles in the y direction, however, is not sufficient to provide a phase locking across the whole lattice. The phase of the degree of coherence is presented in figure 5(d), confirming that the phase is almost constant along x direction. This is in agreement with the interpretation that the nanolaser feedback is based on constructive interference of the y-polarized radiation fields at each particle location.
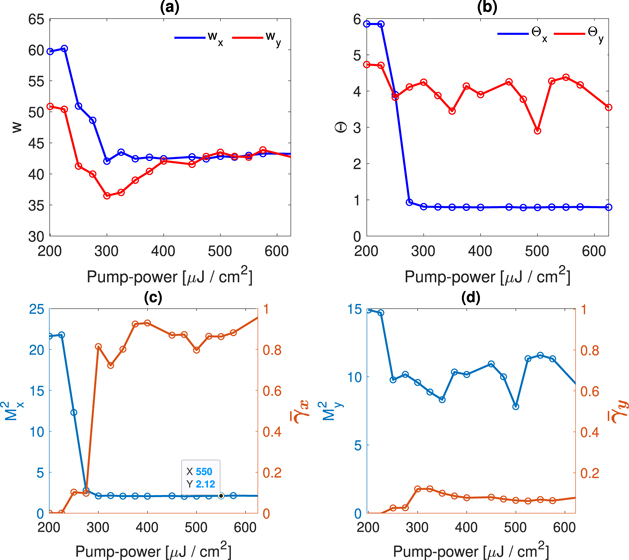
Finally, in figure 6, we present the measured half-widths along the x and y directions at the source plane (a) and in the far field (b) as a function of pump power. From these values and with the help of equation (5), we computed the M2 values and superposed them with the corresponding overall degrees of coherence in (c) and (d).
Figure 6. Evolution of the measured beam radii as a function of pump power. (a) The source plane beam widths, and (b) the far-field angular widths of the PLL radiation. (c)  , and (d)
  superposed with the effective degree of coherence as a function of pump power. Blue: M2 values, orange: overall degrees of coherence.
Download figure:
Standard image High-resolution image
By employing equation (4), we retrieve an estimate for the angular distribution from the measured coherence data, which was compared to the measured far-field intensity distributions, see figure 7 in the supplementary information. Finding good agreement between the Fourier transformed and directly measured angular intensity distributions along the x direction, we conclude that for characterizing the beam along y axis the computed distribution was more suitable, since the measured far-field distribution is not entirely collected by the camera (see supplementary information). From the source plane and far-field intensity distributions, we calculated the M2 values for x and y directions separately. In figure 6(c), we observe a strong increase of the overall degree of coherence with increasing pump power accompanied by a reduction of M2 value. Notably, this abrupt behavior takes place at pump fluences around 250 μJ cm−2, which corresponds to the lasing threshold, see figure 2. This highlights the crucial role of the stimulated emission processes to the coherence and beaming properties of the nanoparticle array. Around 300 μJ cm−2 pump fluence, the overall degree of coherence exceeds 0.9, while the beam quality factor along the x direction attains its minimum value  , which is fairly close to ideal M2 = 1 for Gaussian beams. Notably, this value was obtained without any particular optimization process, indicating significant application potential of plasmonic nanolasers.
Figure 6(d) shows similar data for y direction, where significantly different behavior is observed, and the  stays around 10. The different beaming properties along x and y directions highlight the crucial role of the polarization dependent radiative feedback in plasmonic nanolasers. Finally by comparing figures 6 and 2 we find that both the intensity as well as the coherence properties remain essentially constant above 300 μJ cm−2 pump power. This power can therefore be regarded as a threshold level, above which further increase in pump power provides little contribution to the stimulated emission or beaming properties of the PLL source, thus stabilizing the system. While M2 = 1 for a perfectly coherent, Gaussian light source, both partial coherence and non-Gaussian intensity distribution can contribute to increased M2 values. Importantly, the measurement scheme employed here allows for distinguishing the relative contributions from these two physically different effects. In x direction, where the overall degree spatial coherence is close to unity, the M2 value is limited by the non-Gaussian intensity distribution at the source plane. In the y direction, where the source can be considered as quasihomogeneous, the increase of the M2 value is due to the low overall degree of coherence. A more detailed discussion based on simple analytical models is presented in supplementary information. We note that for instance photonic crystal surface emitting lasers with asymmetric holes can exhibit Watt-range output power [38] with M2 ⩽ 1.1. In comparison, the PLL reported here with
  and
and  has obviously lower performance. To explore the full potential of plasmonic lasers, however, further studies with polarization specific measurements, as well as variation of system parameters such as gain material, particle size and shape as well as various lattice geometries are needed.
5. Conclusions and discussion
To conclude, we have presented a detailed study of the beaming properties of a PLL. A strong asymmetry between x and y directions is observed for both spatial coherence at the source plane and beam divergence in the far field. This asymmetry has its origins in the polarization dependent radiative feedback between plasmonic nanoparticles. In x direction, where the radiative feedback from y-polarized dipole resonance is efficient, we observe spatial coherence length that is limited by the lattice size, and M2 values reaching 2.12 with sufficiently high pump powers. In y direction, where the radiative feedback is not efficient, we observe spatial coherence length and M2 values on the order of 5 μm and and 10, respectively. Future prospects include extending the presented methodology for non-paraxial case as well as for vector beams with nontrivial polarization properties [23, 24, 39].
By engineering the PLL lattice parameters, attaining complete control over its M2 characteristics might be possible. By utilizing, for instance a honeycomb lattice, radiative coupling in 2 dimensions has been demonstrated [40, 41]. By increasing the particle size, more symmetric scattering to x and y directions may be achieved due to increased contribution of the higher order multipolar resonances. For instance, one might consider utilizing the dark mode of a PLL which is based on hybridization of the diffracted order of the lattice with the quadrupole resonance of the plasmonic nanoparticle [22, 42]. In this case, the x–y asymmetry of the dipolar resonance is lifted and more symmetric feedback in the x and y directions of the lattice may be possible. Yet another possibility would be to tailor the particle size or shape in each unit cell in order to obtain ideal Gaussian intensity distribution of the scattered fields at the source plane. In such a case, one would expect PLL M2 value to approach unity. Similar approach could be used to achieve highly non-Gaussian, more exotic beams: by proper tailoring of the scattering intensity, and perhaps the phase distribution in each unit cell at the source plane, any desired beam profile could in principle be produced. Thus, PLLs provide a fertile platform for beam engineering with performance that might match and functionalities that could exceed that of the conventional lasers.
6. Methods
6.1. Samples
The samples were fabricated as follows: a positive tone resist (Allresist) was spin-coated onto the substrate. Electron-beam lithography was used to define 100 nm diameter cylindrical holes in a square lattice with periods, Px = Py = 580 nm. The array size was 100 × 100 μm2. A thin layer of Ti (2 nm) was sputtered on the developed sample as an adhesion layer. Thereafter, a 50 nm thick gold layer was thermally evaporated, and the final sample was obtained by a lift-off process. The scanning electron micrograph of the sample is shown in figure 1(b). A silicon isolator ring and a borosilicate glass slide were attached to the sample surface to form a compact chamber for the liquid. To measure the transmission of the sample, the chamber was filled with benzyl alcohol:dimethyl sulfoxide (BA:DMSO) in a ratio of 2:1 to form a symmetric dielectric environment matching the refractive index of the substrate (n = 1.52).For the lasing measurements, IR792 dye molecule was dissolved in (BA:DMSO) solution to form a 25 mM concentration.
6.2. Measurements
The sample was pumped with a circularly polarized fs pulsed laser (792 nm, 1 kHz, 150 fs, 45° angle of incidence), see also figure 1(a). The power was controlled with a motorized rotating half-wave plate (HWP1) in conjunction with a linear polarizer. The emitted lasing signal was collected with an objective lens (10x). Lens L2 images the sample plane to the plane of the iris, which was used to spatially limit collection of the emitted light to the sample area. A linear polarizer was used to select the y-polarized lasing signal, which corresponds to feedback in the x direction. Following the polarizer, three different measurement schemes were utilized. First, a 50:50 beam splitter (BS1) was used to direct part of the beam to the WFI. The remaining beam was further divided by BS2 for K space interferometry and angle resolved spectral measurements. For both WFI and K space interferometry, FLIR Grasshopper 3GS3-U3-32S4M-C cameras were used. The WFI details can be found elsewhere [29, 30]. The K space interferometry signal from BS2 was further divided into two; one part was flipped vertically using retroreflecting hollow roof prism and the other part reflected from a mirror. The delay to one of the beams was introduced by moving the retroreflector. The K space interferometry was performed for both the PLL source and the excitation pulse to compare their temporal profiles. The angle and wavelength resolved imaging was performed by imaging the backfocal plane of the collection objective to the entrance slit of the spectrometer (Kymera i193, Andor). For the angle and wavelength resolved transmission measurements, a halogen lamp was used as a light source.
6.3. Obtaining the complex degree of coherence from the measured WFI interference data
The complex degree of coherence was calculated using Fourier signal processing [29, 30]. Since the measured interference pattern is real-valued, it leads to two maxima in the Fourier space, which carry identical information. For data analysis, we select the component corresponding to the positive frequency, see figure 5(b). It is also important to note that this Fourier transform is directly proportional to the K space (far zone) intensity I(r), as discussed in the theory section and in supplementary information. The complex degree of coherence is obtained by inverse Fourier transforming the positive frequency Fourier component back to the spatial domain (and multiplying by two, since the negative frequencies are lost).
Acknowledgments
The work was funded by the Academy of Finland (Projects 322002, 308393, 310511). The work is part of the Academy of Finland Flagship Programme, Photonics Research and Innovation (PREIN), decisions 320166 and 320165.
Data availability statement
All data that support the findings of this study are included within the article (and any supplementary files).