


Abstract
Directly imaging all atoms constituting a material and, maybe more importantly, crystalline defects that dictate materials' properties, remains a formidable challenge. Here, we propose a new approach to chemistry-sensitive field-ion microscopy (FIM) combining FIM with time-of-flight mass-spectrometry (tof-ms). Elemental identification and correlation to FIM images enabled by data mining of combined tof-ms delivers a truly analytical-FIM (A-FIM). Contrast variations due to different chemistries is also interpreted from density-functional theory (DFT). A-FIM has true atomic resolution and we demonstrate how the technique can reveal the presence of individual solute atoms at specific positions in the microstructure. The performance of this new technique is showcased in revealing individual Re atoms at crystalline defects formed in Ni–Re binary alloy during creep deformation. The atomistic details offered by A-FIM allowed us to directly compare our results with simulations, and to tackle a long-standing question of how Re extends lifetime of Ni-based superalloys in service at high-temperature.
Export citation and abstract BibTeX RIS

Original content from this work may be used under the terms of the Creative Commons Attribution 3.0 licence. Any further distribution of this work must maintain attribution to the author(s) and the title of the work, journal citation and DOI.
1. Introduction
Single atom analysis of the structure and composition of matter is of the utmost importance since materials are nowadays designed at this scale. This applies particularly to the quantification of solute decoration at crystalline defects which determine many properties of advanced materials. Valiant efforts have been reported by transmission electron microscopy (TEM) combined with x-ray-based or electron-energy-loss spectroscopy [1]. The inherently three-dimensional nature of dislocations and grain boundaries limits the accuracy of techniques integrating signal through the thickness of a specimen, like conventional TEM. Modern approaches, involving intensive computation, have come close to true atomistic reconstruction through tomography or focus-series [2–4] on model material systems. High-resolution TEM (HR-TEM) performed on specimens prepared for subsequent APT analysis is close to providing the necessary structural and compositional information [5]. Yet, again, TEM provides a two-dimensional, projected image, and the accuracy of APT is limited by trajectory aberrations, precluding direct matching of atomic positions and elemental identity.
Field-ion microscopy (FIM) was the first technique allowing to image individual atoms [6, 7]. It relies on the ionization of an imaging gas, usually a rare gas, caused by an intense electrostatic field generated at the surface of a specimen shaped as a sharp needle. Electrons from the field-ionized gas atoms tunnel through vacuum into the surface, and the ions are projected onto an assembly made of micro-channel plates and a phosphor screen. FIM has brought valuable insights into the structure of crystalline defects, e.g. dislocations and grain boundaries [8, 9], in pure metals. The nature of the contrast in FIM has been under debate [10, 11], in particular when atoms from different species are involved. The brightness of an imaged atom is expected to be related to its elemental identity as well as to the local topology of the surface, and distinguishing the contribution between these two aspects has so far not been achievable. FIM predates APT, but its analytical capacity enabled APT to rise in importance, despite a significant loss in spatial resolution, whereas FIM is barely used nowadays.
Here, we introduce a dual approach to turn FIM into an analytical single-atom microscopy technique with true atomic resolution in three-dimensions. For this purpose, we develop an insitu time-of-flight mass-spectrometry (tof-ms) FIM protocol and employ advanced data-filtering techniques to associate an imaged position with an elemental identity. In parallel, we use Tersoff–Hamman-type image simulations via density-functional theory (DFT), to support elemental contrast interpretation of the signal produced by the image gas. This is an interpretation technique known from scanning tunneling microscopy (STM). The in situ tof-ms enables elemental sensitivity to complement the intrinsically unparalleled spatial resolution of FIM. Realizing these two independent sets of evidence in a single experiment allows us to render FIM chemistry-sensitive, thus revealing position and type of individual atoms.
We showcase the strength of the method on a long-standing problem in alloys designed for high-temperature applications: how Re interacts with crystalline defects to help extend the creep lifetime of Ni-based superalloys in jet engines, enabling higher operating temperatures and fuel efficiency [12, 13]. The alloys are hardened by coherent L12 ordered γ' precipitates formed in a disordered face-centered cubic γ matrix. The third generation of superalloys contains only 5–6 wt% Re (2 at%) which increases creep life by a factor of almost two [14–16]. Re partitions strongly to γ [17–19], but experimental results on its distribution have been conflicting [15, 20]. To answer the question of how Re can impart higher creep life by partitioning to γ, we selected a model Ni–Re binary alloy containing 2 at% Re. This alloy was creep deformed to see if Re can decorate dislocations in this material, to elucidate the creep life enhancement mechanisms.
2. Experimental details
Details of the manufacturing and heat treatment of the single crystal rod of the Ni with 2 at% Re can be found elsewhere [21]. A cylindrical specimen was then subjected to uniaxial compression in a pneumatic compression creep testing machine (Insitron 405) at a constant applied stress of 20 MPa at 1050 °C until a plastic strain of 5.5% was reached within 14.3 h.
Specimens for FIM and APT were prepared on a FEI Helios PFIB. The usual protocol by Thompson et al [22] was followed in a Xe-plasma FIB, with milling current at 30 KeV between 0.46 nA ∼ 24 pA and a final cleaning at 5 keV and 24 pA to remove a possibly damaged regions. The APT experiments were conducted on a Cameca LEAP 5000 XS.
For FIM, ultra-high purity Ne gas was supplied directly into the analysis chamber via a manually controlled leak valve. The gas pressure was adjusted so as to maintain a pressure in the range of 1.3 ± 0.5 10−7 mbar. Time-of-flight FIM was performed on the same instrument, with high-voltage pulses and a pulse fraction of 20%. A similar approach with laser pulses was recently discussed in [23].
The APT data reconstruction and post-processing was done in the commercial software IVAS 3.8.2. FIM data extraction in the form of a .epos file came from the same software package, and further processing was done via in-house built routines in MATLAB.
3. Characterization
3.1. Atom probe tomography
Needle-shaped specimens were initially characterized by APT (figure 1 (a)). The measured Re composition is 1.9 ± .05 at%, i.e. very close to the nominal composition. No tendency for Re clustering was found in the histogram of Re first nearest-neighbor distances that rather matches a random distribution (figure 1(b)), in agreement with previous reports [20]. To best mimic the structure of a deformed sample, we used the large-scale atomic/molecular massively parallel simulator (LAMMPS) software package to perform molecular dynamic simulations of pure Ni highly deformed under uniaxial tension. The resulting atomic positions were used an input for image simulations of APT. Using dislocation analysis (DXA) [24] in OVITO [25], all dislocations were identified in the input file. About 2% of Re atoms were randomly placed Ni sites, and a 20 at% concentration of Re (20%) were positioned on stacking faults. Using this approach, a local enrichment of Re close to dislocations is generated. A subset of the original input data is shown in figure 1(c). This virtual specimen was field evaporated using the Robin-Rolland model [26]. Because it is meshless, it is particularly well-suited to model field evaporation of non-regular distribution of atoms, i.e. at or near defects. The evaporation fields of Re atoms was set to 1.3 times the evaporation field of Ni atoms, and following field evaporation, the data was reconstructed [27]. A section of the resulting three dimensional reconstruction is displayed in figure 1(d). The distance to the first Re nearest-neighbor performed for the input data and reconstructed data are plotted in figure 1(e) and (f) respectively. The former shows a clear peak at approx 0.23 nm corresponding to the agglomerated Re at the defects.
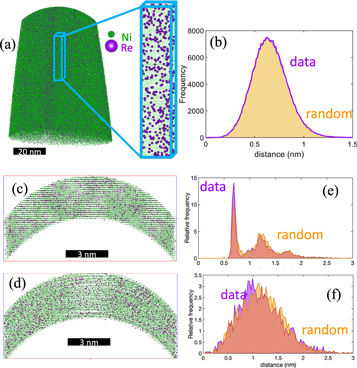
Figure 1. (a) Typical reconstruction from an atom probe analysis of the deformed Ni2Re alloy, with a close-up on the (002) atomic planesx imaged within the dataset, and (b) corresponding histogram of the distance between a Re atom and its first Re nearest-neighbor. (c) Simulated deformed pure Ni, in which Re atoms were introduced, to be used as input into APT image simulations. (d) Tomographic reconstruction calculated for the simulated data. (e)–(f) First Re nearest-neighbor analysis for the input and reconstructed datasets.
Download figure:
Standard image High-resolution imageHowever the latter conforms to a random distribution, because of the severe trajectory aberrations arising from the close proximity of Re atoms that lead to very sharp protrusions at the specimen's surface during field evaporation and hence to highly divergent trajectories [28]. To avoid this blurring of the atomic position that hinders identification of the segregation, the atomic positions should be imaged prior to field evaporation. This is achieved by doing FIM on the specimen.
3.2. Field ion microscopy
FIM was therefore performed, here with Ne as imaging gas at a pressure of 10−7 mbar in the same instrument, using the position-sensitive, time-resolved detector typically used in APT. A digitally recalculated field-ion micrograph is shown in figure 2(a), along with a close-up on a (022) terrace displayed in figure 2(b). The edge character of the dislocation can be seen emerging from the terrace, highlighted, in the close-up by the yellow lines where an extra half-plane is present. The tensile region of the dislocation is decorated by two brightly-imaging atoms. To evaluate the reasons for difference in imaging contrast for the atoms density functional theory was employed.
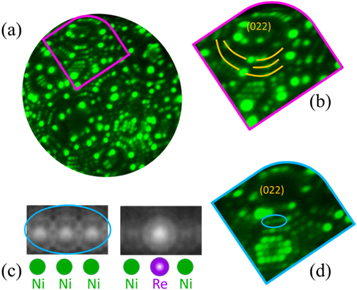
Figure 2. (a) Field ion micrograph and (b) close-up on the (022) planes indicated by the pink box. The presence of a dislocation is highlighted with the light orange lines, as an additional half-plane appears on the right side of the pole. (c) DFT-simulated contrast from the presence of a Re atom in the steps at (022) facets running along 〈100〉. This terrace is indicated by the blue ellipse in (d).
Download figure:
Standard image High-resolution image3.3. Density functional theory for contrast interpretation
The field ionization process that leads to the formation of the image occurs mainly in an 15 pm thick shell 400–1000 pm above the surface atoms [6]. The field ionization is due to the tunnelling of electrons from these gas atoms. Noting that this behavior is formally equivalent to the tip in STM allows us to employ the approach known as the Tersoff–Hamann approximation [29]. According to this concept, the electron transfer probability in a 3D scattering theory is proportional to the local density of states (DOS) at the position of the STM-tip.
We used DFT in the local-density approximation using the projector-augmented wave approach [30] as implemented in the SPHInX code [31]. The surfaces were modelled in the repeated slab approach, with a thickness of six layers along the (011) normal (approx 1.4 nm) and a vacuum separation of 1.5 nm. The slabs were subject to a field of 50 V nm−1 on one side using the generalized dipole correction. Owing to the difficulty of convergence in DFT for high fields, a field of 50 V nm−1 was chosen. Test calculations show that variations in the field strength by over 10% do not qualitatively change results. The imaging plane in the vacuum for the DOS calculation was chosen such that the average electrostatic potential on that plane corresponds to 20.8 eV above the Fermi energy, i.e. the ionization threshold for Ne. There is some lateral variation of the potential of the order of a few tenths of an eV. Unoccupied states up to 0.5 eV above the Fermi level (sharp cut) were included; the occupied states are cut by an artificial Fermi function (ekt = 0.1 eV).
We performed DFT calculations on steps at (022) facets in Ni running along 〈100〉 lines, where individual atoms are experimentally resolved and the probability to transfer an electron from the Ne imaging gas to the surface can be accurately simulated [32]. The local DOS was calculated in a plane above a stepped surface, with three step atoms in the view, first for three Ni atoms, then a Re atom with a Ni atom on either side, as depicted in figure 2(c), under an electric field of 50 V nm−1. The Ni/Re contrast is dominated by the tunneling of spin majority electrons. The DOS of bulk Ni has a fully occupied d-band in the spin majority channel, so in the absence of field no additional electrons can tunnel. Re has d-band states above the Fermi level for both spins. As the empty spin-majority Re d-states cannot couple to Ni states, the electrons remain very localized. In the spin-minority channel, the wave-function is much more delocalized over Re and Ni states. The picture for spin-minority only in the Re case is very similar to the case of pure Ni. Re is hence expected to appear brighter, while the neighboring Ni-atoms should appear dimmer.
3.4. Analytical Field ion microscopy
To support such contrast interpretation from DFT, we obtained experimental confirmation by performing tof-ms during FIM. Historically, the implementation of a mass spectrometer on a field ion microscope became the atom probe, that later became APT. However, APT is performed under ultra-high vacuum conditions. Here, we maintained an imaging gas pressure of approx 10−7 mbar, allowing to map the specimen surface at atomic resolution via imaging gas field ionization while performing tof-ms. Field evaporation of the surface atoms is triggered by high-voltage pulses superimposed to the best imaging voltage. We estimate that the rate of imaging gas ionization is three orders of magnitude higher than the rate of field evaporation, i.e. the atom is imaged thousands of times prior to leaving the surface. The mass spectrum from the analysis is shown in dark blue in figure 3(a). The high level of background hinders direct identification of specific mass-to-charge peaks. However, the field desorption and ionization of an adsorbed image-gas atom and the field evaporation of a surface atom are highly likely to be concomitant and hence be emitted by a single pulse making them temporally and spatially correlated [33]. We therefore developed spatial and temporal data filtering, i.e. selecting ions detected on multiple events [34] and arriving within only 2 mm of each other on the detector. The corresponding spectra are shown in blue and light blue respectively in figure 3(a). The associated enhancement of the signal-to-background ratio allows to unmistakably identify peaks pertaining to Re. The position of the ions that have a mass-to-charge corresponding to Re are overlaid on the FIM images that are simultaneously acquired during the field evaporation of the specimen, as shown in figure 3(b). The field evaporation of a brightly-imaging atom in FIM leads to the systematic detection of a Re atom, thereby making this association a truly analytical FIM.
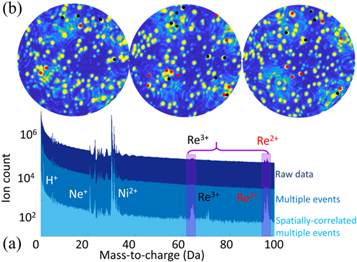
Figure 3. (a) Mass spectrum obtained before filtering (in dark blue), after filtering for multiple hits (blue) and after application of the spatial filtering (light blue), allowing to clearly distinguish peaks pertaining to Ni and Re. (b) Extracted Re chemical signatures overlaid on the concurrent FIM images.
Download figure:
Standard image High-resolution imageHowever, owing to the inherent detection efficiency of the atom probe and that of the filtering algorithm, not all Re imaged by FIM can be associated to Re ions found in the mass spectrum. In addition, because of the high flux of ions generated, the association of a Re ion with a gas ion in the same pulsing window is not straightforward. Based on the composition of Re in the alloy, the current AFIM filtering method yields a detection efficiency ∼25%. More work is ongoing to improve the signal processing to enhance this efficiency.
4. Discussion
Since the atomic imaging is performed prior to the surface atom's field evaporation, analytical-FIM is much less sensitive to the trajectory aberrations that limit APT's spatial resolution. Figure 4(a) is a field ion micrograph of another specimen from the same crept Ni–Re alloy. In figure 4(b), we show a series of images recorded as the specimen gets field evaporated around a (204) pole that shows the typical spiral-shaped contrast of a dislocation intersecting this set of planes. The slight decrease in spatial resolution and contrast, due to combined presence of the defect and brightly imaging Re atoms, does not allow for full atomic reconstruction in 3D at this specific position, yet the distribution of individual Re atoms and the trace of each evaporating plane are clear. A volumetric reconstruction from these images is shown in figure 4(c) indicating how Re is distributed in three-dimensions. The A-FIM and DFT calculations allow us to evaluate the composition from the FIM images. The bulk composition can be estimated by counting the number of atoms within a shell of the material at the surface of the specimen, the area of which was determined by measuring the radius of the specimen. The Re composition is 1.94 at% close to the composition of the alloy measured by APT. However, the error, difficult to estimate, is likely large due to the relatively low statistics.
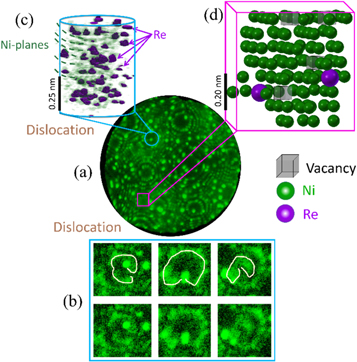
Figure 4. (a) Field ion micrograph of the specimen. (b) Spiral and split contrast seen on the (204) pole indicative of the presence of a dislocation. (c) Reconstructed volumetric image stack of ten planes revealing the local distribution of Re, seen in (b); the faint green lines are traces of the successive Ni-planes that are field evaporated and indicated by the green dashed line; the purple isosurface delineates regions of very bright contrast and highlights the Re atoms. (d) Three-dimensional reconstruction of 103 atomic positions on the set of eight (135) planes that do not contain a dislocation. Individual vacancies are imaged and displayed as translucent grey cube.
Download figure:
Standard image High-resolution imageThe Re composition around the poles in FIM was estimated based on counting the number of Re atoms in an image through thresholding and identification of individual atoms as outlined in ([35]). The composition at the reconstructed (204) pole can be estimated as the local radius is known via ring counting [36] and the number of (204) planes evaporated are known. The composition of brightly imaged Re atoms in figure 4(c) could be determined to be on average 7.5 ± 1.8 at% Re segregated over 20 (204) planes evaporated. The atomic resolution of FIM at a high index (135) pole allows to build a fully atomically-resolved three-dimensional reconstruction using the image processing protocols introduced by Katnagallu et al [37], as shown in figure 4(d). Ni and Re atoms are respectively green and purple spheres, while vacancies are represented as translucent dark grey cubes. In figure 4(d), eight terraces of (135) pole were evaporated in a sequence of FIM images over which 103 atoms evaporated. As the original images were relatively noisy, an additional image processing routine was employed. Similar to averaging method in [37], the images were averaged to improve the signal-to-noise ratio and a logarithmic filter on the intensities was applied owing to the severe contrast between Re and Ni atoms. The atom positions were extracted using the atom detection algorithm described in [37]. However, for an efficient plane classification in the images required manual input due to the retention of Re atoms at the surface. Vacancies and Re atoms often appear in close proximity, which could be related to slight attractive interactions discussed by Schuwalow et al [38], however the statistics here remains limited.
As shown in figure 2(b) and figure 4(c), Re shows a clear tendency to decorate the defects. In figure 4(c) it was difficult to evaluate the nature of the dislocation, however in figure 2(b) it is evident that Re has decorated the tensile region of the edge dislocation. Such decoration was seen in multiple edge dislocations in the same alloy. However, APT was not able to identify this, owing to amplified trajectory aberrations due to presence of defect and Re atoms.
4.1. Bond order potentials
Next, we used atomistic simulations so as to rationalize the segregation of Re to the tensile regions of edge dislocation in the bulk of the material revealed in figure 2(b) for a dislocation with an edge character intersecting the (022) pole. Modelling segregation of solutes to dislocations is challenging owing to the antipodal requirements of an accurate description of the bond chemistry and large-scale simulations of the long-range strain fields of edge dislocations.
The possibility of specific interactions between crystalline defects and Re was investigated by DFT, yet, the results were contradictory [38–41]. For Re in superalloys, recent work showed indication of Re segregated to interfacial dislocations in a crept state [42], without allowing to quantitatively resolve its distribution at the atomic scale and using a potential that is known to have deficiencies [43], indicating only a low binding energy of Re to vacancies unlikely to significantly slow down their diffusion [38]. Liu et al [35] used DFT combined with a lattice Green-function boundary condition treatment to derive the binding energy of Re to a split dislocation in Ni. These results suggested that Re should segregate to the stacking fault rather than to the adjacent core of the partial dislocations.
We simulated the interaction of Re with an edge dislocation by a combination of tight-binding (TB) and analytic bond-order potentials (BOP) [44] using a new parameterization for the Ni–Re system. In parallel, we use DFT to determine the binding energy of Re to a (111) stacking fault in Ni (see Methods). The TB/BOP model provides a transparent description of bond chemistry [45] suitable for large-scale simulations [46], while DFT provides accurate energetics.
The spin-polarized DFT calculations of Re segregation to a pure stacking fault were performed using the VASP software package ̛[47] with the Perdew–Burke–Ernzerhof [48] exchange-correlation functional, projector augmented-wave (PAW) [30] pseudopotentials and a plane-wave basis with 400 eV cut-off energy. For the three supercells with 4, 8 and 16 atoms per (111) stacking-fault layer and 11 layers in [111] we used Monkhorst–Pack [49] k-point meshes of 10 × 10 × 2, 5 × 10 × 2 and 5 × 5 × 2, respectively. Using an electronic convergence of 10−6 eV, the atoms were relaxed until a maximum force of less than 10−2 eV/Å. Our DFT calculations predict an attractive interaction of Re with the two symmetry-equivalent layers of the stacking fault with an energy of 120 meV for a concentration of 1/4 Re atoms per stacking-fault layer and 100 meV in the dilute limit of 1/32, in agreement with literature [50].
The TB/BOP calculations are performed with the BOPfox [46] using a non-magnetic d-valent Hamiltonian in analytic BOP [44] and k-space TB, respectively. The parameters for the Ni–Re system are obtained by down folding the DFT eigenspectrum to a tight-binding minimal basis [51] followed by an optimization with an additional pairwise repulsive term to reproduce properties of Ni-Re bulk phases. The TB/BOP model used here gives a stacking fault energy in Ni γISF approx 120 mJ m−2, in good agreement with literature [50, 52].
For the TB/BOP simulation an a/2[110] edge dislocation is introduced into a Ni supercell with 3200 atoms that, upon relaxation, dissociates into two a/6[112] partials separated by a (111) stacking fault. Simulations are performed in slab calculations with periodic boundary conditions in the stacking fault plane and 12 atomic layers above and below the fault plane. The slab is repeated two times along the dislocation line of the partials, equal to a distance of 8.63 Å, distance between the Re atom and its periodic image. A Re atom is then introduced at different positions to investigate the energetics of segregation to the dislocation partials and the stacking fault in Ni. After atomic relaxation for each Re position, the binding energy of Re to the dislocation is determined with respect to the formation energy of the dislocation and the solution energy of Re as:  with a value of zero in the limit of no Re-dislocation interaction and negative values for attractive interaction.
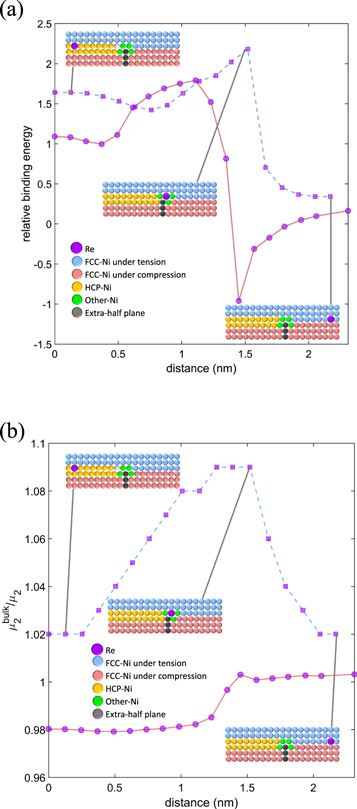
We report the binding energy relative to the absolute value of the binding energy of Re at a pure stacking fault derived from the BOP. The tensile part of the dislocation is approximately twice more attractive than the stacking fault. The second moments of the electronic density of states of the Re atom at different positions can be compared to that of the bulk, μ2bulk /μ2, which provides an estimate of the local volume available to the atom. In this position, the Re atom has the largest local volume available, as shown in figure 5(b). The compressive part of the partial dislocation is considerably repulsive for Re. The tensile region of the planar fault is also attractive, in agreement with DFT, and it is relatively more attractive than the compressive region. Segregation of Re to full or split edge dislocations results in a reduction of the system's energy and is hence highly favorable.
Figure 5. (a) Relative binding energy of Re at a stacking fault plotted as a function of the distance to the centre of the stacking fault in the tensile (squares, light blue line) and compressive layers (disks, light red line). The atomic models of the corresponding specific configurations are included inset. (b) Relative atomic second moments of the electronic density of states from the BOP plotted as a function of the distance to the centre of the stacking fault in the tensile (squares, light blue line) and compressive layers (disks, light red line). The atomic models of specific configurations are included inset.
Download figure:
Standard image High-resolution image
From the experiments and the calculation, it is evident that Re segregates to dislocations. In order to improve creep life, to impose a drag force [21] capable of slowing dislocation climb [39], the diffusivity of Re should be comparable to the climb velocity of dislocations. The dislocation velocity at 1050 °C and under a load of 20 MPa was compared to the velocity of the diffusing Re atom, in order to see if Re could exert a drag force on a moving dislocation. ur Rehman et al [39] reported estimations of the dislocation velocities in the Ni–2Re alloy is approximately 2 nm s−1. Karunaratne et al [55] reported the diffusion coefficients. The diffusion length √(D t) for a Re atom under the same conditions in 1s is approx 8 nm. These values are comparable, and it is hence possible that Re imposes a drag on the dislocation. As a comparison, W and Ta diffuse approx 17 nm and approx 52 nm in 1s respectively, i.e. much faster than Re, which means that they would not hinder the dislocation movement as strongly as Re, consistent with experimental observations [39].
5. Conclusions
Rationalizing empirical know-how at the atomic scale lays the grounds for smarter materials design to achieve enhanced performances and keeps inspiring continued improvements in atomic-scale microscopy and microanalysis. Here, we introduced an approach to make FIM truly sensitive to single atoms, with atomic spatial resolving power and chemical-sensitivity. Analytical-FIM allowed us to investigate the segregation of individual solute atoms to crystalline defects in a high-temperature creep-deformed Ni–Re alloy. Complemented by DFT-based contrast interpretation and tof-ms, the new approach to analytical-FIM provides clear evidence of the segregation of individual Re atoms to dislocations, in contrast to a conventional APT analysis. Analytical-FIM proves to be superior to APT in that respect since the atomic positions are revealed prior to field evaporation by a statistical distribution of thousands of image-gas ions, the trajectory of which are less affected by trajectory aberrations. Analytical-FIM opens new opportunities to deepen the understanding of how specific solutes interact with crystalline imperfections, including dislocations, vacancies and potentially, in the future, grain boundaries.
Acknowledgments
The authors are indebted to Dr Hamad ur Rehman for performing the creep tests. BG is grateful for many discussions with Drs Paraskevas Kontis, Surendra Kumar Makineni, Junyang He and Xiaoxiang Wu. SK, LTS, IM and BG are grateful to Dr Richard Forbes for discussions. The authors are grateful to U Tezins and A Sturm for their technical support of the APT and FIB facilities at the Max-Planck-Institut für Eisenforschung.
Funding
SK acknowledges the International Max-Planck Research School SurMat for funding. BG, LTS, SK and IM acknowledge funding from the MPG through the Laplace project. SN, BG, APAS, RD, TH acknowledge financial support from the German Research Foundation (DFG) through projects A4, B3 and C1 of the collaborative research centre SFB/TR 103. LTS and BG acknowledge financial support from the ERC-CoG SHINE—771602.
Author contributions
S K, L T S, I M developed the ideas for analytical-FIM, the data processing routines, with support and input from B G. B G conceived the project on the NiRe. S N provided the samples and the discussion on the diffusivity of Re in Ni. S K performed the APT, FIM and analytical-FIM experiments. C F and J N introduced the idea of the T-H calculations and C F implemented code and performed the DFT calculations. A P A S, J J, A N L, R D, T H developed the TB/BOP and performed the DFT/TB calculations. F V performed the field evaporation simulations based on input from S K. Results were discussed with all authors. B G drafted the manuscript with input from D R, S K, L T S, T H, F V. All authors were given a chance to comment.