


Abstract
Motivated by the problem of many-body localization and the recent numerical results for the level and eigenfunction statistics on the random regular graphs, a generalization of the Rosenzweig–Porter random matrix model is suggested that possesses two transitions. One of them is the Anderson localization transition from the localized to the extended states. The other one is the ergodic transition from the extended non-ergodic (multifractal) states to the extended ergodic states. We confirm the existence of both transitions by computing the two-level spectral correlation function, the spectrum of multifractality  and the wave function overlap which consistently demonstrate these two transitions.
Export citation and abstract BibTeX RIS

Content from this work may be used under the terms of the Creative Commons Attribution 3.0 licence. Any further distribution of this work must maintain attribution to the author(s) and the title of the work, journal citation and DOI.
1. Introduction
Motivated by the problem of many-body (MB) Localization [1] and the applicability of the Boltzmann's statistics in interacting disordered media [2], there was recently a revival of interest to the Anderson localization (AL) problem on hierarchical lattices such as the Bethe lattice (BL) or the random regular graph (RRG). Due to hierarchical structure of the Fock space connected by the two-body interaction, statistics of random wave functions in such models is an important playground for MB localization. In particular, the non-ergodic extended phase on disordered hierarchical lattices could model a breakdown of conventional Boltzmann statistics in interacting MB systems and an emergence of a phase of a 'bad metal' [3] or unconventional fluid phases [4] in systems of interacting particles.
However, even for the one-particle AL existence of such a phase in a finite interval of disorder strengths is a highly non-trivial issue.
According to earlier studies [5, 6] there is only one transition in such models at a disorder strength  which is the AL transition (AT) that separates the localized and ergodic extended states. However, recent numerical studies [7] of level statistics on RRG seem to indicate on the second transition at
  which is identified as the transition between the ergodic and non-ergodic extended states (ET). Subsequent studies [8, 9] raise doubts about the existence of the second transition on RRG. Numerical results of [8, 9] indicate on the non-ergodic states on RRG in a wide range of disorder strengths down to very low disorder
  , while in [9] it is demonstrated how an apparent non-ergodic behavior for the intermediate matrix sizes N in Levy random matrix (RM) ensemble evolves into the ergodic one at larger N's. Complexity of RRG and the controversy associated with existence of the ergodic transition at
  necessitate a search for a simpler model in which such a transition may occur.
Inspired by the success of Wigner–Dyson RM theory [10] which predictions are relevant in such seemingly different fields of physics as nuclear physics and nano- and mesoscipic physics, our goal is to search for a RM model that would be able to give a simple and universal description of all the three phases: good metal, MB insulator and 'bad metal', which are relevant in the problem of MB localization. An important heuristic argument to construct such a model is that RRG with disordered on-site energies  is essentially a two-step disorder ensemble. The disorder of the first level is the structural disorder due to the random structure of RRG where each of N sites of the graph is connected with the fixed number
  of other sites in a random manner. An ensemble of tight-binding models on such graphs with deterministic on-site energies
  and hopping integrals is believed to be equivalent to the Gaussian RM ensemble [11]. The disorder of the second level is produced by randomization of
  fluctuating independently around zero with the distribution function
  . For numerical calculations this distribution is often taken in the form
  , with
  being the Heaviside step function.
One can expect that the following RM ensemble (the Rosenzweig–Porter (RP) ensemble [12]) is a close relative of RRG with on-site energy  disorder. It is an ensemble of N × N random Hermitian matrices which entries Hnm with
  are independent random Gaussian numbers, real for orthogonal RP model (
 ) and complex for the unitary RP model (
 ), fluctuating around zero with the variance
  . The diagonal elements have the same properties with the variance
  . The case
  corresponds to the Gaussian orthogonal (GOE) or Gaussian unitary (GUE) ensembles and represents the structural disorder in RRG. The additional
  -disorder in RRG corresponds to
  . One should also take into account that in order to significantly deviate from the GOE or GUE behavior, the ratio
  must be proportional to some negative power of the matrix size N, as the number of the off-diagonal terms is
  times larger. Thus we consider the model:

where  and γ is the main control parameter of the problem.
One can estimate the strength of disorder required for the AL transition as corresponding to the typical fluctuation of diagonal matrix element equal to the typical off-diagonal matrix element times the coordination number K. For the coordination number  (each site is connected with any other one) this results in
  , or
, or  . However, this estimation does not take into account a random, sign-alternating character of the off-diagonal matrix elements. It is likely that for sign-alternating hopping there is another relevant coordination number
  with the critical scaling
  . As we show below it corresponds to the ergodic transition. For technical reasons the most significant progress in the analytical studies of the model was achieved [13, 14, 16] for the 'unitary' RP (URP) ensemble. The conclusion was that at
  the spectral form-factor (two-level correlation function) is neither of the Wigner–Dyson nor of the Poisson form [13, 15, 16] which is typical for the AL transition point. In contrast, at
  the level statistics was found to be GUE [14]. The papers [13, 14, 16] have a status of classic keynote papers in the field.
The Dyson ideas of the Brownian motion of energy levels first applied to the RP ensemble in [13] were developed in the series of works [17, 18]. It was shown that the possible transitions in the level statistics are associated with the fixed points of parameter ![${\rm{\Lambda }}=\sigma (N)/{[\delta (N)]}^{2}\propto {N}^{-\gamma }/{[\delta (N)]}^{2}$](https://content.cld.iop.org/journals/1367-2630/17/12/122002/revision1/njp521944ieqn32.gif) , where
, where  is the mean level spacing. Then assuming
  established in [16] for
  one obtains the transition point at
  . If, however, the Wigner–Dyson semicircle level density is assumed with
  , then the transition would occur at
  [17]. Unfortunately,
  only at
  . For
. For  the following result is valid (see e.g. equation (170) in [19]) for the mean density of states
  , where
  . Thus we obtain
  for
for  and
and  for
for  , resulting in
  for
for  and
and  for
for  . We conclude that the only fixed point of Λ is possible at
  , and no transition at
  can be obtained from the results of [17, 18].
In this paper by a more sophisticated analysis of the two-level correlations and the eigenfunctions statistics we show that the above extension of the RP model indeed contains not one but two transitions. One of them at  corresponds to the transition from the extended to the localized states. However, the extended states emerging at
  are not ergodic: their support set contains infinitely many
  sites in the
  limit, which, however, is a zero fraction of all sites, since
  . Such non-ergodic extended states on RRG are recently discussed in [8]. With further decrease of γ the second transition at
  happens which is a transition from the non-ergodic extended states to the ergodic extended states with
  similar to the eigenstates of the GOE.
We prove this statement in three steps. As the first step we use the perturbative arguments to compute the statistics of wave function amplitude  in a certain observation point ro. We obtain a drastic change of the character of this distribution at
  and
and  which is summarized in figure 1. This result is fully confirmed by a numerical diagonalization of the Hamiltonian (see figures 2–4). It is also confirmed by the numerical analysis of the moments of random wave functions which determine their Shannon entropy and the support set dimension D1 (see figure 5). Then we compute numerically the overlap of amplitudes for two different wave functions with the energy difference ω and find the scaling with N of the Thouless energy
  which exponent z changes abruptly at
  and
and  (see figure 6). Finally, we perform a rigorous calculation of the spectral form-factor which also shows the transition at
  and
and  (see figure 7). In the last section we compare the corresponding results for our model and for the RRG and demonstrate their similarity. It allows us to unify both models in a special universality class of random hierarchical models which differs from the one realized in localization transition points of two- and three-dimensional Anderson models. Further details concerning this model can be found in [20].

Figure 1. The spectrum of fractal dimensions: (a) the singular spectrum in the localized phase at  . It corresponds to the same exponent
  as for
  shown by the dashed line. (b) The triangular spectrum at the localization transition point
  . (c) The spectrum with the gap
  for the intermediate phase
  (d) the ergodic transition at
  corresponds to the collapse of
  .
.
Download figure:
Standard image High-resolution image
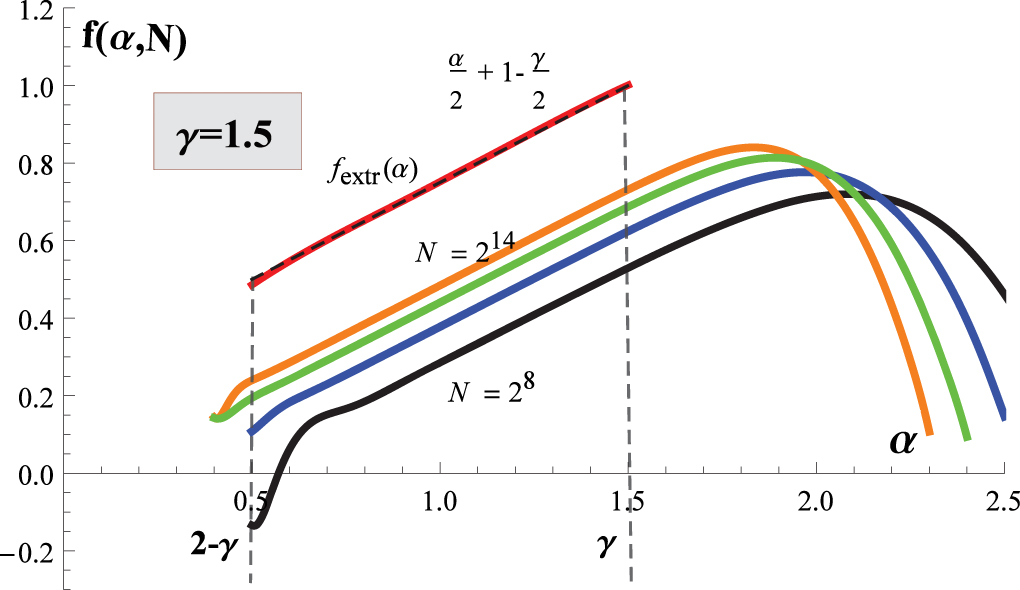
Figure 2. Spectrum of fractal dimension for  obtained numerically as in [8]. The linear part of the extrapolated
  (solid red line) is exactly as expected
  (black dashed line). The curves for
  for increasing N are shown by black, blue, green and orange lines from bottom to top. The top of the singular peak at
  shown by the points of the corresponding color, extrapolates to zero as expected (see inset); (inset) the
  extrapolation of the singular peak value
  .
.
Download figure:
Standard image High-resolution image
Figure 3. Spectrum of fractal dimension in the intermediate phase for  obtained numerically as in [8]. All notations are the same as in figure 2. Line colors correspond to the same values of N as in figure 2. Expected
  is shown by a black dashed line.
Download figure:
Standard image High-resolution image
Figure 4. Finite-N spectrum of fractal dimensions  for
for  and N = 210–215 obtained by the rectification procedure of [8]. For comparison we also present
  (shown by a red line) for the Porter–Thomas distribution of wave function amplitudes in the GOE obtained by the same procedure at
  . It almost coincides with the (violette) curve for
  computed at the same
  for our model with
  . In the inset:
  versus
  for the same
  and system sizes as in the main plot. The corresponding curve for GOE is shown in red. All the curves are almost indistinguishable.
Download figure:
Standard image High-resolution image
Figure 5. The support set dimension  and the global curvature
  extracted from the fit
 versus γ. The dashed line is the prediction for D1, equation (9); (inset) the average
  versus
  for γ from 0.75 (bottom) to 2.25 (top) with steps 0.25. It is related with the Shannon entropy
  . The global curvature
  changes sign at the transition points
  and
and  .
.
Download figure:
Standard image High-resolution image2. Statistics of eigenfunction amplitudes
As the off-diagonal matrix elements in equation (1) are small, one can employ the perturbation theory for computing the distribution function of the amplitudes  . The first order perturbation theory gives:

where the maximum of  is supposed to be at
  .
.
The perturbative series converge absolutely if the typical off-diagonal matrix element  times the coordination number N is much smaller than the typical difference of the diagonal matrix elements
  . Thus it converges absolutely for
  irrespectively of the statistics of diagonal matrix elements. For
  the convergence of the series occurs only because of the random and independently fluctuating signs of Hnm and
  . Although it is hard to prove such a convergence rigorously, a plausible argument in its favor is that the effective coordination number of oscillatory contributions is
  rather than N. The corresponding criterion of convergence is
  which is satisfied at
  .
.
Consider the regular part of the characteristic function  . For the Gaussian distribution of matrix elements equation (1) we obtain
  , where:

The eigenfunction amplitude distribution function  at
at  is dominated at
  by small
  . That is why it is only the expansion of equation (3) at small ζ what matters for P(x) at
  . Thus we obtain for the regular part of the function P(x):

There are two normalization conditions for P(x): the normalization of probability equation (5) and the normalization of the wave function equation (6):


Equation (5) imposes a cut-off  to equation (4) at small x, while equation (6) determines the upper cut-off
  . A caution, however, should be taken: by normalization
  the amplitude
  on any lattice site cannot exceed 1, and therefore
  . One can see that the above estimation for xmax is valid only for
  when
when  . For
. For  a correct
  . In order to compensate for the deficiency of normalization in equation (6) one has to assume a singular part of
  . One can see that for
  equation (6) is dominated by the singular term, and
  . This corresponds to the strongly localized wave functions. The mechanism of emergence of the singular term at the AL transition at
  is somewhat similar to the Bose-condensation, where the singular term also appears because of the deficiency of normalization of the Bose–Einstein distribution.
One can express the distribution function equation (4) through the spectrum of fractal dimensions [8, 21]:

where  or
or  . Using equations (4)–(7) one obtains:

The upper cutoff  corresponds to the lower cutoff xmin. The lower cutoff
  depends on γ. In the localized region
  , figure 1(a),
  . At the AL transition point
  the function
  has the same triangular shape as at
  on RRG, figure 1(b). In the region of the extended non-ergodic states
  , figure 1(c),
  . It is remarkable that in the entire region
  the symmetry [21, 22]
 holds. Finally, at
  the two limits
  and
and  collapse in one point
  which marks the transition point to the ergodic state, figure 1(d).
Note that  for
for  (see figure 1(a)) has a singular peak at
  which corresponds to the singular term
  in P(x). This singular
  is not a limit of any convex function. However, one may easily see that all the moments
  have the same exponents
  as for the 'convex'
  shown by the dashed line in figure 1(a):
  for
for  . Such a triangular
  with the slope smaller than 1/2 also holds in the localized phase on RRG [8].
The numerical calculation of  which involve the rectification and extrapolation procedures described in [8], fully confirms the above results. In figure 2 we present the results of this calculation for N = 28–214 and the extrapolated
  (shown by a solid red line) for
  which perfectly coincides with the prediction of our perturbative analysis above. The similar coincidence was obtained for
  , while for
  the distribution function P(x) is practically indistinguishable from the Porter–Thomas distribution of the GOE.
3. The support set dimension D1
By calculating the Legendre transform  [21] of
  (shown in figure 1) one finds that in the intermediate phase
  all fractal dimensions
  for
for  are the same and equal to:

Thus the support set of a typical wave function is a fractal containing  sites. As
  in the limit
  it is an extended state. However the support set contains a fraction of all sites
  tending to zero in this limit. Thus it is a non-ergodic state.
In the localized phase  (including the critical point
  ) we obtained:

One can see that the fractal dimensions  only at
  , while they are non-zero and negative for
  . This is not exactly the behavior of the typical Anderson insulator where all fractal dimensions with
  are equal to zero. The behavior similar to equation (10) were found in certain two-dimensional random Dirac models [25–28]. Such a quasi-localized phase is referred to as the frozen phase and the corresponding transition is known as the freezing transition. In such a phase a typical wave function amplitude has several sharp peaks separated by valleys where
  is not exponentially but only power-law small in N (
 in our case). The same behavior is also found for the RRG [8] with
  .
.
In order to check the existence of the intermediate phase numerically we computed the average  which is directly related with the Shannon entropy and the dimension D1 of the support set of fractal wave functions [23]. The results are shown in the inset of figure 5 where N span from 256 up to 32768. The corresponding values of D1 extracted from the linear in
  fit are shown in figure 5 which are consistent with the transitions at
  and
and  . The deviation from the expected
  shown by a dashed line in figure 5 is a finite-size effect. Indeed, the correlation volume Nc close to the localization transition at
  is exponentially large
  . This follows from equation (17) of section 5 where the Poisson limit is reached only for
  or
or  . The similar exponential dependence
  of the correlation volume was obtained on the BL [24]. For system sizes
  one should see the properties of the critical point
  where
where  . Thus in the vicinity of the transition point the support set dimension extracted from the finite-size simulations should show a tendency towards smaller values as in figure 5. However, for
  at our systems sizes the support set dimension D1 approaches the values expected in
  limit (dashed line in figure 5). This fact implies that for
  we reached
  and thus it may serve as numerical evidence of convergence and existence of non-ergodic extended phase in the thermodynamic limit.
We also introduced the  corrections to the fit with its magnitude
  being a measure of the global curvature of the
  versus
  dependence. Remarkably,
  changes sign at both the transition points
  and
and  (though the positive
  is very small for
  ). We also checked that it changes sign at the localization transition point of the 3D Anderson model (not shown). We believe that the changing of sign of
  is a convenient way to identify the points of both localization and ergodic transitions.
4. Overlap of different wave functions
Next we compute numerically the overlap of different wave functions  . Note that for the ergodic wave functions of GOE
  is independent of the energy difference ω, as in this case the overlap is always 100%. Our results presented in figure 6 show that for
  the overlap
  has a plateau at
  which is followed by a fast decrease
  for
for  . The Thouless energy ETh [29] that separates the GOE-like behavior (plateau) from the system specific behavior (
 ), depends on N as a power-law
  . However, the scaling exponent z is different in all the three phases (see figure 6). In the localized phase figure 6(b) we obtained
  which corresponds to rare resonances when
  . In the extended non-ergodic phase figure 6(a) we found
  , where
  is the mean level spacing. This corresponds to all ND sites in the support set being in resonance with each other. The corresponding ND states produced by linear combinations of basis states localized on resonant sites form a mini-band of levels of the width
  . Clearly, the states inside such a mini-band should have the GOE-like correlations. On the contrary, the states separated by the energy distance
  should belong to different support sets which poorly overlap with each other. At the ergodic transition at
  and in the entire extended ergodic state at
  we obtain
  , and the plateau extends to entire spectral band-width. The emergence of such a plateau that survives the limit
  is a signature of the ergodic state [30].

Figure 6. The overlap correlation function  . (a) For
  functions
  for different N collapse into the same curve in coordinates
  (see also an inset to figure 7). (b) For
  the collapse of
  occurs in coordinates
  .
.
Download figure:
Standard image High-resolution image
Figure 7. Unfolded spectral form-factor  for the RP model for two different cases: (i)
  and (ii)
  at
at  . The falling part corresponds to attraction of levels while the rising part corresponds to repulsion of levels. The GUE form-factor is shown by the red dashed line. The Poisson distribution corresponds to
  . (inset) The spectral form-factor in the variable
  with
with  in the
  limit for different values of γ. There are five distinctly different phases: insulator
  , AT critical
  , non-ergodic extended
  , ET critical
  and ergodic
  .
.
Download figure:
Standard image High-resolution imageSurprisingly, the overlap function  as
as  at any fixed ω and
  . This phenomenon of 'repulsion of wave functions' [30] is a peculiar feature of our model. The non-ergodic fractal states at the localization transition points of the two and three- dimensional Anderson models of the Dyson symmetry classes, as well as those of the power-law banded random matrices [21, 30, 31] show a different behavior. In these models, the Thouless energy for fractal states is proportional to the mean level spacing
  and the behavior for
  is described by the conventional Chalker's scaling [32, 34, 35]:

Only at a very large energy separations ω of the order of the total spectral band-width, the 'repulsion of wave functions' was observed [30].
A remarkable feature of the present model is that the Thouless energy in the region of extended non-ergodic states is much larger than the mean level spacing:

One can interpret this relationship as a non-trivial dynamical scaling exponent

For non-interacting systems in two or three-dimensions in the point of Anderson transition z = 1 for all Dyson symmetry classes. A non-trivial z is known only in two-dimensional systems described by the Dirac equation with random vector-potential which belong to chiral symmetry classes [25–28] where the freezing transition is observed.
In terms of the dynamical exponent z the leading power-law term in the Chalker's scaling for  can be rewritten as [28]:

In our model we have:

One can consider equation (15) as a particular case of expansion in  with the leading term exponent
  :
:

in which the coefficient c0 is zero. We will see below that equations (12) and (16) hold for the RRG too. However in this case the coefficient  is non-zero. Thus one can speak of the special universality class of models with a non-trivial
  and
and  which the present model belongs to together with the RRG model.
5. Spectral form-factor
Finally, we present the results of a rigorous calculation of the spectral form-factor  , with a set of eigenvalues
  of H. To this end we generalize to the case
  the results of [16] where
  was derived for URP model equation (1) with
  using the Itzykson–Zuber formula of integration over unitary group. The final result (see details of the derivation in [20]) for
 ![$C(t,{t}^{\prime })=2\pi \delta (t+{t}^{\prime })\left[S\left(\frac{{E}_{\mathrm{Th}}}{2}(t-{t}^{\prime })\right)-1\right]$](https://content.cld.iop.org/journals/1367-2630/17/12/122002/revision1/njp521944ieqn270.gif) is given by equation (17)
is given by equation (17)

with the modified Bessel function  ,
,  ,
,  and
and  . The unfolded spectral form-factor
  with
with  is given by
  . It follows from equation (17) that for
  ,
,  in the
  limit, which corresponds to completely uncorrelated energy levels and the exact Poisson statistics. Another important feature of equation (17) is that
  for all
  .
.
In figure 7 we plot the unfolded spectral form-factor  for the two phases: (i) the critical phase of the AL transition at
  and (ii) the intermediate phase at
  . One can see that while at
  the function
  has a non-trivial
  limit, for
  the limit coincides with that of the GUE, except for the point
  where there is a jump in
  . This jump is a hallmark of the intermediate phase. To demonstrate this more clearly we blow up the region of small
  by re-scaling the variable
 . Note that
  appears again as the characteristic scale where the level repulsion is taken over by the level attraction in figure 7. In this new variable
  has a non-GUE
  limit:

which is shown in the inset to figure 7. The true GUE form factor is just identically zero in this limit. The existence of the new scale ETh and a non-GUE  limit equation (18) in the variable
  have been overlooked in [14].
Equation (18) holds for  , and S(u) is saturated at
  for
for  , which corresponds to
  smaller than the inverse total spectral band-width. For
  we have
  . Thus the value
  at
at  is smaller than 1. So, in addition to the specific critical behavior of S(u) at
  (shown by the red curve in figure 7) one obtains yet another critical behavior of S(u) at the ergodic transition
  (shown by the dashed yellow line in figure 7) which is stable in the
  limit and is characterized by
  . For
. For  ,
,  is increasing with N, making
  as
as  . This is how the GUE limit
  is reached.
Note that the fact that  affects the level number variance
  (n and
  are the average number of levels and the level number variance in a certain spectral window, respectively) in which a new scale
  appears for n at
  :
:

The level compressibility χ [33, 34] is ill-defined in our model because of the jump in the spectral form factor  at
at  . Formally it can take any value from
  to
to  depending on the parameter
  . This is in contrast to other RM models with multifractal eigenstates, e.g. PLBRM and Moshe–Neuberger–Shapiro models (see [34] and references therein) where the level compressibility is well defined and takes a definite value
  in the
  limit.
6. Comparison with RRG model
In the introduction we mentioned a heuristic relation between the Anderson model on a hierarchical RRG and the RP model which has no apparent hierarchical structure. It is instructive now to compare the main results of this paper with the corresponding results for RRG.
First of all we recall (see figure 1 and the corresponding explanations in the text) that all the moments  in the localized and the AT critical phases of our model have exactly the same
  -dependence as in the corresponding phases of the RRG. The
  - and
- and  - dependence of the moments is also very similar (see figure 5 with figure 8) to the corresponding N and W-dependences for the random wave functions obtained by the exact diagonalization of the Anderson model on RRG with the branching number
 . However, there is an important difference: we found only one point of changing the sign of
  on RRG which corresponds to the known point of the AL transition at
  17.5.
17.5.

Figure 8. The support set dimension D1 and the global curvature  as the function of disorder strength W extracted for the RRG model as in figure 5. No ergodic transition is detected by changing of sign of the global curvature. This is consistent with the statement [8] that the entire extended phase is non-ergodic.
Download figure:
Standard image High-resolution imageIn figure 9 we demonstrate that in the case of RRG the scaling of the Thouless energy with the system size follows the same equation (12) as for the present RP model and is different from the standard Chalker's scaling. The falling part of  can be described by the unified expansion equation (16) both for RRG and our model, albeit the coefficient
  is zero for the present model and is non-zero for RRG. It is important that for RRG the data for properly re-scaled
  at different
  collapse on one same scaling curve
  that, however, depends on
  , as well as the exponent
  (see inset of figure 9). This is very different from the usual scaling
  in the vicinity of a single critical point
  where the exponents
  are determined by the property of this critical point and not by the distance
  from this point which determines only the correlation volume
  . In our opinion, this implies that there is a line of critical points at
  which determine the behavior of the system at least in a parametrically large interval of sizes
  , with the second characteristic size scale
  .
.

Figure 9. Collapse of data for  for the Anderson model on RRG with the branching number K = 2 and N = 2000, 4000, 8000, 16000, 32000. The collapse occurs in the coordinates
  which corresponds to equations (12), (9) and figure 6(a) in RP-ensemble. The values of fractal dimension
  extracted from the best collapse are in excellent agreement with the corresponding values found from the moments
  (see inset). Different disorder strengths
  correspond to different collapse curves and different dynamical exponents
  . This excludes a possibility for an apparent non-ergodicity of extended phase to be a finite-size effect reflecting properties of only one single critical disorder strength. The behavior of
  corresponds to equation (16) with a non-zero
  1. (inset) The fractal dimensions
  as a function of
  found from the best collapse of data for
  (red circle) and from the scaling of moments
  (black circle).
Download figure:
Standard image High-resolution image
Our conclusion is that the localized and AT critical states are very similar for our model and RRG. The extended states show non-ergodicity in a broad interval of  and are characterized by the Thouless energy which in both models is much larger than the mean level spacing. However, the existence or non-existence of the ergodic transition is more subtle and depends on tiny features of the model. It exists in our model and most probably does not exist on RRG with the branching number K = 2. Nonetheless our study largely confirms expectation on the similarity between the RRG and RP models. This allows us to speak on the special class of models with the explicit (RRG) or hidden (RP) hierarchical structure.
Acknowledgments
We are grateful to B L Altshuler, E Bogomolny, G Biroli, M S Foster, L B Ioffe, J P Pekola and O Yevtushenko for stimulating discussions. We would like to specially thank Pragya Shukla for letting us know about her forthcoming work [36], where the second transition at  was mentioned. IMK acknowledges the support of the European Union Seventh Framework Programme: INFERNOS (FP7/2007–2013) under grant agreement no. 308850 and of Academy of Finland (Project Nos. 284594, 272218). VEK acknowledges the hospitality of Aalto University and at LPTMS of University of Paris Sud at Orsay and support under the CNRS grant ANR-11-IDEX-0003-02 Labex PALM, project MultiScreenGlass.