

Abstract
Conductor on Round Core (CORC®) wires and cables, constructed from multiple layers of helically wound REBa2Cu3O7−δ tapes, are a promising cable technology for high field magnet applications. An important feature of high-temperature superconductor cables is the ability to share current between conductors, allowing current to bypass drops in Ic and minimizing the risk of hot spot formation, which could lead to potential burnout in the superconductor. In contrast to stacked-tape cables, which have continuous contact between tapes, in CORC® the transfer points occur at discrete tape crossovers. The tape-to-tape contact resistance, Rc, plays a critical role in the current sharing capabilities and current distribution in cables. For the work reported here, special CORC® wires were manufactured using different winding parameters to investigate variations in Rc. Variations comprised inclusion of a lubricant, different lubricant conductivity, inclusion of pre-tinning, and heating briefly to melt the solder. Cables were first tested as straight lengths, followed by bending to a 10 cm diameter. In straight cables Rc values ranged from 1 to over 1000 μΩ cm2, depending on cabling parameters, with the highest values being found for cables made by the present 'standard' process. Bending the cables to a 10 cm diameter decreased Rc by a factor 2–5. Tinning with PbSn decreased Rc by three orders of magnitude compared to standard CORC® wires, and heat treating wires with tinned conductor resulted in only a small further decrease in Rc. Based on the measured Rc at an electric field of 1 μV cm−1 the resulting current transfer length between layers can range from a few millimeters to a tens of centimeters. Examination of contacts with a laser confocal microscope showed plastic deformation of the copper at the edges of the contact overlap area, apparently caused by thicker plating at tape edges digging into the copper of neighboring layers. These images reveal that only a fraction of the total contact surface may actually be touching when there is nothing to compensate for height differential. Images of the PbSn coated tapes indicated that application of solder produces a much more uniform contact surface and higher contact area. Furthermore, imaging of CORC® cross-sections confirmed that in the non-tinned cables there are many regions where tapes are not in contact, while in contrast the PbSn cable shows significantly more contact between the tapes. These different imaging techniques reveal that tape surface morphology is a significant parameter in determining Rc.
Export citation and abstract BibTeX RIS

Original content from this work may be used under the terms of the Creative Commons Attribution 4.0 license. Any further distribution of this work must maintain attribution to the author(s) and the title of the work, journal citation and DOI.
1. Introduction
Recent advances in high field magnet technology underscore the need for conductor architectures with high current density in large magnetic fields, appropriate stability and quench protection, and ability to withstand high stresses. A promising high-temperature superconductor (HTS) material is REBa2Cu3O7−δ (REBCO, RE = rare earth or yttrium) coated conductor, which is produced by depositing 1–2 µm of REBCO onto a suitably prepared Hastelloy substrate, resulting in a strong, ready-to-wind conductor [1–3]. At the National High Magnetic Field Laboratory, for instance, REBCO conductors are the basis for the new 32 T user magnet [4] and exciting high-field research magnets [5]. In addition to high field magnets REBCO is also being utilized in a variety of applications from wind turbines to power transmission cables to electric motors [6–8].
Recent years have seen advancements in the manufacturing and performance of REBCO coated conductors [9–11]. While the manufacturing process still creates variations in critical current, Ic, local variations are generally 1%–2% of the average critical current [11]. What is important for magnet technology is the possibility that an initially benign defect can be adversely affected by conditions of operation, leading to formation of local hot spots [5]. Defects can be instigated by a number of sources, including intrinsic sources such as pinning variations [11–13]. Furthermore, magnet operation can exacerbate pre-existing flaws and introduce new defects due to operational stresses [14, 15]. In magnets, inductive voltages and voltage noise produced during ramping can be larger than the voltage produced across a conductor defect. This situation can potentially lead to the formation of hot spots that remain undetected until irreversible damage occurs [5, 11–13].
Multi-conductor cables and winding techniques [3, 16–20] promote current sharing by allowing the current to transfer between tapes to mitigate burnout risk. Successful operation well within the flux-flow regime has been demonstrated in Conductor on Round Core (CORC®)-based canted-cosine-theta accelerator magnets [21, 22] and more recently in a CORC® insert solenoid that operated at over 4 kA in a 14 T background field [23]. Passive stabilization by re-distributing current improves reliability of a magnet [24, 25]. This path could facilitate better utilization of available conductor by building in tolerance of defects under operating conditions.
Three main HTS cable architectures have been developed using REBCO coated conductors: Roebel [18], stacked tape cables [19, 26–30], and wrapped cores which were first proposed for electric power applications [31–33]. This paper focuses on the CORC® approach. In Roebel cables, strands of tape, which have been cut into a Roebel bar shape, are wound together forming a fully transposed, intertwined cable stack. Roebel cables produce very high current densities as a result of their compact geometry. However cable flexibility is limited, restricting in-plane bending [18]. The stacked tape architecture produces a stable cable with high current carrying capacities and multiple different designs of stacked tape cables have been proposed for fusion applications [26–28].
Our collaboration explores CORC® wires, manufactured by Advanced Conductor Technologies (ACT) [3, 7, 32]. The conductor architecture consists of multiple layers of REBCO tapes, helically wound around a copper core. This geometry results in flexibility for tapes to slide within the cable during bending, reducing a buildup of stress [7]. Past cable designs have incorporated as many as 50 tapes [32] and have been shown to retain 90% of critical current Ic when bent to radii as small as 1.75 cm [7]. Unlike the stacked cable type, where the tapes are in contact along the entire length, the contacts between tapes in CORC® wires are confined to periodic crossovers, but to multiple tapes, since each tape layer of the wire consists of several tapes in parallel. The periodic contacts are constrained to the tape overlap area in CORC®, and their uniformity and reproducibility is not known.
An initial investigation in tape-to-tape contact resistance in CORC® cables wound from 4 mm wide tapes has been performed [34] in which the contact resistance decreased by up to 20% between 77 K and 4.2 K, and by two orders in magnitude when the Pb-Sn solder layer coated on the tapes was melted. Recent studies of clamped REBCO tape joints under cyclic loading [35, 36] noted that tape orientation, surface conditions, and contact pressure are key parameters that affect Rc. These parameters are applicable also to cables, and the present study aims to quantify tape-to-tape contact resistance that arises in the basic CORC® design. Cable manufacture and magnet winding also requires a lubricant to coat the tape surface. This study aims to provide results that guide discussion about current sharing around conductor defects in cables. In an ideal case, the minimum Rc between tapes occurs for an orientation with REBCO sides facing each other, as in a soldered lap joint, with values on the order of 0.1 μΩ cm2 [37–39]. In CORC® and similar cables, the tapes are wound with the REBCO layer facing inward, placing it under axial compression, which necessitates that the contacts have the REBCO side of one tape facing the substrate side of a neighboring tape. Soldered joints in this orientation have been reported to have Rc ranging from 0.4 to 3.0 μΩ cm2 [40]. In general, and in the absence of a soldered connection, increasing the contact pressure decreases Rc, so winding tension, bending, transverse stress, and other factors could affect Rc significantly. The surface conditions, such as surface roughness and contaminants can influence Rc as well [35, 36], including artifacts of handling and environment. While previous work used cyclic loading, here the contact resistance is evaluated only in the initial as-wound condition. In this work we consider special CORC® wires with different winding parameters to investigate their influence on Rc. We also look at CORC® wires wound from Pb-Sn coated REBCO tapes and measure Rc before and after a heat treatment to wet the solder. We add comprehensive imaging to examine the contact details. The Rc measurements, in combination with imaging, give insight about how Rc varies in CORC® wires.
2. Experimental setup
2.1. CORC® wire Geometry
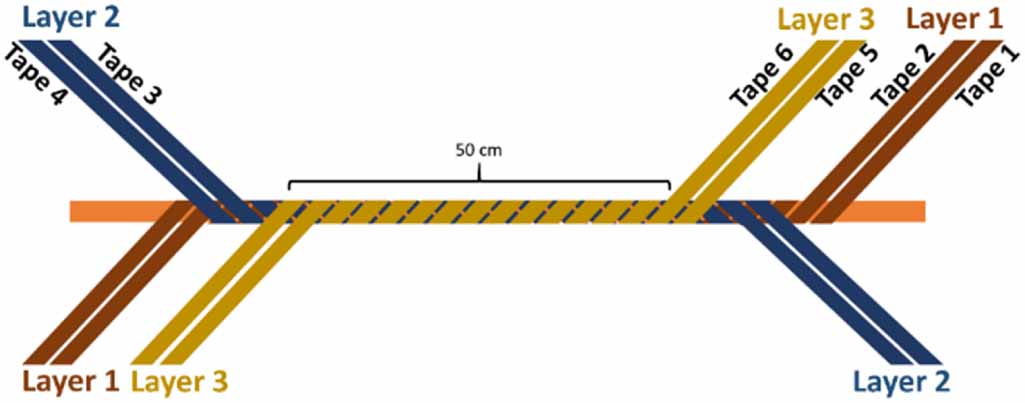
We examined four unique CORC® wire designs as outlined in table 1. The control wire (CO) represents a typically wound CORC® wire. Two CORC® wires included variations in the winding lubricant, including a wire wound without lubricant (NL) and a wire wound with a high conductivity lubricant (HC). The last wire was wound using conductors coated in PbSn solder. This wire was measured as wound (PbSn Before HT) and after a 5 min heat treatment at 200 °C to melt the solder (PbSn After HT). ACT constructed the cables from lengths of SCS2030 SuperPower tapes, specified in table 2. Each CORC® wire contains three layers, with two tapes per layer, in which the middle layer is wound in the opposite direction of the inner and outer layers, see figure 1. The tapes are wound around a 2.78 mm copper core and encased by 25 μm polyester heat shrink insulation.

Figure 1. CORC® wire Geometry: The inner most layer is referred to as Layer 1 and contains two tapes labelled Tape 1 and Tape 2. The middle layer, referred to as Layer 2, contains Tape 3 and Tape 4. The outer layer, referred to as Layer 3, contains Tape 5 and Tape 6.
Download figure:
Standard image High-resolution imageTable 1. CORC® wire winding variations.
| Cable | Winding Lubricant |
|---|---|
| Control (CO) | Non-conducting |
| No Lubricant (NL) | None |
| High Conductivity Lubricant (HC) | High Conductivity |
| PbSn Before HT | Non-conducting |
| PbSn After HT | Non-conducting |
Table 2. SuperPower tape specifications.
| Tape width | 2 mm |
| Tape thickness | 45 μm |
| Substrate thickness | 30 μm |
| Cu plating thickness | 5 μm |
| Tape Ic (77 K, self-field) | 66–77 A |
2.2. Rc measurement
The experimental design forced current to cross contacts by feeding current generally into layer 2 tapes 3 and 4 and extracting current from tapes in the other layers. The measurement technique did not use the terminals usually supplied with CORC® cables. The tape-to-tape Rc was determined by measuring the voltage as a function of current for each combination of feeding current into a tape in layer 2 and extracting current out of tapes 1, 2, 5, and 6. This isolation prevented the possibility of uneven current distribution from the terminals. The critical current Ic of individual tapes was also recorded by energizing only that tape, i.e. without any crossover between layers, by measuring a voltage-current V(I) curve and applying a criterion of 1 μV cm−1 over the cable length of 50 cm.
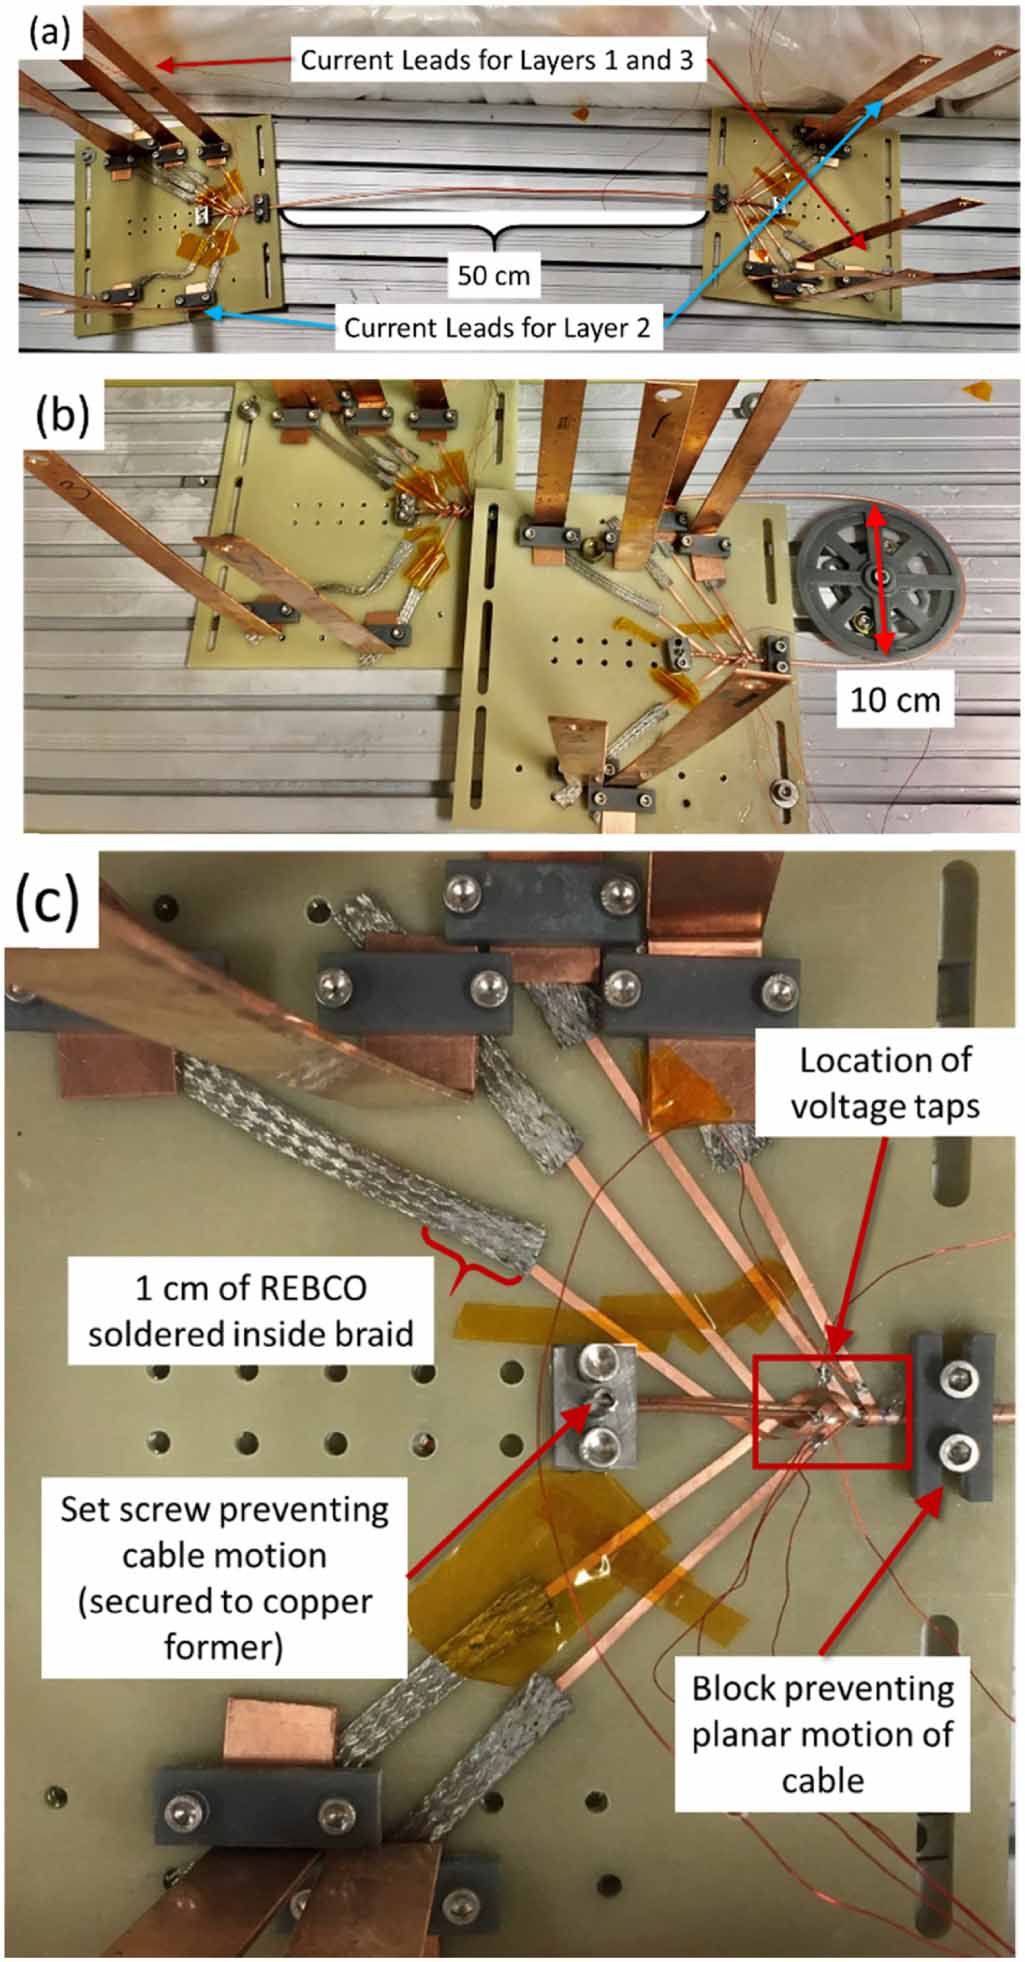
Since the tapes were unfurled at the ends, a challenge for the experiment was to provide mechanical support and electro-thermal stability at the current junctions. Any damage or overheating of the isolated tape ends can lead to skewed voltage signals and potential burnout. To ensure the integrity and repeatability of the measurements, a lengthy trial and error process was undertaken to successfully unwind the cable and isolate individual tapes without causing any degradation to the tapes. The ends of the cable were carefully unwound, leaving a 50 cm section of intact CORC® wire, and the tapes were soldered to individual current leads, see figure 2. The unwound tapes were extremely vulnerable. Once soldered to individual leads any movement of the cable resulted in accidental damage to the unwound ends. In order to prevent this the cable ends were secured to a G-10 plate at two locations prior to unwinding. The intact cable was secured within a channel on a 3D printed block, inhibiting any planar motion, while a set screw secures the copper former preventing any axial slipping or rotation, figure 2(c). To prevent overheating and ensure no effect on the voltage signals, a 1 cm section of REBCO was inserted into a copper braid and soldered. The voltage taps were then placed at least 3 cm downstream of the solder joint, ensuring the current was fully injected into the superconductor.
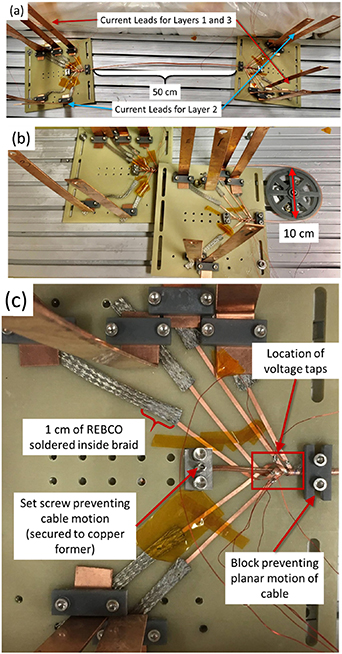
Figure 2. (a) Experimental setup of 50 cm long straight CORC® wire (b) CORC® wire bent to 10 cm diameter (c) close-up image detailing unwound tape ends of CORC® wires.
Download figure:
Standard image High-resolution imageThe value of Rc was then calculated from the linear slope of the voltage-current V(I) curves. The V(I) curves for each inter-layer combination were attained by ramping the current to 10 A, still far below the critical-current transition for any of the tapes, and recording the voltage. This resulted in a combination of 8 unique tape-to-tape contact resistances for each CORC® wire. For each tape combination, two V(I) curves were recorded, resulting in a total of 16 Rc measurements per cable. These measurements were performed in zero field while the cable was immersed in a bath of liquid nitrogen at 77 K.
CORC® wires were first measured as straight lengths, which is the condition delivered from ACT. After the initial Ic and Rc measurements, several wires were bent to a 10 cm diameter and secured to a back plate, see figure 2(b). The same test procedure used for straight cables was then applied to determine Ic and Rc in the bent cables. The Ic value was used to quantify any degradation due to bending and whether any changes in Rc could be the result of damaged tapes. The changes in Rc due to thermal cycling were <10%, which is smaller than variations within cables. We measured a total of eighteen 50 cm long CORC® wires. Table 3 details the number of samples and measurements for each wire type.
Table 3. Contact resistance measurements.
| Cable | Number of Straight Samples | Number of Bent Samples | Total Number of Measurements |
|---|---|---|---|
| Control | 4 | 1 | 80 |
| No Lubricant | 3 | 1 | 64 |
| High Conductivity Lubricant | 5 | 2 | 112 |
| PbSn | 2 | 1 | 100 |
2.3. Imaging
The surface roughness of the REBCO tapes were analyzed using an Olympus LEXT OSL 3100 scanning laser confocal microscope (LCM). In topographical mode, a violet laser is scanned across the sample surface while adjusting the pinhole to maintain focus, which produces surface height measurements for features with less than 85° tilt with respect to the scanning plane. Two centimeter lengths of tape were unwound from the wires, flattened, and wiped with acetone prior to imaging. A tape from each layer was examined, looking at both the substrate and REBCO side of the tapes.
Cross-section images of the CORC® wires were obtained with an Olympus DSX1000 digital light microscope from metallographically polished samples. In short wire samples undesirable spring-back of the tapes can occur. Figure 3 depicts how the tapes spring apart once the polyester casing is removed from the wire. In an attempt to immobilize the tapes inside the shrink-wrap, one end of long wire samples were inserted into holes drilled into pre-formed metallographic pucks, secured with epoxy. The excess cable length was cut off after the epoxy hardened. The pucks were then polished, concluding with a non-directional vibratory polish. Multiple cross-sections were examined to ascertain artifacts of polishing and ensure that the images produced were representative of the CORC® wire as a whole.

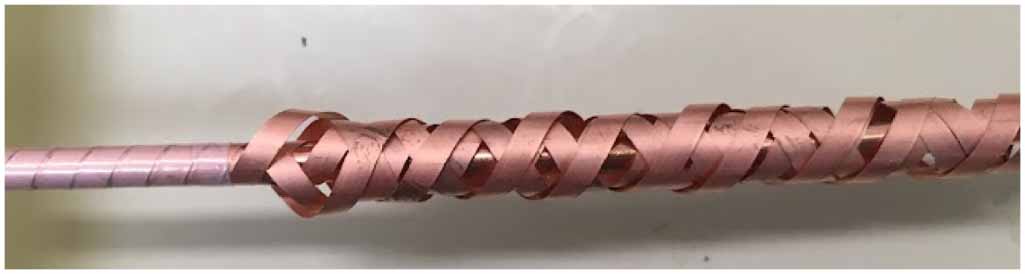
Figure 3. End of CORC® wire with polyester heat shrink tube partly removed to show tapes springing apart from former.
Download figure:
Standard image High-resolution image3. Results
3.1. Contact resistance
The average Rc values of each CORC® wire are presented in figure 4 and detailed in table 4. The non-conducting winding lubricant used by ACT produced an average Rc value of 1300 μΩ cm2 in straight cables. Removing this lubricant can reduce Rc by an order of magnitude as seen in the NL cable. Applying a dry, HC lubricant further reduces Rc to an average of 40 μΩ cm2 in the HC cable. Winding a CORC® wire from tinned conductors drastically decreased Rc. The PbSn wire had an Rc of 2 μΩ cm2 before the heat treatment. Melting the solder further reduced Rc to 0.6 μΩ cm2. This suggests that a low Rc can be achieved by winding CORC® wires from tinned tapes without fully soldering, which presents an opportunity to maintain cable flexibility. In general, bending the wire reduced Rc by a factor of 2–5.

Figure 4. Rc in the control (CO), no lubricant (NL), and high conductivity (HC) CORC® wires for both straight and bent conditions.
Download figure:
Standard image High-resolution imageTable 4. Contact resistance results (μΩ cm2).
| CORC® wire | Straight | After bending to 10 cm diameter |
|---|---|---|
| CO | 1300 ± 1000 | 403 ± 63 |
| NL | 160 ± 80 | 35 ± 13 |
| HC | 41 ± 25 | 13 ± 5 |
| PbSn Before HT | 2 ± 0.4 | 0.8 ± 0.1 |
| PbSn After HT | 0.7 ± 0.4 | 0.6 ± 0.1 |
There was quite a large variation in the values of Rc for the CO wire, but variations decreased as lubricant was adjusted, indicating the lubricant plays a key role in the uniformity of Rc. Interestingly, the PbSn wire is coated in the non-conducting lubricant, yet Rc variation is small, suggesting that the solder coating on the tapes is a more significant factor than winding lubricant.
Figure 5 shows a plot of all the measurements collected for the straight CO CORC® wire to give a sense of how the variation bar was determined. Four separate 50 cm long wires were measured, with 16 measurements for each wire corresponding to the eight combinations of tape connections and two measurements for each connection. No distinction is made for current transferring toward or away from the wire core. The average Rc and standard deviation for the straight CO wire, indicated by the blue circle and error bar in figure 4, were determined from these 64 measurements. Values and variation bars for the other cables were calculated in a similar manner.

Figure 5. All the measured data points for the straight CO CORC® wire.
Download figure:
Standard image High-resolution imageOne interesting detail highlighted by figure 5 is an apparent difference for Rc depending on the direction of current transfer. Rc between layers 1 and 2, i.e. current transfer is inward toward the core, is significantly higher than the Rc for layers 2 and 3, i.e. current transfer outward away from the core. This behavior was reflected in the NL and HC wires as well, but was not seen in the PbSn wires. The directional dependence of Rc will be addressed in the discussion.
3.2. Surface morphology and topology
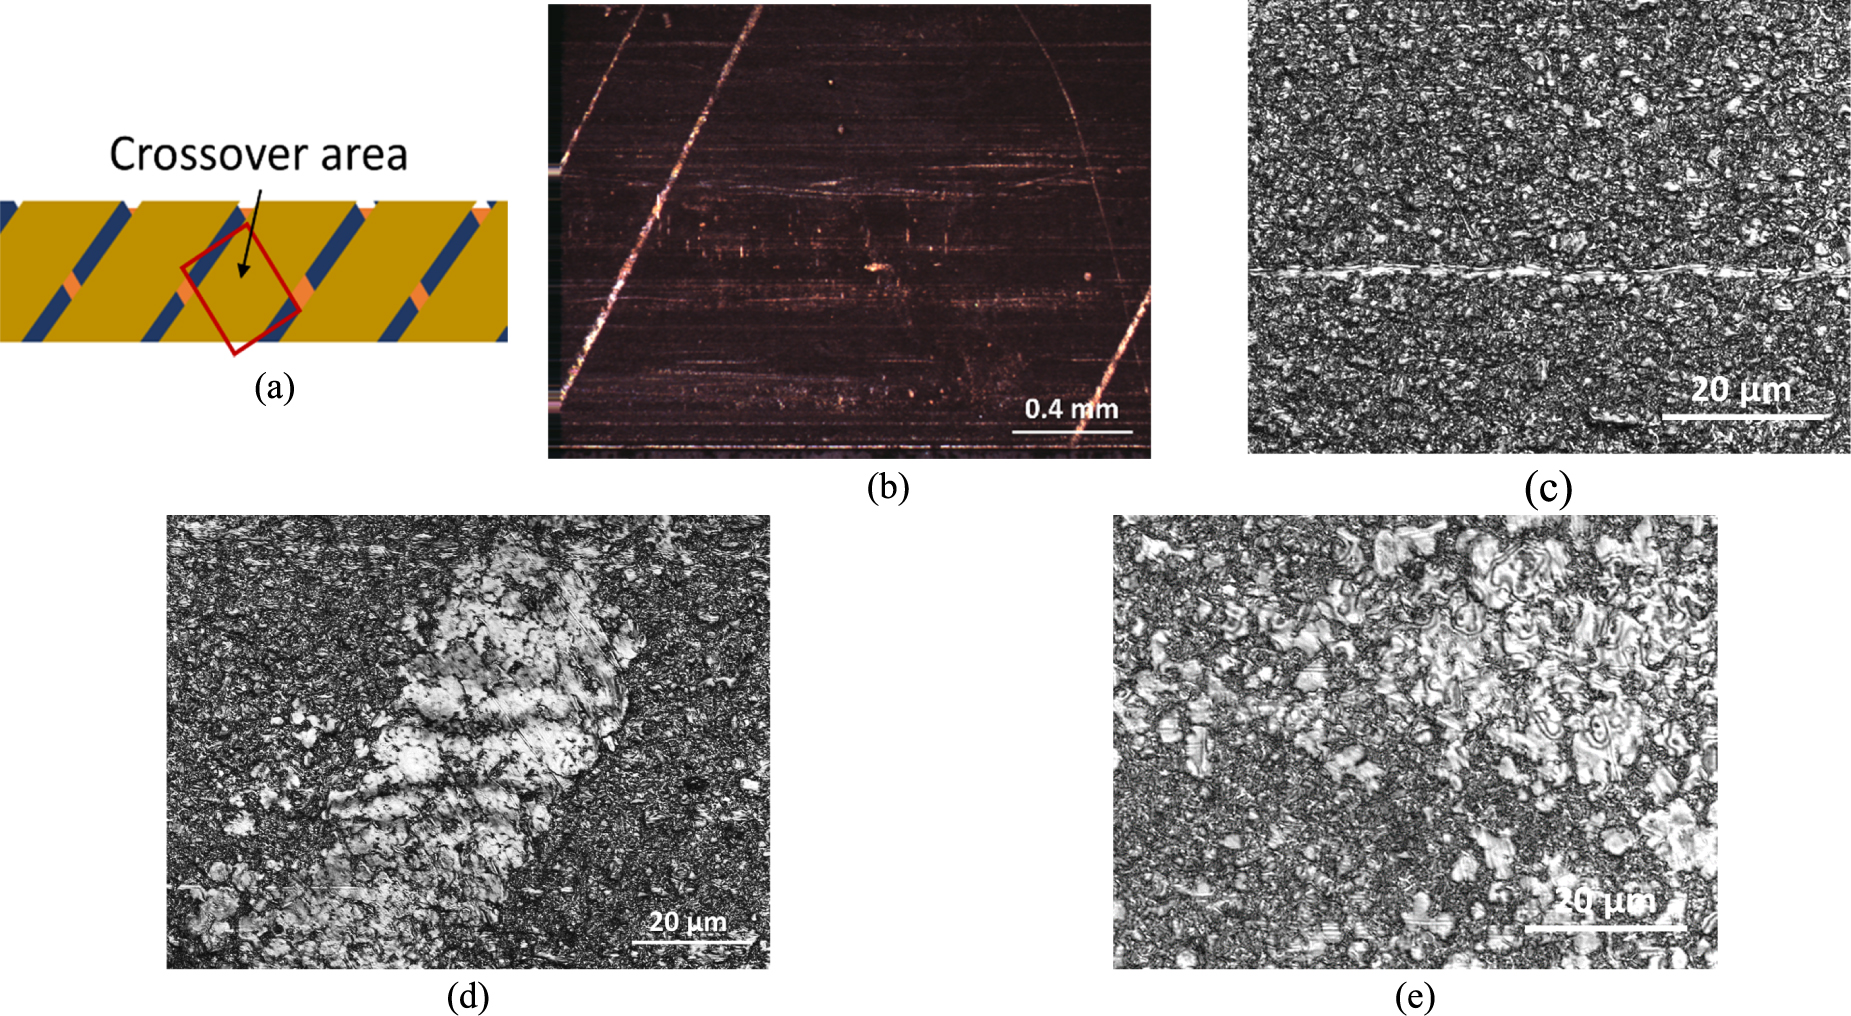
The CORC® wires were unwound and looked at under both an optical microscope and an LCM. Both techniques were used to assess the surface condition, while LCM provided measurements of surface roughness of the copper plating. In CORC® the crossover regions are depicted in figure 6(a). A low magnification image of a crossover from the CO wire is shown in (b), which corresponds to the region on the blue tape highlighted by the red box in figure 6(a). Clearly visible are diagonal lines due to plastic deformation created by tape edges of the neighboring layer pressing into the surface of the tape viewed. Figure 6(c) shows a high magnification image of the tape surface at the center of a crossover, indicating that the majority of the crossover area is not smooth. By contrast, plastic deformation at the diagonal edges of the crossover results in a smoothing of the copper surface, depicted by the brighter region in figure 6(d). The average surface roughness was measured over several area scans of 128 µm × 96 µm, producing an average roughness value of 0.5 µm, which is 10% of the copper plating thickness. By contrast, the smooth regions at the edge of the crossover had half the measured roughness.

Figure 6. (a) Close up diagram of CORC® winding, highlighting the crossover area between tapes, (b) low magnification image of the crossover area of an unwound tape, (c) high magnification image showing the roughness of the copper plating at the center of crossover, (d) high magnification of the plastic deformation at the diagonal edge of crossover, (e) high magnification image showing increase in smooth spots in bent CORC® wire.
Download figure:
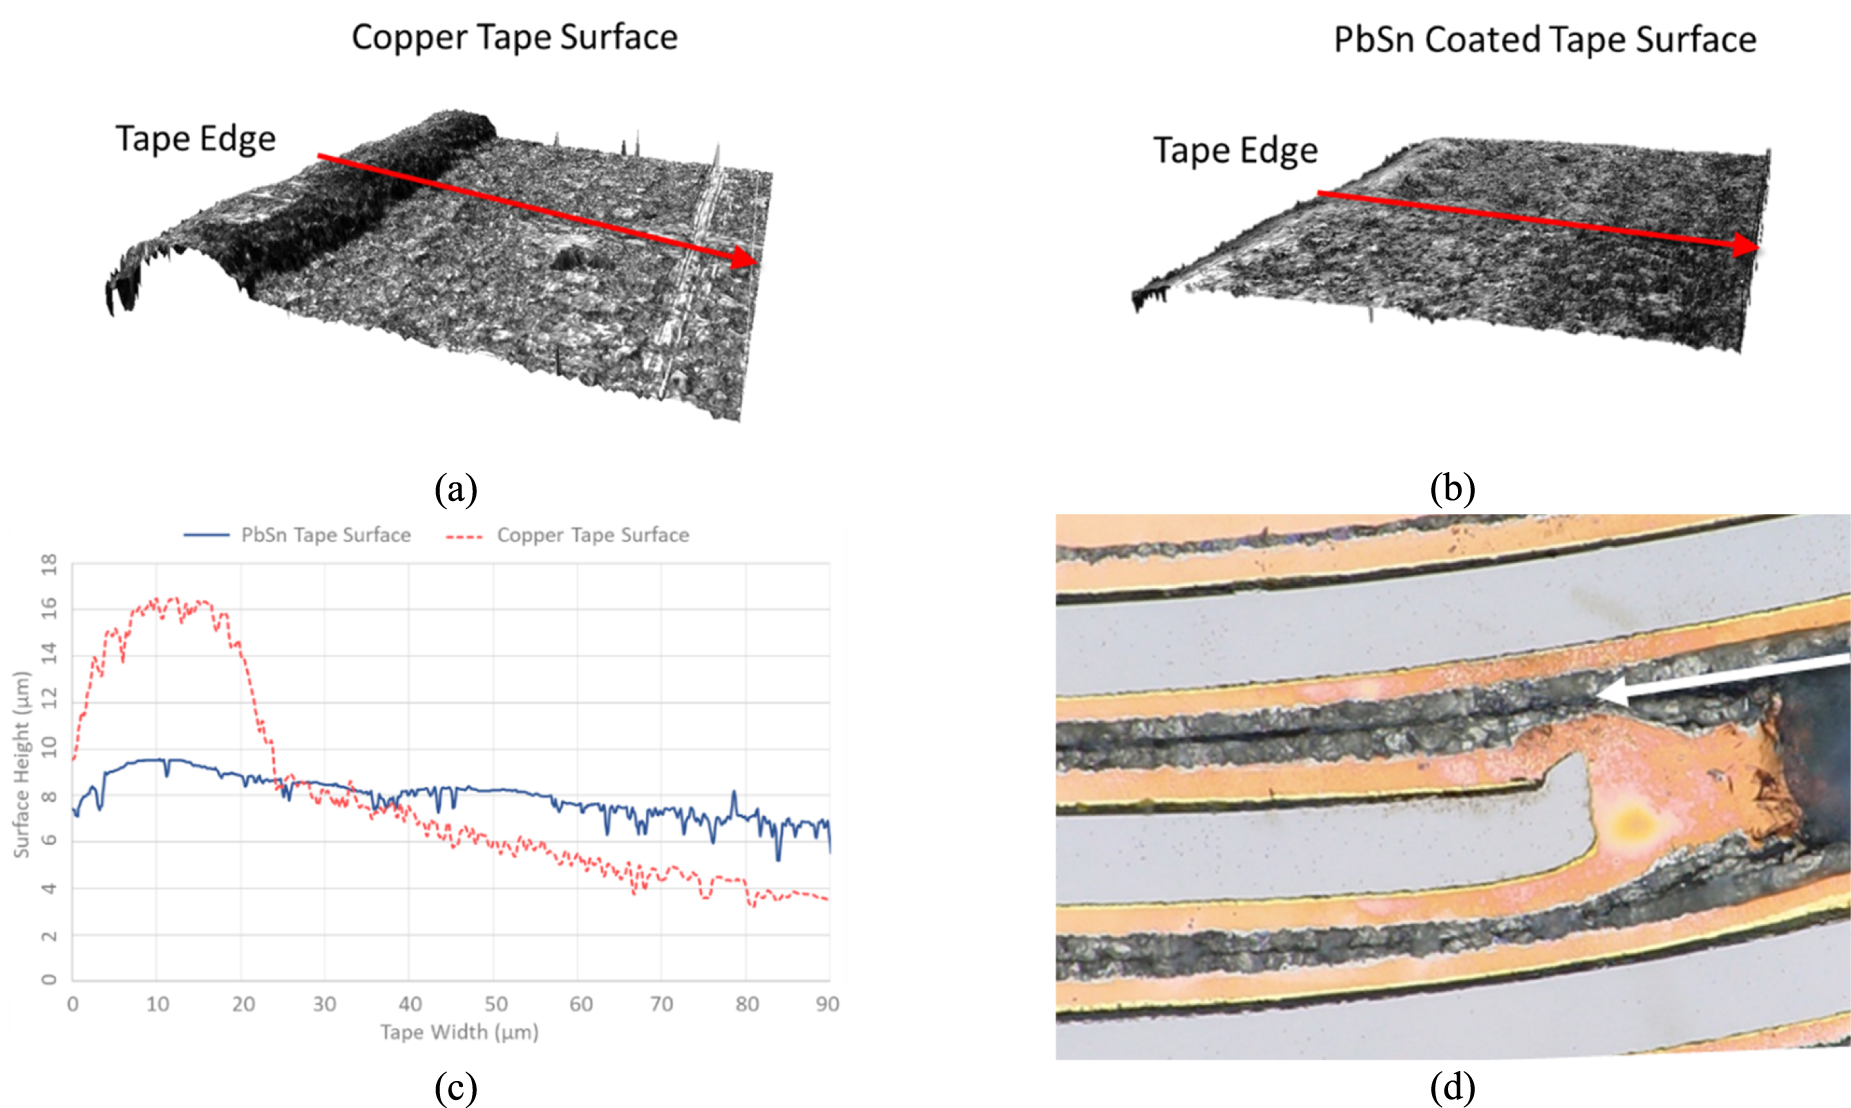
Standard image High-resolution imageThe thickness of the copper plating in REBCO is not necessarily uniform, tending to be thicker at the edges of the tape. One possible reason why the contacts between CORC® layers appears to be concentrated at the edges of the crossovers could be due to the varying thickness of the tapes. 3D imaging in combination with height analysis from the LCM confirm that the conductor is thicker at the tape edge. Figure 7(a) shows the 3D surface image of the inner surface (REBCO side) of a bare REBCO tape. The edge of the tape is noticeably thicker than the center of the tape with a distinctive lip at the tape edge. Images of the PbSn coated tapes depict a much flatter tape surface. 3D surface of the REBCO side of a PbSn coated tape, figure 7(b), shows a flat surface with a small excess of material at the edge.
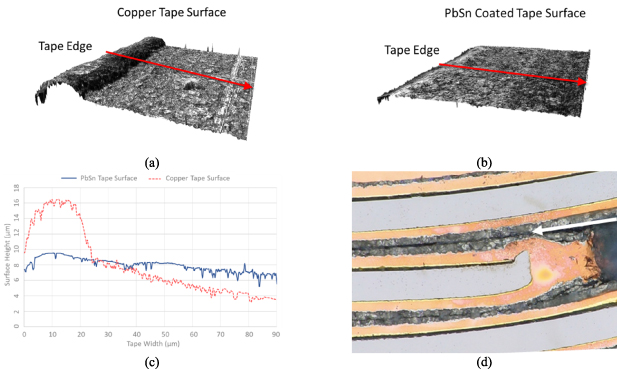
Figure 7. (a) 3D profile of the inner surface (REBCO side) at the edge of the bare REBCO tape is shown. (b) 3D profile of the inner surface (REBCO side) at the edge of the PbSn coated REBCO tape is shown. (c) Plot comparing the corresponding height profile between the two tapes. These profiles were taken from the center of each image, denoted by the red arrows. (d)High magnification image showing a hooked tape edge and how the solder fills in the gaps.
Download figure:
Standard image High-resolution imageFigure 7(c) plots representative surface height profiles for the copper and PbSn coated tape surfaces. The red arrows in figures 7(a) and (b) indicate the path for the height measurements plotted in 7(c). A height difference is a general feature of the copper tape, where at the location of the measured path there is an 8 μm height difference of copper at the edge of the untinned tape. It is possible that this is excess copper due to the plating process. The height of the copper at the tape edge is not constant, where upon analyzing multiple locations along the tape we found that the height varies between 4 and 10 μm. This feature correlates with the location of the hooked edge, which only occurs on the REBCO side of the tape. We speculate, therefore, that it is an artifact of mechanical slitting. Analysis of the substrate side revealed a flat profile. By contrast, analysis of the height profile for the tinned conductor reveals a much flatter profile. Figure 7(d) shows how the PbSn tinning fills in and smooths the abrupt topology change in the copper, which accounts for the differences in the scanned profiles.
3.3. CORC® cross-sections
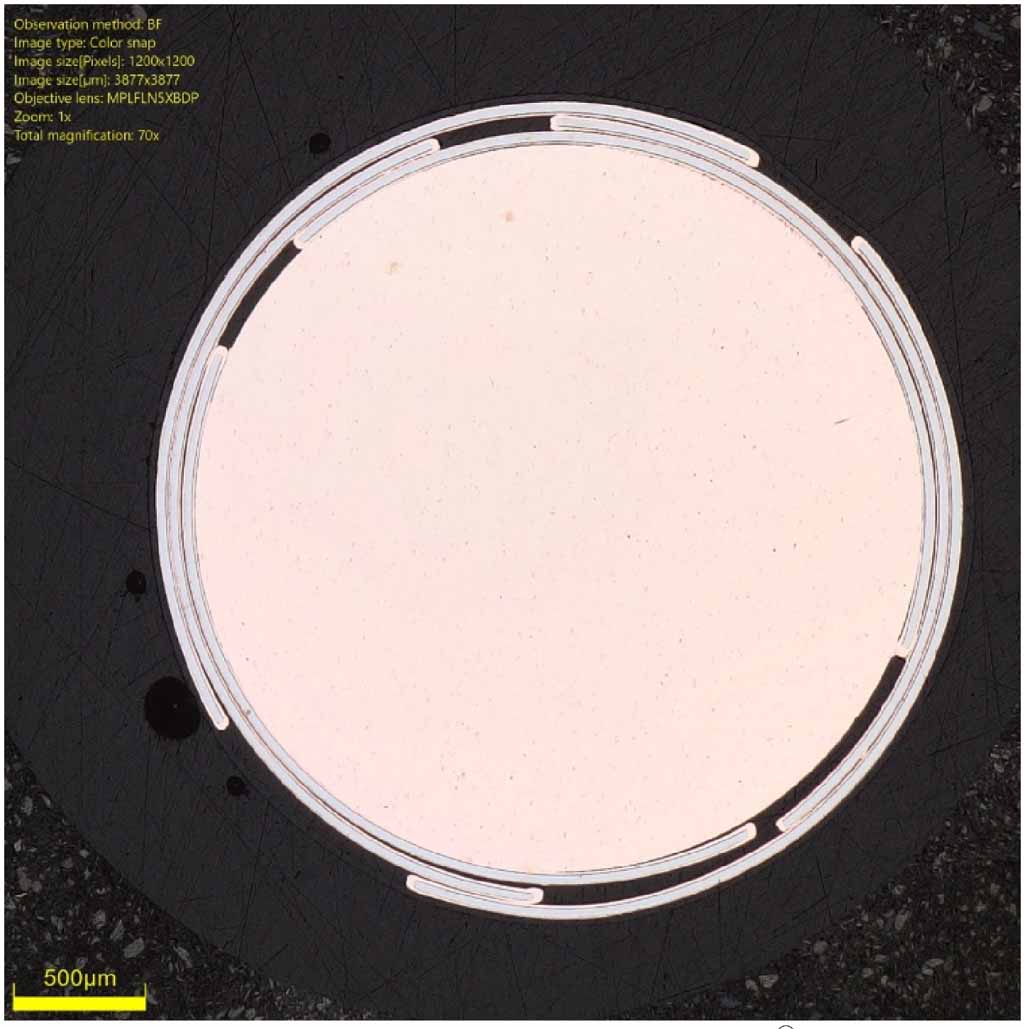
Cross-sectional images highlight the difference in contact between the bare and PbSn coated cables. Figure 8 shows a cross-sectional image of the straight CO. Scanning around the circumference, many black-colored regions appear between the conductors, indicating areas with little to no contact between copper. A 50× magnification of the cross-section highlights regions with no contact versus areas with good copper-copper contact, figure 9. There is especially good contact between the inner tapes and the copper core. Some locations where tape edges are not overlapped also show separation from the layer below, figure 9(c). In contrast, for areas where there is significant overlap the CORC® wire maintains compression between tape layers, and the black gaps between copper indicate a lack of contact in the wire, figures 9(a) and (b). There is especially poor contact between layers 1 and 2, which most likely accounts for the Rc directional dependence indicated in figure 5. The cross-sectional views are consistent with the limited contact area suggested by figure 6. Thus, it appears that the area available for current transfer between tapes is severely limited to only a few regions where the tapes are actually touching.
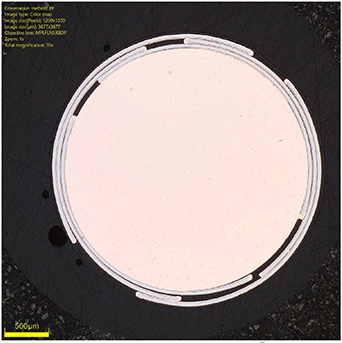
Figure 8. Cross section of straight CO CORC® wire.
Download figure:
Standard image High-resolution image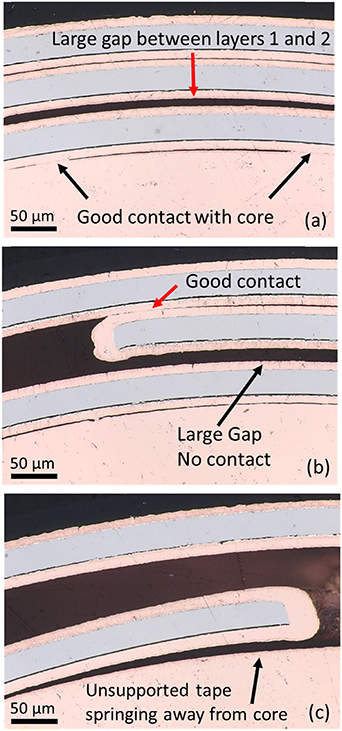
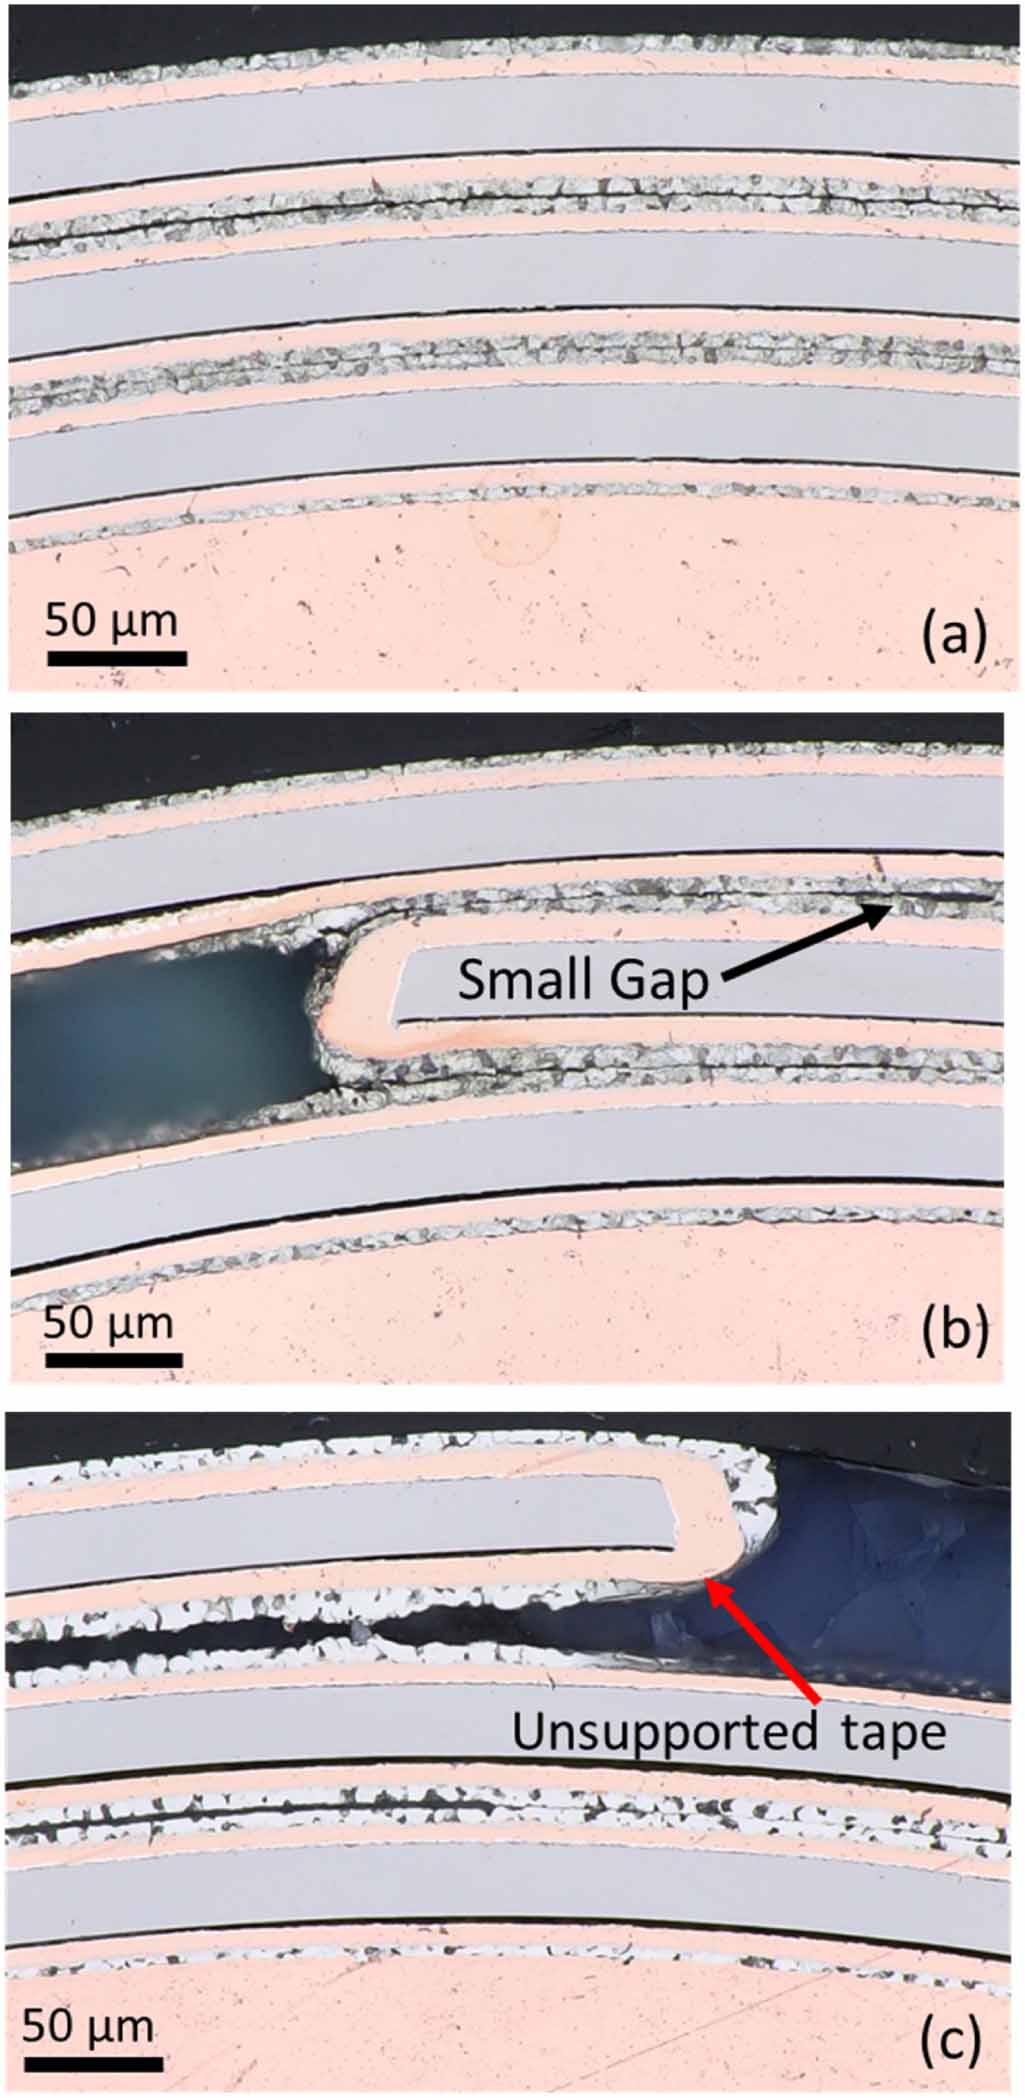
Figure 9. 50× magnification showing typical contact in the CO wire for (a) regions with significant overlap from all three layers, (b) highlighting the edge of one tape layer, (c) spring-back from unsupported tape.
Download figure:
Standard image High-resolution imageAt 10× magnification, cross sectional images of the PbSn wire before and after heat treatment look very similar to that of the CO wire in figure 8. Imaging at 50× magnification reveals that the regions between tapes are almost completely filled with solder with a few small gaps, figure 10(b). Tinning the tapes provides a much more uniform contact area over the entire crossover region. In contrast to the CO wire, there is no longer a large gap between layers 1 and 2. However, spring back will still occur on unsupported tapes as indicated in figure 10(c). Figure 11 shows the PbSn wire after a heat treatment. High magnification reveals near complete contact between tapes. These images are consistent with what would be expected for flowed solder, although here no flux has been included. As seen in figure 7(d) the hooks are still present in the PbSn coated tapes, but the solder fills in the gaps, providing a much more uniform contact surface. Figure 11(b) shows that upon heating, solder will flow into the void regions of the cable, providing a contact path between layers 1 and 3.
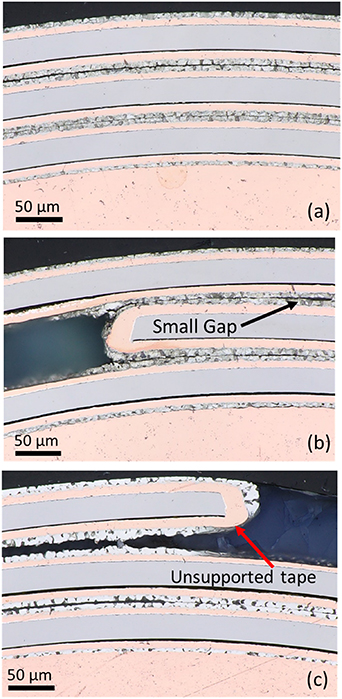
Figure 10. 50× magnification showing typical contact in the PbSn wire, before heat treatment, for (a) regions with significant overlap from all three layers, (b) highlighting the edge of one tape layer, (c) spring-back from unsupported tape.
Download figure:
Standard image High-resolution image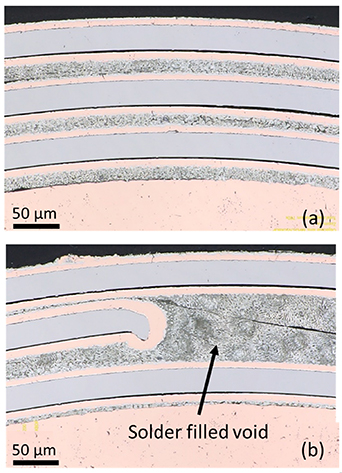
Figure 11. 50× magnification showing typical contact in the PbSn wire, after heat treatment, for (a) regions with significant overlap from all three layers, (b) highlighting the edge of one tape layer with solder filled void.
Download figure:
Standard image High-resolution image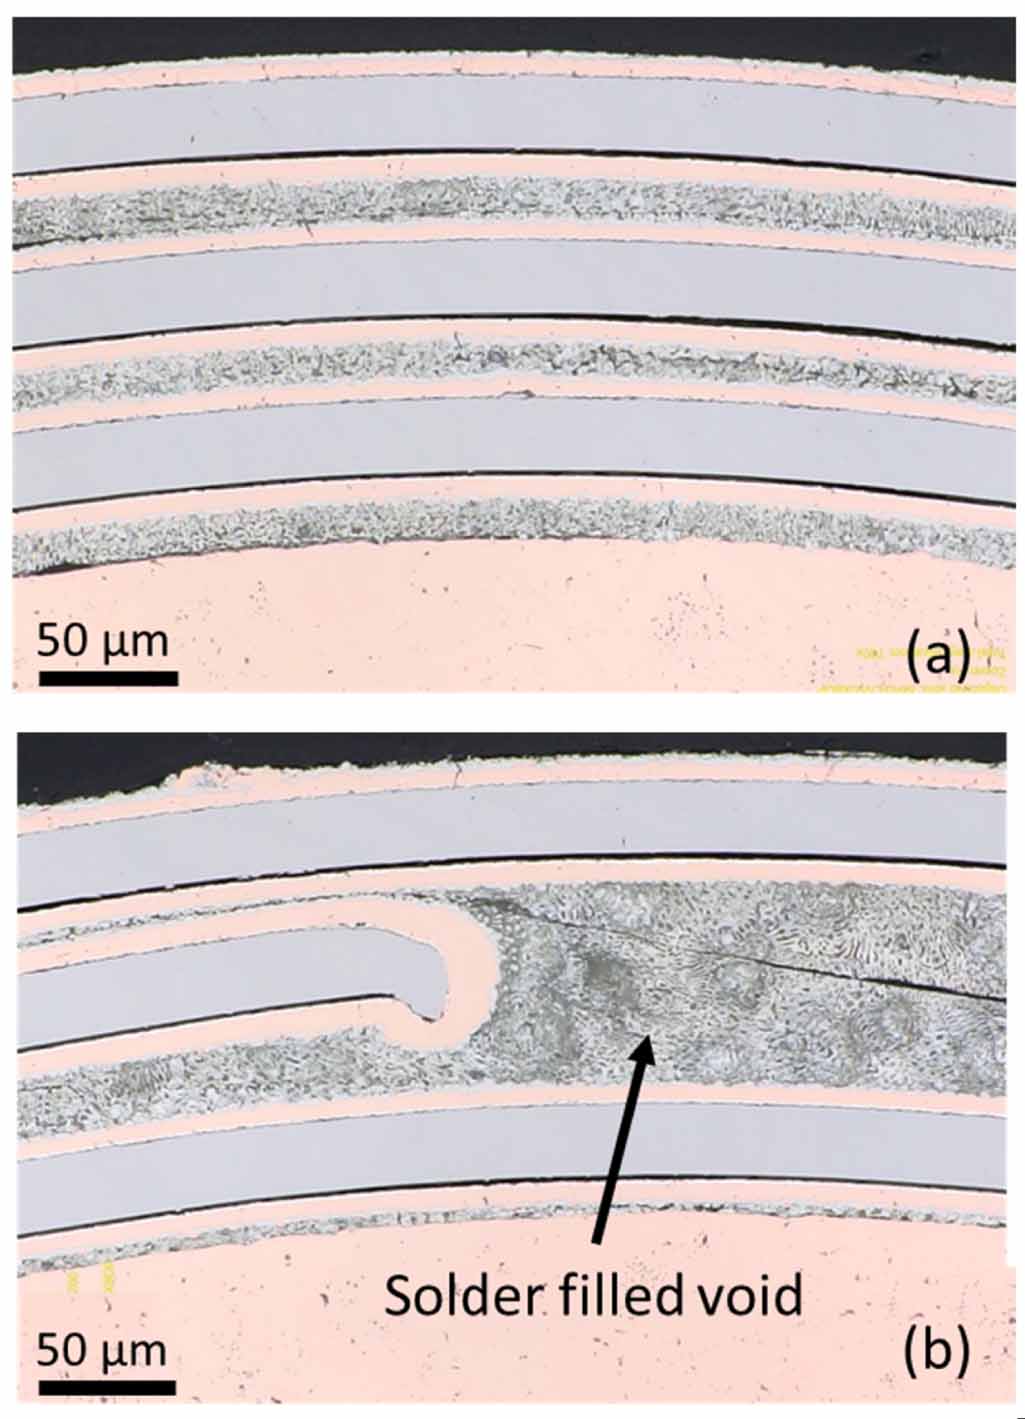
What is somewhat surprising is that good contact is also indicated for the cross section of the PbSn tinned wire before heat treatment, as shown in figure 10. Since heating the solder bonds the tapes together, it effectively eliminates any flexibility to bend the wire. The combination of good overlap contact without heating may be very favorable for applications as we discuss in the next section.
4. Discussion
4.1. Current sharing length as a function of contact resistance
An important implication of current sharing is the length required to transfer the current around a defect. The length of CORC® wire required for transferring 100% of the current, assuming a complete drop of local critical current to 0 A, can be derived from the electric field criterion,
where Itr is the amount of current transferred, R is the total contact resistance in Ω, and L is the required wire length. The total contact resistance is defined by R = Rc/ nAx , where Rc is the specific contact resistance in μΩ cm2, n is the total number of crossovers, and Ax is the crossover area. The total number of crossovers is calculated from n = 2Ntapes L/p, where p is the winding pitch, and Ntapes is the number of tapes in contact with the tape containing a dropout. Plugging the relations for n and R into equation (1) and rearranging for L gives
Determining the current sharing length in a CORC® wire is not trivial as it depends on multiple variables that change from situation to situation. Defects in interior layers can create significantly different transfer length compared to defects near the CORC® wire core or the wire surface. For our wires a tape in Layer 2 has twice as many crossovers as a tape in Layers 1 or 3. The severity of the defect also influences the current sharing length. As the severity of a defect increases, the amount of current needing to transfer increases, resulting in a longer transfer length for given voltage criterion. The required CORC® wire length to transfer 70 A current out of one tape is detailed for several values of Rc in table 5 assuming an electric field criterion of 1 μV cm−1. At high contact resistances the transfer lengths are on the order of tens of centimeters. For soldered cables, Rc = 0.6 μΩ cm2, the transfer length is on the order of one twist pitch.
Table 5. Length required to transfer 100% of critical current in one tape.
| Rc (μΩ cm2) | L (cm) Current transferred out of tape in Layer 2 (Ntapes = 4) | L (cm) Current transferred out of tape in Layer 3 tape (Ntapes = 2) |
|---|---|---|
| 1000 | 29 | 42 |
| 500 | 21 | 29 |
| 100 | 9 | 13 |
| 10 | 3 | 4 |
| 1 | 1 | 1.3 |
| 0.6 | 0.7 | 1 |
4.2. Factors that affect contact resistance
There are multiple parameters that influence Rc in CORC® wires, which we address below. As indicated by figure 5, there can be large variation in Rc even within the same wire. Such variations could have significant consequences for current sharing and current distributions within the CORC® wire.
4.2.1. Lubrication.
The non-conducting winding lubricant used by ACT can have an insulating effect on the REBCO layers, resulting in average values of Rc > 1000 μΩ cm2 in straight CORC® wires. The CO wire has a coefficient of variation CV = σ/μ =0.75. Non-uniform application of the non-conducting lubricant may produce inconsistencies in the contacts of each crossover leading to large variations in Rc, as indicated by the range bars for the CO cables in figure 4. The decrease in Rc between the CO and non-lubricated NL wires suggests that surface conditions, such as coatings, have a substantial impact on Rc. In addition to a lower average Rc value, the coefficient of variation in the straight NL wires is also reduced to 0.5. Coating with a high-conductivity lubricant in the HC wires reduced the average Rc further, suggesting that electrical conductivity of coatings is important. CO, NL, and HC tapes have comparable surface topography.
4.2.2. Handling and environment.
Environment and handling of the tapes also affects Rc. Oil and residue left by ungloved hands can increase Rc by as much as a factor of 6 as reported in [36]. No special precautions were taken beyond the standard cleaning and avoidance of moisture for the production of these wires.
4.2.3. Surface topography.
The surface topography may be the most important factor in defining Rc. Figure 6 identifies significant roughness of the tape, where the majority of the contact between tapes is confined to a thin perimeter region and occasional spots in the central overlap area. On average, the smooth edges representing polished copper are about 30–50 µm wide, so the actual contact area may be less than 10% of the total crossover area. Examining the CORC® cross sections revealed that the origin of this constraint could be the increased thickness at the tape edge, due to a hooked substrate, figure 7(d). A recent study indicates that this is probably an artifact of the slitting processes and subsequent electrodeposition of copper, with the edge topography varying depending on slitting type, manufacturer, and batch [41]. Inspection of the CO wire cross-sections, figure 8, reveals significant regions with no contact between tapes, which can lead to a significant increase in Rc. Images of multiple cross-sections, from various points along CORC® wire length, were reviewed revealing that the amount of contact between tapes varies from crossover to crossover, but always there was a preponderance of disconnected region. The variation in amount of contact between tapes can lead to a large variation of Rc from contact to contact.
Coating with PbSn produced a significant reduction of Rc. Prior to heating, the PbSn wires had a surface resistance significantly lower than that of the NL wires as well as a low variability of just ±0.4 μΩ cm2 in the straight samples, decreasing to ±0.1 μΩ cm2 in the bent samples. These ranges dropped further upon heating to melt the PbSn tinning, but the additional reduction in contact resistance was much less dramatic. While the PbSn tinning is conductive, the tapes were also coated with the non-conducting lubricant to retain flexibility. Applying PbSn to the tapes filled in topography variations, as indicated by figure 7, which then resulted in more uniform contacts at the crossovers, figures 10 and 11. Examination of multiple cross-sectional images did not reveal any significant gaps in contact between tapes. Everywhere there is solder filling in the gaps. Importantly, the solder leveled out the uneven tape surface to due slitting.
4.2.4. Contact pressure.
Rc depends also on the pressure that one tape exerts on the other. Bending the CORC® wires to a 10 cm diameter increases the contact pressure between layers as well as causes contacts to rub and become polished. This effect reduced Rc up to 80% in the NL wires, indicated by the orange squares in figure 4. REBCO tapes are not necessarily flat and smooth and the surface of the copper plating can be quite rough as indicated in figure 6(c). Contacts in straight wires receive transverse pressure via the winding tension and the shrink-wrap sheath, which appear to act only at the few asperity points in the contact center and at the tape edges. Since the surface roughness is not uniform, the amount of contact between crossovers may vary widely resulting in a large spread in Rc values. Bending strain causes increased transverse pressure and shear between tapes. Some of the asperity points yield, resulting in smooth spots, figure 6(e), and overall the number of points of contact increases. The bending action also leads to more uniform Rc values. For example, in the CO wire where the coefficient of variation is reduced by 80%.
While in general bending the CORC® wire resulted in a decreased Rc, the tinned wire exhibits very little difference before and after bending. Moreover, the increased pressure in the bent wire makes very little difference when the wire is heated to melt the solder. In both cases, the contact resistance is approaching values known for tape joints made between an REBCO side and a substrate side [37–40].
4.2.5. Springback.
One phenomenon we observed was a potential springback effect in the tapes. After winding the tapes onto the copper former they are secured in place by a 25 μm polyester heat shrink insulation. When this plastic casing is removed the tapes spring apart as shown in figure 3. When shorter CORC® wire lengths were measured, we noticed a significant increase in the specific contact resistance. We hypothesize that at the sample ends, within the shrink wrap, the tapes may be springing apart slightly. In the cross-section image figures 8–11, this could be evident by edges of tapes pulling away from the contour of the core and inner layers. As the sample length decreases, this effect becomes more pronounced. Therefore, it is important to note that for a reliable comparison between different cable types each sample measured needed to be at least 50 cm long, and all shorter lengths were not included in this discussion.
5. Conclusions
The experiment reported here examined CORC® wires specially prepared to force current to flow between layers. Three of the wires were constructed using three variations of winding lubrication, relative to standard conditions for CORC®, while one was constructed from PbSn coated tapes. These changes helped elucidate factors that could be important for current sharing.
Measurements indicate that Rc in straight CORC® wire segments can exhibit a significant amount of scatter. Contact resistance values from 10 to 1000 μΩ cm2 were observed for wires wound with standard REBCO tapes, which translates into current transfer lengths of tens of centimeters. Looking at the surfaces where neighboring tapes cross over, imprints of tape edges were visible, which suggests that the contact area could be limited to a small fraction of the total overlap area in this straight, as-wound condition. Because these wires are not subjected to actions that induce deformation of the copper at the tape-to-tape interface, other factors, such as roughness, lubricant coverage, or oxidation, can amplify the scatter. Changing lubricant reduced Rc systematically, from higher values for a non-conductive lubricant to lower values for a conductive lubricant. Cross-sectional images confirmed that large portions of the tapes are not actually touching, where in particular artifacts of slitting cause the tape edge to protrude and push apart central areas of the overlapping tapes. Bending wires applies forces that further scrape or polish contacts as well as increasing transverse pressure, especially on the tensile side. While these actions significantly reduce Rc, other impacts on the wire were not comprehensively assessed, nor was re-bending attempted.
A significant opportunity for applications that depend on current transfer could be presented by winding cables from tinned conductor. The CORC® wires wound from PbSn coated tapes had a significantly lower Rc than in the other wires, approaching a baseline value for joints made with the REBCO side of one tape contacting the substrate side of another tape. The PbSn cable had Rc= 2 μΩ cm2, a contact resistance that approached the value needed to facilitate current transfer over length comparable to the CORC® wire twist pitch. This was obtained without heating the solder, and the wire could be bent without damage as a result. Contact resistance further decreased to 0.7 μΩ cm2 after a heat treatment to melt the solder. The primary benefit of tinning appears to be topological in nature. Imaging showed that the solder smooths topological asperities and fills in contours next to the tape edge, which produces a much flatter surface than in the cables made with standard conductors. This flatter surface increases the contact between tapes, and there may be other effects such as resilience to oxidation. Our results indicate that simply winding CORC® wires from tinned tapes provides sufficient contact between tapes to reduce Rc to low levels without the need to flow the solder, therefore maintaining wire flexibility. Our overall effort suggests that manipulating contact topography between tapes is the best way to control Rc.
Acknowledgments
This work was supported by the National High Magnetic Field Laboratory, which is supported by National Science Foundation through NSF/DMR-1644779 and by the US Department of Energy under Grant Numbers DE-EE0007872, DE-SC0022011 and DE-SC0014009. We acknowledge extensive discussions with S Pamidi at the Center for Advanced Power Systems at Florida State University; with D Hazelton at Furukawa Superpower; with D Larbalestier, E Bosque, J Jarozcynski, J Lu, X Hu, and other members of the REBCO research team at the Applied Superconductivity Center at Florida State University; and with M Marchevsky, T Reed, X Wang, and S Prestemon at Lawrence Berkeley National Laboratory.
Data availability statement
All data that support the findings of this study are included within the article (and any supplementary files).