
Abstract
High resolution  Fulcher band spectroscopy was used in the MAST-U divertors during Super-X and (shorter-legged) elongated divertor density ramps with
  fuelling from the mid-plane high-field side. In the Super-X case, the upper divertor showed ground state rotational temperatures of the
  molecules increasing from ~6000 K, starting at the detachment onset, to ~9000 K during deepening detachment. This was correlated with the movement of the Fulcher emission region towards the X-point, which is in turn correlated with the movement of the ionisation source. The increase in rotational temperature occurred throughout the divertor except near the divertor entrance, where ionisation was still the dominant process. Qualitative agreement was obtained between the lower and upper divertor. Similar rotational temperatures were obtained in the elongated divertor before the detachment onset, although the increase in rotational temperature during detachment was less clearly observed as less deep detachment was obtained. The measured vibrational distribution of the upper Fulcher state does not agree with a ground state Boltzmann distribution but shows a characteristically elevated population in the ν = 2 and ν = 3 bands in particular; which is strongly correlated to the rotational temperature.
Export citation and abstract BibTeX RIS

Original content from this work may be used under the terms of the Creative Commons Attribution 4.0 license. Any further distribution of this work must maintain attribution to the author(s) and the title of the work, journal citation and DOI.
1. Introduction
One of the major issues facing future tokamak devices is that the heat fluxes arriving at the divertor target plates during operation can exceed material limits [1, 2] by orders of magnitude unless steps are taken to ensure otherwise. Divertors in reactors will need to operate in a so-called 'detached' state in which simultaneous particle (e.g. ion), momentum and power losses occur [3–7]. This facilitates reductions in the ion target flux, as the divertor plasma is cooled, leading to orders of magnitude heat flux reductions.
Collisions and reactions between the plasma and the molecules in the divertor volume can result in rovibronic (e.g. rotational, vibrational and electronic) excitation. Some of these collisions lead to momentum and energy transfer from the plasma to the neutral molecular cloud, resulting in power and momentum dissipation especially at the 'killer' flux tubes [8–10] (figure 1(a)). Vibrationally excited molecules can undergo plasma-chemistry reactions with the plasma, resulting in molecular ions such as  and, potentially,
  (figure 1(b)). These ions react with the plasma (figure 1(c)), resulting in additional dissociative channels leading to a hydrogen atom source (Molecular Activated Dissociation—MAD) as well as ion sources and sinks through molecular activated ionisation (MAI) and molecular activated recombination (MAR) [4, 11, 12]. Recent spectroscopic analysis has indicated that MAR and MAD can influence the progression of detachment significantly on MAST Upgrade [12], TCV [4, 13] and JET [14].

Figure 1. Schematic overview of various reactions and collisions resulting in excited atoms and molecules and thus hydrogen Balmer emission and  Fulcher emission. a-e indicate different collision/reaction mechanisms and are referred to in the text. Reproduced with permission from [15]. CC BY-NC-ND 4.0.
Download figure:
Standard image High-resolution image1.1. MAST Upgrade and the Super-X divertor
It is currently unknown whether conventional divertors will facilitate sufficient power exhaust performance whilst maintaining acceptable core performance [2]. Therefore, as a risk mitigation strategy, alternative divertor concepts (ADC) are being developed and tested [12, 16–19]. The Mega Amp Spherical Tokamak Upgrade (MAST-U) is a new tokamak, based at UKAEA in Culham, UK, that supports a range of ADCs in tightly baffled upper and lower divertor chambers, including the Super-X divertor, as well as a more conventional divertor [8, 12, 16, 18]. In the Super-X divertor, the strike point is moved to a larger target radius, resulting in lower magnetic field at the target and a high total flux expansion [20, 21]. This is predicted to enhance access to plasma detachment and optimise power exhaust capabilities [20].
The first MAST-U results have shown a greatly improved power exhaust performance in the Super-X divertor [12, 18]. Detailed analysis of the physics mechanisms during detachment in the Super-X divertor have shown that plasma-molecular chemistry, including MAR and MAD, plays an unprecedentedly strong role in the tightly baffled divertor chambers when the ionisation source is significantly detached from the target. This results in a build-up of MAR downstream of the ionisation region towards the target [12, 22].
1.2. Visible spectroscopy:  Balmer and Fulcher emission


Plasma-neutral interactions result in excited hydrogen atoms and molecules that can be detected through visible spectroscopy of both hydrogen Balmer ( ) and Fulcher (
 ) emission. Analysing such information can provide quantitative information on the divertor conditions [13, 23–30] as well as the plasma-neutral interaction processes, providing critical information for diagnosing and developing an understanding of power exhaust and detachment in tokamak divertors.
Excited hydrogen atoms arise from atomic interactions, such as electron impact excitation (figure 1(d)) and electron-ion recombination (EIR) (figure 1(e)), as well as plasma-molecular interactions that ultimately result in excited hydrogen atoms. In detached conditions, the latter possibility mostly arises from interactions between the plasma and molecular ions ( , and
, and  which decays into
  ) (figure 1). The development of new Balmer emission analysis techniques [23, 24], such as the BaSPMI technique (Balmer Spectroscopy for Plasma–Molecule Interaction) [4], enables separation of the hydrogen Balmer line emission into its different contributors. This information can be used quantitatively to estimate the ion sources and sinks from both plasma-atom and plasma-molecular interactions (ionisation, EIR, MAR, MAI) as well as the hydrogenic radiative and net power losses.
Unlike  Balmer emission, the less well-known
  Fulcher band originates not from hydrogen atoms, but from the electronic de-excitation of hydrogen molecules. More specifically, we make use of the Q-branch of the diagonal Fulcher transitions between the electronic triplet states:
  . The threshold energy required for the electronic excitation which facilitates this Fulcher transition is about 12 eV. Strong
  Fulcher band emission, however, occurs at 4–5 eV where a much larger molecular density (which increases with decreasing temperature [12, 31]) is balanced optimally with there still being a large enough number of hot electrons in the tail of the electron Boltzmann distribution. This coincides with both the electron-impact dissociation and the (atomic) ionisation regions [12]. In this way, the location of Fulcher emission can be used as a temperature constraint as well as a proxy for the ionisation source [12, 27], which can be useful for divertor detachment studies and divertor detachment control.
1.2.1. The importance of the rotational and vibrational distribution.

The Fulcher band, though, has yet more to offer since information regarding the rotational and vibrational distributions of hydrogen molecules is also encoded within its multitude of transitions, and can be extracted via high resolution spectroscopy. If the rotational and vibrational distribution measurements follow a Boltzmann distribution, they may be summarised with a rotational and vibrational temperature respectively [30, 32, 33]. The rotational and vibrational structure of the Fulcher band is described in detail in the
Collisions between the plasma and the molecules result in energy and momentum transfer from the plasma to the molecules, which can be a critical ingredient to detachment according to SOLPS-ITER simulations [8–10, 34]. Assuming that the rotational temperature is a proxy for the gas temperature of the molecules and thus a reasonable indicator for kinetic energy (see
The vibrational distribution plays a crucial role in plasma chemistry. Dissociative attachment ( ), molecular charge exchange (
 ), D2 ionisation (
 ) and electron-impact dissociation (
 ) all have cross-sections with strong dependencies on the vibrational distribution. For molecular charge exchange and dissociative attachment in particular, the dependency spans multiple orders of magnitude. Reactions that generate molecular ions that drive the experimentally observed plasma chemistry are, therefore, driven to a great extent by the vibrational distribution. Although vibrationally resolved plasma-edge simulations exist [35, 36], plasma-edge simulations generally utilise 'effective' rates for plasma-molecular interactions instead. Within such simulations, a vibrational model is implicitly assumed in the derivation of the 'effective' rates, whilst transport and plasma-wall interactions are assumed to have a negligible impact on the vibrational distribution [37]. Additionally, even if vibrationally resolved simulations are utilised, the reactions included that result in vibrational (de)excitation, the cross-sections used for such reactions, as well as the impact of plasma-wall interactions on the vibrational distribution are all debated in literature [12, 35, 36, 38–41]. Validating the various models and assumptions is critical for ensuring plasma-chemistry reaction mechanisms are correctly included in plasma-edge models; which is important for extrapolating current knowledge to reactor-class devices through plasma-edge simulations.
1.3. This paper
The aim of this paper is to present an analysis of the first high resolution  Fulcher band data obtained from the MAST-U divertor chambers in the Super-X divertor, as well as more conventional divertor topologies, from the machine's first experimental campaign in 2021. This analysis provides measurements of the rotational and vibrational distribution of the molecules during experiments where the core density is scanned to study the onset of, and the physics mechanisms during, detachment.
In section 2, both the divertor monitoring spectroscopy available on MAST-U during the first campaign, and the discharges for which high resolution Fulcher band spectra were obtained, are described. Details of the structure of the Fulcher band, the theory and the established methods for analysing rotational and vibrational distributions for diatomic molecules such as D2 are described in the
2. Experimental setup
2.1. Discharges examined in this paper
Discharges 45068 and 45244 are both  kA ohmic discharges with a fuelling ramp (from the mid-plane high-field side at the position indicated in figure 2) to scan the core and separatrix densities and vary the degree of detachment. The magnetic equilibria are shown in figures 2(a) and (b) respectively. The strike point for discharge 45244 in the Super-X configuration is on 'tile 5'—see figure 2(b). The strike point for a conventional divertor discharge would be on 'tile 2 to 3' (not shown), while that of discharge 45068 is on 'tile 4'—see figure 2(a). For this reason discharge 45068 is referred to as an 'elongated divertor' (ED). This geometry has additional spatial coverage of the divertor leg with the various divertor spectrometers as well as divertor imaging [27, 42], in comparison to the 'conventional' divertor geometry (CD).

Figure 2. The magnetic equilbria forming (a) the elongated divertor and (b) the Super-X divertor configurations for shots 45068 and 45244 respectively. Note the numbering of the divertor tiles from 1 to 5.
Download figure:
Standard image High-resolution imageDetails of the evolution of Ohmic power, D2 fuelling gas flux, core line-averaged density (expressed as a fraction with respect to the Greenwald limit), and integrated ion flux (from Langmuir probe measurements) are shown in figures 3(a) and (b) for shots 45068 and 45244 respectively. The shaded region in the graphs between 500 ms and 800 ms indicates the period during which the equilibria were fully formed and held constant.

Figure 3. The ohmic power, gas fuelling rate, Greenwald fraction and integrated ion flux (upper divertor) for: (a) elongated divertor shot 45068; and (b) Super-X divertor shot 45244. In both cases fuelling is from the high-field side mid-plane.
Download figure:
Standard image High-resolution image2.1.1. High resolution divertor spectroscopy in the MAST-U divertor.
During the first experimental campaign, three spectrometers were used for spectroscopy in the divertors [12]. Table 1 summarises the spectrometer parameters. The 'York' spectrometer and the 'CCFE' spectrometer covered 20 lines of sight each which were interspersed through the lower divertor as shown in figure 4(a). Meanwhile, the Divertor Imaging Balmer Spectrometer or 'DIBS' surveyed the upper divertor with 16 lines of sight which have a tangential component and track across tiles 4 and 5; and a further ten lines of sight fanning across tiles 1 to 3 in the poloidal plane as shown in figure 4(b). For high resolution Fulcher band spectroscopy, the following gratings were used at the following wavelengths: The 'York' spectrometer used a 1800 l mm−1 grating (with a dispersion of 0.016 nm/pixel and a spectral resolution (i.e. full-width-half maximum instrumental function) of 0.040 nm) and covered a spectral range from 596 nm to 612 nm; the 'CCFE' spectrometer used a 1200 l mm−1 grating (with a dispersion of 0.019 nm/pixel and a spectral resolution of 0.070 nm) and covered a spectral range from 611 nm to 631 nm; and the 'DIBS' spectrometer used a 1800 l mm−1 grating (with a dispersion of 0.02 nm/pixel and a spectral resolution of 0.04 nm) and covered a range from 595 nm to 626 nm.

Figure 4. Depictions of the divertor spectroscopy. (a) shows the lower divertor in which the green and pink lines of sight are connected to the 'York' spectrometer; and the red and cyan to the 'CCFE' spectrometer. (b) shows the upper divertor in which all lines of sight are connected to the 'DIBS' spectrometer. The black numbers refer to the tile numbers. The cyan and orange shading indicate the elongated divertor and Super-X divertor magnetic geometries respectively.
Download figure:
Standard image High-resolution imageTable 1. Spectrometer parameters. The colour coding of the arrays relates to figures 4(a) and (b).
| Spectrometer | Divertor | Range | Arrays | Grating | Resolution |
|---|---|---|---|---|---|
| York | Lower | 596–612 nm | 1–10, 11–20 figure 4(a) | 1800 l mm−1 | 0.04 nm |
| CCFE | Lower | 611–631 nm | 1–10, 11–20 figure 4(a) | 1200 l mm−1 | 0.07 nm |
| DIBS | Upper | 595–626 nm | 1–16, 17–26 figure 4(b) | 1800 l mm−1 | 0.04 nm |
All three spectrometers were used simultaneously for the discharges analysed in this paper. Unfortunately, the 'CCFE' spectrometer did not provide sufficient spectral resolution to accurately pick out many of the Fulcher band lines, in contrast to the 'York' and 'DIBS' spectrometers. This limited high resolution coverage in the lower divertor to the ν = 0 and a part of the ν = 1 vibrational bands via the 'York' spectrometer. Therefore, an analysis of the vibrational distribution was only performed for the upper divertor using the 'DIBS' spectrometer which covered the  bands simultaneously, whereas the rotational distribution could be analysed for both divertor chambers.
3. Results
3.1. Methodology of inferring the rotational and vibrational distribution of in the MAST-U divertor

In this section, aspects of the methodology specific to this study are outlined; along with the MAST-U results.
For details regarding the  Fulcher band, its rotational and vibrational structure, and how these may be determined from Fulcher band spectroscopy, the reader is referred to the
An example of a high resolution spectrum obtained from the upper divertor spectrometer ('DIBS') is shown in figure 5 as an example. This spectrometer covers all the Fulcher band transitions listed in figure 19 in the

Figure 5. Example of MAST-U high resolution Fulcher band spectroscopy (data from shot 45244, 'DIBS' spectrometer, line of sight 11, time = 500 ms. The dotted lines labelled Q( -
- )N are the published Q-branch lines taken from [43].
Download figure:
Standard image High-resolution imageIn figure 5, and in the rest of the text, transitions are referred to using the notation  where
where  and
and  refer to the vibrational bands in the upper and lower electronic states respectively, and N refers to the rotational quantum number preserved in the Q-branch transition.
Only the relative intensity of the various Fulcher transitions is required to infer the rotational and vibrational distributions. We found that the most reliable method for determining the relative intensities is to use the peak height of the observed transitions ( ) rather than integrating over the line, since the wings of the spectral lines are often contaminated by other transitions (figure 5). The absolute intensity is obtained by integrating the spectral line, which can be approximated by its peak height times a function representing its shape which is normalised to the peak height:
  . Since all the monitored
  Fulcher transitions are fully dominated by their instrumental broadening, meaning that
  is the same for every Fulcher transition, the relative intensities are approximately proportional to their relative peak heights
  . If the rotational states form a Boltzmann distribution, then we can write:

where  replaces
  in equation (12) derived in the
  is the degeneracy due to nuclear motion and
  is the degeneracy originating from the relative orientation of nuclear spin (note: the three-fold degeneracy coming from the relative direction of the electron spin and nuclear motion is absorbed into the constant). This allows evaluation of a rotational temperature Trot.
The experimentally obtained lines are corrected for the plasma background emission (e.g. Bremsstrahlung). One disadvantage, however, of replacing the relative intensities with relative peak heights is that the sensitivity to the signal to noise ratio is increased, which drives most of the uncertainty. Additionally, the precise location of a spectral line, with respect to discrete nature of the pixels on the spectroscopy camera, leads to uncertainties in  between different transitions, leading to additional uncertainties in
  . Considering the Lorentzian-like nature of the instrumental function with a full-width-half-maximum of roughly 2.5 pixels, this is expected to lead to an uncertainty of 15%. If significant overlap with other
  Fulcher lines or other contaminating transitions occurs, the amplitude is influenced by the contaminating line. Hence, only transitions are used where the closest contaminating line is at least 0.04 nm away. Assuming two spectral lines are 0.04 nm apart with equal intensity, this would introduce an error of 20% in the estimation of the peak height. Due to the various uncertainties, the uncertainty in
  is at least 25%, regardless of the signal to noise ratio. To take an example from the spectrum in figure 5, the peak which has the closest proximity to another peak (and which is used in the analysis) is Q(0-0)6. This peak is separated from its neighbour by 0.06 nm and has an associated error of about 10%.
The identification of potentially significant overlapping transitions is aided using the tables provided by Lavrov and Umrikhin [43] together with an inspection of the spectral line shapes. In particular, the  transitions interfered with the analysed Q-branch. The lines impacted by contamination are disregarded from the analysis and the retained transitions were:
- Q(0-0): N = 2, 3, 4, 6, 7, 8, 9, 12, 13, 14, 15
- Q(1-1): N = 5, 6, 7, 9, 11, 14
- Q(2-2): N = 4, 6, 7, 8, 9
- Q(3-3): N = 2, 3, 4, 5, 7.
3.2. Inferring the rotational temperature in the MAST-U divertor

Figure 6 shows some examples of the rotational distribution of the upper Fulcher states ( ) using upper divertor spectroscopy data. If this distribution follows a linear trend, it means that the rotational distribution follows a Boltzmann relationship and a rotational temperature can be obtained from the linear fit as shown
7
. At sufficient signal to noise levels, the rotational distribution showed good agreements to a Boltzmann scaling for Q(0-0) and Q(1-1) and it was, therefore, possible to extract rotational temperatures from these bands with relatively low uncertainty using a Theil-Sen method [44]. The uncertainties can be seen as representing the goodness of the Boltzmann fit. The linear fits for Q(2-2) and Q(3-3) (not shown) have much higher uncertainty due to increased signal to noise ratio and may not follow a Boltzmann distribution as clearly as for Q(0-0) and Q(1-1). For example, the uncertainties in the Q(2-2) temperatures were typically of the order of over 50%; and the Q(3-3) uncertainties were so large that the results were not meaningful. There is also a general decrease in the goodness of fit as the rotational temperature increases. This may be connected to the small Boltzmann gradients getting even closer to zero (see equation (12)). The temperatures for Q(2-2) and Q(3-3) were later constrained by using a Bayesian fitting method to within 50%.
) using upper divertor spectroscopy data. If this distribution follows a linear trend, it means that the rotational distribution follows a Boltzmann relationship and a rotational temperature can be obtained from the linear fit as shown
7
. At sufficient signal to noise levels, the rotational distribution showed good agreements to a Boltzmann scaling for Q(0-0) and Q(1-1) and it was, therefore, possible to extract rotational temperatures from these bands with relatively low uncertainty using a Theil-Sen method [44]. The uncertainties can be seen as representing the goodness of the Boltzmann fit. The linear fits for Q(2-2) and Q(3-3) (not shown) have much higher uncertainty due to increased signal to noise ratio and may not follow a Boltzmann distribution as clearly as for Q(0-0) and Q(1-1). For example, the uncertainties in the Q(2-2) temperatures were typically of the order of over 50%; and the Q(3-3) uncertainties were so large that the results were not meaningful. There is also a general decrease in the goodness of fit as the rotational temperature increases. This may be connected to the small Boltzmann gradients getting even closer to zero (see equation (12)). The temperatures for Q(2-2) and Q(3-3) were later constrained by using a Bayesian fitting method to within 50%.

Figure 6. MAST-U shot 45244, Upper divertor, line of sight 8, time = 500 ms. Boltzmann plots of the Q branch transitions. Plots (a) and (b) show the plots for the Q(0-0) and Q(1-1) respectively.
Download figure:
Standard image High-resolution image3.3. Evolution of rotational temperature and overall Fulcher emission
Figure 8 shows the evolution of the rotational temperature with Greenwald fraction (figure 3(b)) during shot 45244 (Super-X divertor configuration) in the lower divertor and figures 9 and 10 show the evolution in the upper divertor. The upper divertor results are divided into two diagrams to depict the observations from the two separate viewing fans (see figure 4(b)). Figures 12–14 show the same evolutions for shot 45068 (elongated divertor configuration).
Spectrally integrated  Fulcher emission (spectrally integrated between 598-605 nm) in the lower divertor was captured by the multi-wavelength imaging (MWI) system [27]. Its inversions are shown in figures 7 and 11 for the SXD and ECD fuelling scans respectively, and show the evolution of the 2D Fulcher emissivity profile in the divertor chamber with time (and thus Greenwald fraction). The
  Fulcher emissivity profile shows clear strike point splitting, which occurs at low densities (
 25% core Greenwald fraction) and is caused by MHD activity and penetration of the error field. As detachment progresses, the downstream-end of the 2D Fulcher emissivity detaches from the target and moves upstream, which is a proxy for the movement of the ionisation front [4, 12, 27].

Figure 7. Discharge 45244 (Super-X). Spectrally integrated  Fulcher emission maps in 2D at different times, obtained by inverting the MWI measurements.
Download figure:
Standard image High-resolution imageThe following should be noted:
- The upper divertor poloidal fan (lines of sight 17–26) roughly mirrors to the lower divertor lines of sight 9–20 as can be seen from inspection of figures 4(a) and (b).
- There may be differences between the measurements in the two divertors due to factors such as asymmetry and strike-point splitting (as can be observed in figures 7 and 11). Additionally, the 'DIBS' CCD sensor does not have a frame transfer, leading a relatively low exposure time to framing time ratio (0.6), which causes significant vertical shift smearing [45], smoothing out the results over the lines of sight.
- The uncertainty in the absolute brightness of the upper divertor spectrometer is significantly larger than in the lower divertor, due to vertical shift smearing. Additionally, the upper divertor spectrometer ('DIBS') captures a larger wavelength range than the lower divertor spectrometers, and, in the case of the first array, integration path lengths of the lines of sight through the divertor plasma are longer due to its tangential nature. Therefore, the absolute Fulcher emission brightnesses cannot be compared between the lower and upper divertor and the upper divertor brightnesses should be considered in a relative sense.
- The 'DIBS' spectrometer was used with an electron-multiplication gain of 10 for discharge 45244 (the Super-X case) and without electron-multiplication gain for discharge 45068 (the elongated divertor case). As a consequence, the latter has a greatly reduced signal to noise level leading to much larger error bars in the rotational temperatures inferred (figures 13 and 14); and prevents a useful inference of vibrational distribution for this discharge.
Figures 9 and 10 clearly show a rise in rotational temperature across most of the divertor as detachment occurs and deepens during the Super-X discharge 45244. The ground state rotational temperature rises from below 6000 K at the start of the Super-X at 500 ms and a Greenwald fraction of 0.12, to 8000 K or 9000 K at 800 ms and a Greenwald fraction of 0.24. This occurs fairly consistently in all lines of sight except those near to the divertor chamber entrance (21–26 in the second 'DIBS' array (see figure 10)) where the temperature rise is significantly smaller. The increase in the rotational temperature seems to be correlated with the reduction of the  Fulcher band brightness and thus the movement of the Fulcher emission region/ionisation front, as can be observed from the MWI inversions (figure 7).
A similar conclusion can be drawn from the lower divertor results shown in figure 8. The rotational temperature in the lower divertor appears to rise from below 5000 K to 7000 K or 8000 K near the target in the detached region below the ionisation source. Once again the temperature rise is small near the chamber entrance.

Figure 8. MAST-U discharge 45244 Super-X divertor. (a) Evolution of Fulcher brightness and rotational temperature across the lower divertor ('York' system). (b) Lines of sight 1–20.
Download figure:
Standard image High-resolution image
Figure 9. MAST-U discharge 45244 Super-X divertor. (a) Evolution of Fulcher brightness and rotational temperature across the upper divertor ('DIBS' system), first array. (b) Lines of sight 1–16.
Download figure:
Standard image High-resolution image
Figure 10. MAST-U discharge 45244 Super-X divertor. (a) Evolution of Fulcher brightness and rotational temperature across the upper divertor ('DIBS' system), second array. (b) Lines of sight 17–26.
Download figure:
Standard image High-resolution imageFor the elongated divertor (shot 45068—see figures 11–14) a similar result is observed in the lower divertor. The rotational temperature rise at the centre of the divertor chamber elevates from around 4000 K to around 6000 K for a change in Greenwald fraction from 0.13 to 0.18.
For additional context, we note here that the divertor electron densities in MAST-U (based on divertor Thomson scattering and Stark broadening measurements of similar discharges [12]) are a roughly constant  –
– across the divertor, rising to
  –
– near the divertor entrance; the implications of which are discussed later in section 4.

Figure 11. Discharge 45068 (elongated). Lower divertor Fulcher band emission evolution with Greenwald fraction, obtained from inverting data from the MWI diagnostic [27].
Download figure:
Standard image High-resolution image
Figure 12. MAST-U discharge 45068 elongated divertor. (a) Evolution of Fulcher brightness and rotational temperature across the lower divertor ('York' system). (b) Lines of sight 1**20.
Download figure:
Standard image High-resolution image
Figure 13. MAST-U discharge 45068 elongated divertor. (a) Evolution of Fulcher brightness and rotational temperature across the upper divertor ('DIBS' system), first array. (b) Lines of sight 1–16.
Download figure:
Standard image High-resolution image
Figure 14. MAST-U discharge 45068 elongated divertor. (a) Evolution of Fulcher brightness and rotational temperature across the lower divertor ('DIBS' system), second array. (b) Lines of sight 17–26.
Download figure:
Standard image High-resolution image3.4. The vibrational distribution of in the MAST-U divertor

Although obtaining the vibrational distribution is more challenging due to considerable overlap of the various vibrational bands, an estimation of relative populations of the zeroth to third vibrational levels in the upper Fulcher state is possible using parts 1–3 of the procedure outlined in the

Figure 15. Typical composite plot showing the vibrational distribution of the upper Fulcher state for the Super-X divertor shot 45244 LOS = 12, time = 600 ms. The N values represent the rotational quantum numbers of the Q-branch lines available in both the ν = 0 band and at least one other  0 band. The median population is shown by the black diamonds with associated error bars.
Download figure:
Standard image High-resolution imageA simple Franck–Condon analysis (mapping) for inferring the vibrational distribution of the upper Fulcher state, based on the assumption of a Boltzmann distribution in the ground state, is described in the
As such a vibrational temperature cannot be simply assigned but it is worth noting here that previous studies (when able to assign a vibrational temperature) have found correlation between electron density and vibrational temperature [46, 47].
The temporal and spatial evolution of the vibrational distribution in the MAST-U Super-X divertor during a density ramp discharge is shown in figure 16. We find that, as detachment occurs and the Fulcher emission moves away from the target (figure 7), the measured vibrational distribution changes in the cold, detached, region near the target—whilst this does not occur near the divertor entrance where the plasma is hotter. As the vibrational distribution changes in the detached region, it deviates further from that expected of a Boltzmann distribution. More precisely, the  levels increase with respect to the ν = 0 level, whilst the ν = 1 relative population remains constant. This change in vibrational distribution seems to occur simultaneously with a change in rotational temperature, as indicated in figure 16. Changes to the vibrational distribution as the rotational temperature is altered are seen in literature [46, 47], where a correlation between the vibrational temperature and the rotational temperature is observed. However, higher vibrational temperatures result in a relative decrease of
  compared to ν = 0, which is in contrast to our MAST-U observations in figure 16. The correlation between the rotational temperature and the vibrational distribution is further investigated in section 4, where the implications of the vibrational distribution measured on MAST-U are discussed.

Figure 16. The vibrational distributions of the first four vibrational bands for various lines of sight in the 'DIBS' arrays at 500 ms and 800 ms. The small boxes show the ground state rotational temperatures obtained from the Q(0-0) branch for the same lines of sight (the cyan diamond showing the temperature at 500 ms and the magenta diamond at 800 ms).
Download figure:
Standard image High-resolution image4. Discussion
4.1. Correlation between rotational temperature and vibrational distribution
In section 3, we have observed that the deviation between the vibrational distribution and that expected from a Boltzmann (in the ground state) becomes larger in the detached region. At the same time, the inferred rotational temperatures are increased in the detached region (figure 16). In this section, we study the correlation between the rotational temperature, which is generally assumed to be a measure of the gas temperature, and the vibrational distribution in more detail. Figure 17 shows scatter plots of rotational temperature of the ground state Q(0-0) branch against ν = 1, ν = 2 and ν = 3 population (relative to ν = 0). This shows that (in the  Fulcher excited state) the populations of the ν = 2 and ν = 3 vibrational levels relative to the ν = 0 level are roughly proportional to the rotational temperature of the molecules, which is not the case for the ν = 1 band.

Figure 17. Scatter plots showing the correlation between the populations of the ν = 1 (left) and  (right) vibrational levels (relative to the ν = 0) with the ground state rotational temperature of the Q(0-0) branch.
Download figure:
Standard image High-resolution imageThe strong, positive correlation between  with Trot shows that, as the gas temperature is increased, there is an increase in the relative population of
  in the
  upper Fulcher state. It is also the case that the deviation between a distribution expected from a Boltzmann distribution (in the ground state, mapped to the
  Fulcher state with a Franck–Condon approach) and that observed becomes larger.
Our results (section 3) indicate that the increase in the gas temperature occurs spatially below the ionisation source. Hydrogen Balmer line analysis in similar discharges, has shown that a build-up of molecules and neutral atoms occurs below the ionisation region [12]. The increase of molecular density, results in plasma-chemistry interactions with vibrationally excited molecules, leading to molecular ions (such as  ) that react with the plasma, leading to MAR and dissociation (MAD) [12]. The appearance of MAR in the Super-X and elongated divertors occurs downstream of the ionisation region and builds up as the plasma grows more deeply detached. At the same time, we find that the rotational temperature increases as the plasma becomes more deeply detached (section 3). Therefore, the MAR/MAD strength, gas temperature and the level to which the measured vibrational distribution deviates from that expected of a Boltzmann distribution (in the ground state) all seem correlated.
4.2. Vibrational excitation mechanisms and deviations from a Boltzmann distribution
The observation that a Franck–Condon analysis suggests deviation of the vibrational distribution from that of a Boltzmann in the ground state could mean that: 1. the simplified Franck–Condon analysis used is insufficient to explain the vibrational distribution in the upper state. (The Franck–Condon approach may be invalid, for example, if there is vibration-rotation interaction [48], which is the case when inter-molecular interactions are relevant); and/or 2. that reactions occur that cause the vibrational distribution in the ground state to deviate from a Boltzmann distribution.
The correlation between the appearance of MAR and the increased deviation between the measured vibrational distribution and that expected of a Boltzmann distribution in the ground state lends weight to the 2nd point—i.e. that plasma-chemistry interactions alter the vibrational distribution beyond that expected of a Boltzmann in the ground state.
There are a variety of processes which may contribute to such deviation:
- Reactions between the plasma and the molecules can lead to the (de)population of specific vibrational states: for example, molecular charge exchange and dissociative attachment (which can generate molecular ions) is more likely for higher vibrational levels and can thus depopulate the high-vibrational distributions [4, 12, 39, 49].
- Conversely, repeated excitation and de-excitation of one of the singlet electronic states, incurring a shift in vibrational quantum number, can pump the higher vibrational levels in the ground state [40, 41].
- Vibrationally excited molecules have sufficiently large mean free paths below the ionisation region in detached divertors for transport effects to be important [41]. Molecules may have an initial vibrational distribution when being released from the wall [35, 38], which—combined with transport—means the distribution would possess a wall material dependency. Transport of rotationally and vibrationally excited molecules may cause a deviation of the rotational distribution from a Boltzmann distribution. However, in areas of large mean free paths and thus strong molecular transport, there is little Fulcher emission, limiting diagnosing molecular transport through monitoring the rotational distribution.
- Under certain conditions of high molecular density, vibrationally excited molecules can interact with each other leading to vibrational-vibrational energy exchange [11]. In this interaction, one molecule loses a quantum of vibrational energy and another gains a quantum of vibrational energy. The molecular anharmonicity of the vibrational potentials can mean that the kinetic temperature can drive the vibrational distribution into the so-called Treanor distribution which overpopulates higher vibrational states. See the
appendix for further details. - Analogously to the case for a rotational distribution (see
appendix ), a multi-temperature component of the vibrational distribution may exist. This could be because different interactions can drive different vibrational temperatures; as well as due to the spectroscopic line-of-sight integrating through parts of the plasma where Fulcher emission at a different vibrational temperature occurs.
Figure 18 shows the mapping of three different ground state distributions (dotted lines) to the upper Fulcher state (solid lines) using a Franck–Condon approach (as described in the

Figure 18. Various ground state vibrational distributions mapped onto the upper Fulcher state using a Franck–Condon approach. The blue lines represents a Boltzmann distribution at a vibrational temperature of 9500 K; the orange lines represents a distribution that is Boltzmann (again at 9500 K) for the first four bands and is then flat; the red lines shows a Treanor distribution with a vibrational temperature of 9500 K and a gas temperature of 2500 K. The black and grey diamonds show actual data for the first four vibrational bands at the start and end of the Super-X in shot 45244.
Download figure:
Standard image High-resolution imageIt is noted that the Treanor distribution (see figure 18), which arises from vibrational–vibrational energy exchange, bears some resemblance to the actual vibrational distributions observed in the MAST-U divertor in the sense that the higher vibrational levels can have an elevated population. Vibrational–vibrational exchange occurs at higher molecular density, which is significantly increased in the cold, detached, region where the elevation of the higher vibrational levels (in the Fulcher state) is enhanced. Additionally, the tightly baffled nature of the MAST-U divertor chamber significantly elevates the molecular density. However, once mapped to the upper Fulcher state, it shows significant deviation to the measured distribution.
At this stage, it is unclear what mechanisms are driving the vibrational distribution on MAST-U. This requires further studies where the vibrational distribution is modelled and compared against experimental measurements.
4.3. Relevance and implications of our results
Our results are the first measurements of the rotational and vibrational distribution of D2 for an alternative divertor configuration with tight divertor baffling. In the MAST-U Super-X divertor, deeper levels of detachment were obtained [12], in which plasma-molecular chemistry involving MAR and MAD had a stronger impact than on other devices. These results show a correlation between detachment, the increase of the rotational temperature of the molecules and a deviation between the measured vibrational distribution and that expected from a Boltzmann distribution of the ground state, with elevated levels of  in the
  Fulcher state. In this section we discuss the relevance and implications of these results, as well as how it compares against results from other devices and the relevance for reactors.
Analysis of the  Fulcher band emisson to infer rotational and vibrational distributions has been performed on a range of different devices in the past, including tokamaks (JET [52], DIII-D [30], ASDEX-Upgrade [53] and JT60-U [54]), as well as other devices such as LHD [47] and Magnum-PSI [55]. Generally, a Boltzmann distribution is found for the rotational distribution across the various devices. A large range of different rotational temperatures are quoted in literature, ranging from less than 1000 K (mainly linear devices) to 10 000 K and higher [30]. In multiple devices an increase of the rotational temperature with the electron density is observed, noteably JET [52], DIII-D [30] and LHD [47]. Hollmann et al [30] shows similar rotational temperatures, at the same electron density, for DIII-D, TEXTOR (limiter, no divertor) as well as for a linear device, PISCES [30]. The spread in the various reported rotational temperatures may depend on whether the molecular density arises predominantly from recycling or from fuelling.
Our MAST-U results—in the novel, tightly baffled, Super-X divertor chamber, are consistent with these historic results, in the sense that 1) a clear Boltzmann trend of the rotational distribution is shown; and 2) the magnitude of the rotational temperatures obtained are consistent with previous findings.
The MAST-U observations, however, suggest that rotational temperature is not necessarily only correlated with divertor electron densities. Additionally, higher rotational temperatures are observed in MAST-U than would be expected based on DIII-D, PISCES and TEXTOR [30] results, given the modest electron densities in MAST-U (1000–2000 K). As mentioned previously, a roughly constant  –
– is measured throughout the MAST-U divertor, rising to
  –
– near the divertor entrance. Although the fairly flat electron density profile across the divertor generally correlates with the flat rotational temperature profile seen in our analysis (figures 8–10), the rotational temperature increases as the divertor becomes more deeply detached and the electron density is kept roughly the same. Additionally, the rotational temperature is lower near the divertor entrance than in the middle of the divertor—anti-correlated with the electron density trend. This observation suggests that an increase in rotational temperature is associated with the degree of detachment (in diverted tokamaks with divertor baffling), which may be explained by the longer lifetime of the molecules in the divertor chamber before they get dissociated or ionised—meaning that they can undergo more collisions with electrons and obtain higher rotational temperatures. At the divertor entrance, the higher temperatures likely lead to shorter molecular mean free paths, potentially explaining the reduction in rotational temperature. The detached conditions on MAST-U in combination with strong baffling can ensure that the molecules remain 1) longer in the divertor region; 2) are confined in the divertor region—both of which may explain the higher rotational temperatures observed on MAST-U as compared to previous observations [30]. Potentially, the high rotational temperatures on MAST-U may suggest that not all the emission from the upper Fulcher state arises from electron-impact excitation (e.g. other processes, such as recombination, could result in electronic excited molecules), which requires further research.
In most divertors it was possible to infer a vibrational temperature from the vibrational distribution. However, JET-ILW results have reported an overpopulation in  [52], when compared to expectations based on previous, carbon wall, measurements. An overpopulation in ν = 3 was also found on TEXTOR [46]. Although the vibrational distribution measurements on MAST-U are roughly in line with measurements on other devices, in terms of the observed relative populations of
  , the increase of the relative distribution of
  with increasing Trot has not been previously observed.
The observed differences in the MAST-U Super-X divertor may be caused by certain processes that are predominantly relevant in the Super-X divertor. The large distance of the ionisation source from the target results in a large volume with relatively long molecular mean free paths, meaning that molecular transport could play a significant role. The high molecular densities may imply that molecule-neutral collisions, such as vibrational-vibrational exchange along with other processes, could be significant—which would be less likely on other devices. This has implications for both ADCs as well as tightly baffled divertors. This means that specific research for ADCs as well as strongly baffled divertors is required, in addition to that on more 'conventional' divertors, to validate the models used for the vibrational distribution in plasma-edge physics. As an initial step, 0D collisional-radiative models can be used to see if they can match the observed vibrational distribution and which processes play a role in this. This information can then be included in plasma-edge simulations, both in a resolved and unresolved setup to test whether transport of vibrationally excited molecules and plasma-wall interactions can have a significant impact.
The plasma conditions will be significantly different in ADC reactor designs than on MAST-U, operating at higher power, higher densities and with a metallic wall. This will change the plasma-wall interactions and result in smaller mean free paths. However, if such a design is deeply detached, there can still be a significant region below the ionisation front in which the divertor is detached, in which the various described processes could be relevant. Plasma-edge modelling, using the outcomes of the above validation steps in a transport-unresolved study, could be used to probe the sensitivity of ADC reactor designs to such interactions.
5. Conclusion
Our work provides the first analysis of the rotational and vibrational distribution of D2 molecules in the tightly baffled, deeply detached MAST-U Super-X divertor using  Fulcher band emission spectroscopy during a density ramp discharge where the level of detachment is scanned. The rotational distribution follows a clear Boltzmann distribution for the first two vibrational bands; and, with greater uncertainty, for the 3rd and 4th bands (not shown). In contrast, the vibrational distribution of the upper Fulcher band (measured from ν = 0 to ν = 3) deviates from that expected if an assumed Boltzmann distribution in the ground state is projected into the
  upper Fulcher state using a Franck–Condon analysis. The
  populations, relative to ν = 0, in the
  Fulcher state show a significant overpopulation compared to that expected from a ground state Boltzmann distribution.
At detachment onset, the ground state rotational temperature, which is often assumed to be an indicator of the kinetic energy of the molecules, is observed to increase from below 6000 K to 9000 K near the target. As the core density is scanned and detachment proceeds, the region of elevated rotational temperatures expands upstream, following the ionisation front. In this region, strong signatures of plasma-chemistry interactions leading to MAR/dissociation are observed based on hydrogen Balmer line emission spectroscopy. At the same time, the measured vibrational distribution changes significantly in the cold, detached, region: both the ν = 2 and ν = 3 vibrational bands (in the  upper Fulcher state) receive a population boost relative to the ν = 0 band. The change of the vibrational distribution during detachment is larger than that expected of a (ground state) Boltzmann distribution. The relative population of the
  levels is strongly correlated with the rotational temperature of the ground state Q(0-0) branch; whereas the relative population of the ν = 1 level appears to be independent of the detachment state or rotational temperature.
Both of these observations suggest a kinetic link between the plasma and the D2 molecules; which changes across the entire detached region with larger changes occurring in deeper detached conditions. This work provides the tools and measurements required to provide a deeper understanding of this kinetic link and its relation to detachment; which will be used to compare against models in the future.
Acknowledgments
This work has received support from EPSRC Grants EP/T012250/1, EP/W006839/1, EP/N023846/1 and EP/S022430/1. This work has been carried out within the framework of the EUROfusion Consortium, partially funded by the European Union via the Euratom Research and Training Programme (Grant Agreement No. 101052200—EUROfusion). Views and opinions expressed are however those of the author(s) only and do not necessarily reflect those of the European Union or the European Commission. Neither the European Union nor the European Commission can be held responsible for them. This work was performed under the auspices of the U.S. Department of Energy by Lawrence Livermore National Laboratory under Contract DE-AC52-07NA27344.
Data availability statement
The data that support the findings of this study are openly available at the following URL/DOI: https://doi.org/10.14468/1hgs-ys59 [56].
Appendix:
A.1. The Fulcher band of

The molecular hydrogen Fulcher band is a band of visible lines between 600 nm and 650 nm generated by de-excitations of the hydrogen molecule from  and can be prominent in divertor plasmas. These excited states are ro-vibronic and transitions of the form
  must be considered where
  are the electronic, vibrational and rotational quantum numbers of the upper state; and
  are the corresponding quantum numbers of the lower state.
The so-called 'Q-branch' transitions are relatively bright transitions in which both the vibrational and rotational quantum numbers are preserved. By observing the molecular Fulcher band spectra with a high resolution spectrometer, it is then possible to utilise the intensities of such transitions to determine information about the rotational distribution in a particular vibrational band of the upper electronic state; and the vibrational distribution of bands within the upper electronic state. Information can then potentially be inferred about the rotational and vibrational distributions in the ground state. If such a distribution follows a Boltzmann function, it can be characterised with a certain temperature.
Figure 19 shows the  Q-branch transitions which were accessible from high resolution MAST-U divertor spectroscopy in the first experimental campaign, using the documentation provided by Lavrov and Umrikhin [43]. In this paper a Q-branch transition is described in the usual way using the terminology
  where
where  .
.

Figure 19. Table showing the  Q-branch transitions accessible through the MAST-U high resolution divertor spectroscopy.
  and
and  represent the upper and lower vibrational states, and Nʹ and Nʹʹ the upper and lower rotational states. Data obtained from Lavrov and Umrikhin [43].
Download figure:
Standard image High-resolution imageA.2. The rotational distribution of

If the diatomic molecule D2 is considered as a rigid rotator, solutions of the appropriate Schrödinger equation are possible only for specific energy values:

where N is the rotational quantum number which has integer values  and I is the moment of inertia of the molecule.
The wave number associated with an energy gap between two rotational energy states Eʹ and Eʹʹ is given by:

and it is convenient to define the so-called 'rotational term':

If B is defined 'rotational constant' which is unique for any particular rotator:

then the rotational term becomes:

We can now consider a thermal distribution of such rotational states within a vibrational band according to the Boltzmann factor:

where Trot is a 'rotational temperature' defining the distribution.
Quantum theory tells us that for each rotational state of quantum number N, there is a  degeneracy due to the nuclear motion. There is also a three-fold degeneracy due to the relative direction of the electron spin and nuclear motion, and a degeneracy denoted as
  originating form the relative orientation of the nuclear spin. We can, therefore, write that the molecular density nN
in a particular rotational level N is such that:
originating form the relative orientation of the nuclear spin. We can, therefore, write that the molecular density nN
in a particular rotational level N is such that:

In order to relate the specific spectral lines to this distribution, it is necessary to consider the intensities of the lines. The emissivity for a given transition ( in
in  ) will be proportional to the density of molecules in the upper state, nN
, and to the Einstein coefficient of the transition
) will be proportional to the density of molecules in the upper state, nN
, and to the Einstein coefficient of the transition  . However, a spectrometer measures a line intensity, which is integrated along the line of sight:
  . Assuming that the emissivity is constant along the line of sight, for a path length
  , this would imply that:
  . In this case, we can write:

where  is a factor incorporated to account for nuclear statistics. Nuclear spin permutations introduce the following weightings:


The deuterium molecule has nuclei with  and therefore the ratio is
  . This ratio determines the factor
  where
where  and
and  represent the weightings for odd and even values of N respectively. In the case of D2, therefore
  and
and  .
.
A.2.1. Rotational temperature.
By taking the natural log of equation (9), it can be tested whether a measured rotational distribution follows a Boltzmann distribution as a linear relationship is expected (equation (12)). Using the slope of such a linear relationship, the rotational temperature can be inferred [57–60]:

If a rotational temperature is obtained in this way, i.e. from the distribution of the upper state, then it is clear that it pertains to the distribution in the excited state. The assumption that is usually made in the case of a low density plasma is that this excited distribution of rotational states is a mapping of the distribution in the ground state. As is discussed in [61] this assumption that the excited distribution maps a ground state distribution is based on the following:
- that the lifetime of the ground-state is long enough for thermalization to occur through collisions;
- that the lifetime of the excited state is short in comparison with the rotational relaxation time through collisions; and
- that during excitation there is very little change in rotational quantum number.
If this assumption is valid, as may be expected in a low density plasma, then it can be said that:

and we can simply use the rotational constant for the ground state B0 in a plot of equation (12) and extract the ground state rotational temperature directly.
For the states under consideration for D2,  cm−1 and
  cm−1.
cm−1.
Importantly, we can also take the first bullet-point in the above list to imply that (in a low density plasma) the rotational temperature of the ground state ought to represent the kinetic gas temperature.
Finally we note, as also detailed in [61], that it is possible for a plasma to exhibit non-Boltzmann rotational distributions when a reaction mechanism leads to molecules that are excited to a specific rotational state in the ground state, combined with the lifetime of the excited state not being long enough for thermalization by collisions. A common example of a non-Boltzmann distribution is the so-called 'two-temperature' Boltzmann distribution which is often reported in laboratory plasma experiments [61–64]. In these cases, higher rotational quantum numbers are overpopulated with respect to a Boltzmann distribution. Meanwhile, thermalization via rotational relaxation is inefficient for higher rotational quantum number (this is expected since the cross-sections for rotational energy transfer diminish rapidly with increasing N). In such cases, it is typically assumed that the temperature of the lower N Boltzmann fit is the best estimate of the gas temperature (once corrected via equation (13)). Multiple-temperature Boltzmann distributions may also be caused by chordal integration effects, for example if  Fulcher emission occurs at two different locations along the line of sight with two different rotational temperatures.
A.3. The vibrational distribution of

By definition, Q-branch diagonal transitions preserve rotational and vibrational quantum numbers. In general, however, both numbers are likely to change during electronic excitation or radiative de-excitation and the excited vibrational distribution cannot, therefore, be expected to map directly to the ground state vibrational distribution. Instead, for vibrational transitions, the excitation from the electronic ground state  to the excited state
  must be considered in a vibrationally resolved manner using Franck–Condon factors, as must the Fulcher band transitions from
  . A simplified approach to infer the ground state vibrational temperature can be used which assumes a Bolzmann distribution in the ground state and then maps this to the upper Fulcher state using Franck–Condon factors [26, 62]. In its simplest form, this approximation assumes instantaneous decay from the upper state and a constant electron dipole transition moment and proceeds as follows:
- 1.Select Q-branch lines which are available (with little interference) in all vibrational bands and use their summed intensities as a proxy for the intensity of the entire vibrational band. (Note that the line intensities must be adjusted so as to account for the difference in the rotational temperatures of different bands—i.e. to cancel the re-distributive effect on different temperatures on the distribution).
- 2.Normalise these intensities to the ν = 0 band intensity.
- 3.Divide by the appropriate branching ratios of the Q(ν-ν) transitions to determine the relative populations of vibrational levels in the upper Fulcher state.
- 4.Assume a Boltzmann distribution of vibrational states in the ground state and normalise to the ν = 0 state.
- 5.Use Franck–Condon factors to determine the distribution in the excited state that would be theoretically produced via electron impact excitation of the ground state distribution.
- 6.Vary the vibrational temperature in 4 and repeat 5 to fit to the measured distribution in 3.


The Franck–Condon factors between the first 20 vibrational states for transitions  are available [65]. The branching ratios are shown in table 2.
Table 2. The branching ratios for transitions from  which preserve vibrational quantum number. Reproduced from [26]. © IOP Publishing Ltd. All rights reserved.
D2 transition 
| Branching ratio |
|---|---|

| 0.871 |

| 0.695 |

| 0.543 |

| 0.412 |
An example of application of the parts 1–5 of this process to generate theoretical vibrational distributions of the upper state, assuming the vibrational distribution in the ground state is distributed according to a Boltzmann at a certain temperature, are shown in figure 20.

Figure 20. Theoretical vibrational distributions of the upper Fulcher state for various vibrational temperatures are shown by the dotted lines.
Download figure:
Standard image High-resolution imageA.4. The Treanor distribution
When diatomic molecules are considered as perfect harmonic oscillators, their distribution will be Boltzmann:

However, if the anharmonicity of diatomic molecules such as D2 is taken into account the distribution can be shown to contain an additional term. This is the so-called Treanor distribution characterised by a vibrational temperature Tν , and a gas temperature T0 [66]:

where χ is the anharmonicity parameter. (For D2,  .)
.)
The Treanor distribution is favoured in conditions of high collionality where vibrational-vibrational energy exchange can become significant and is compared to the Boltzmann distribution in figure 21. As can be seen from equation (15), at high gas temperature (assumed to be the same as the ground state rotational temperature of the ν = 0 band) the Treanor distribution approximates a normal Boltzmann distribution. For more details on the Treanor distribution including its derivation we direct the reader to [66, 67].

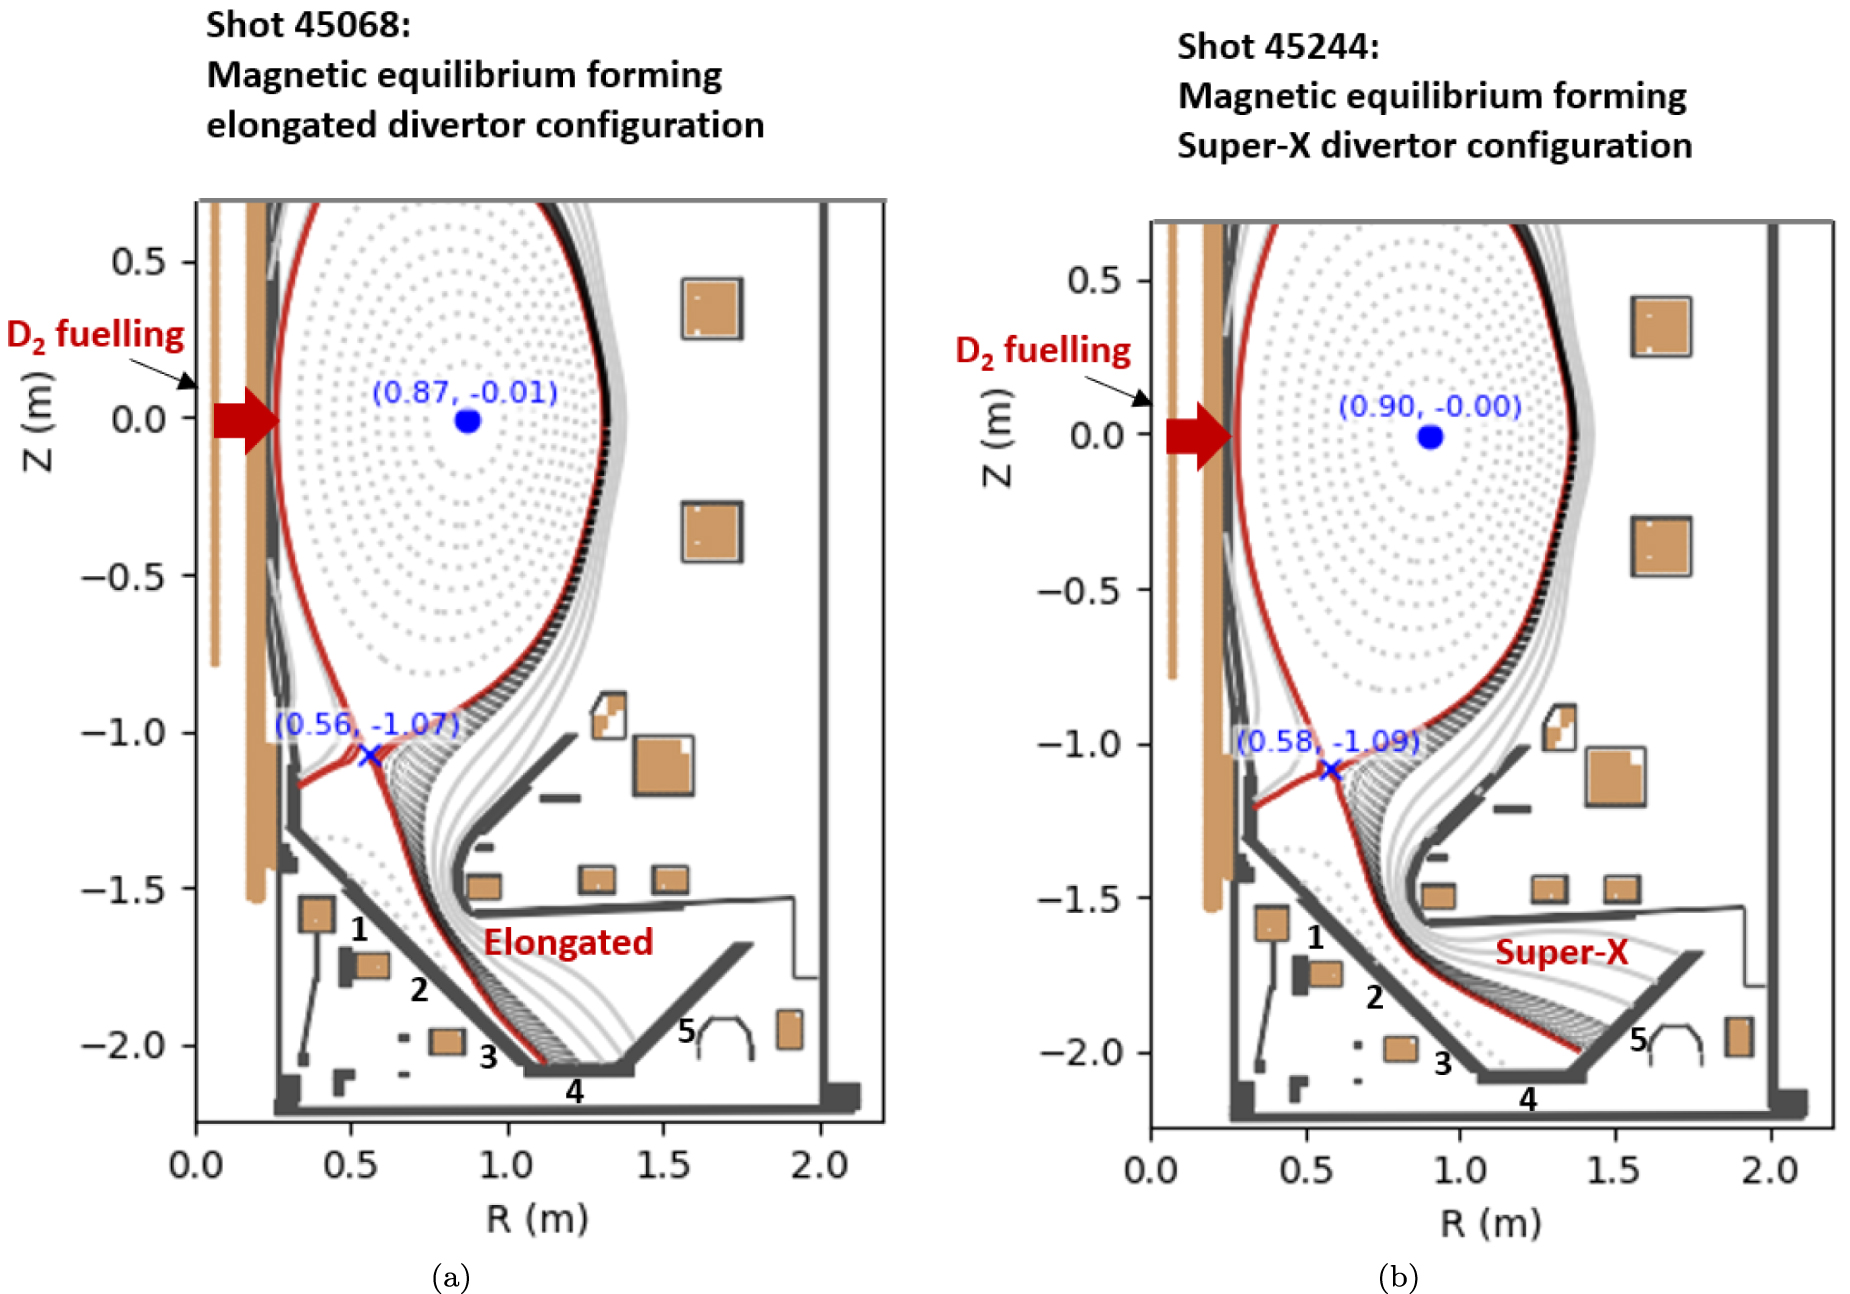
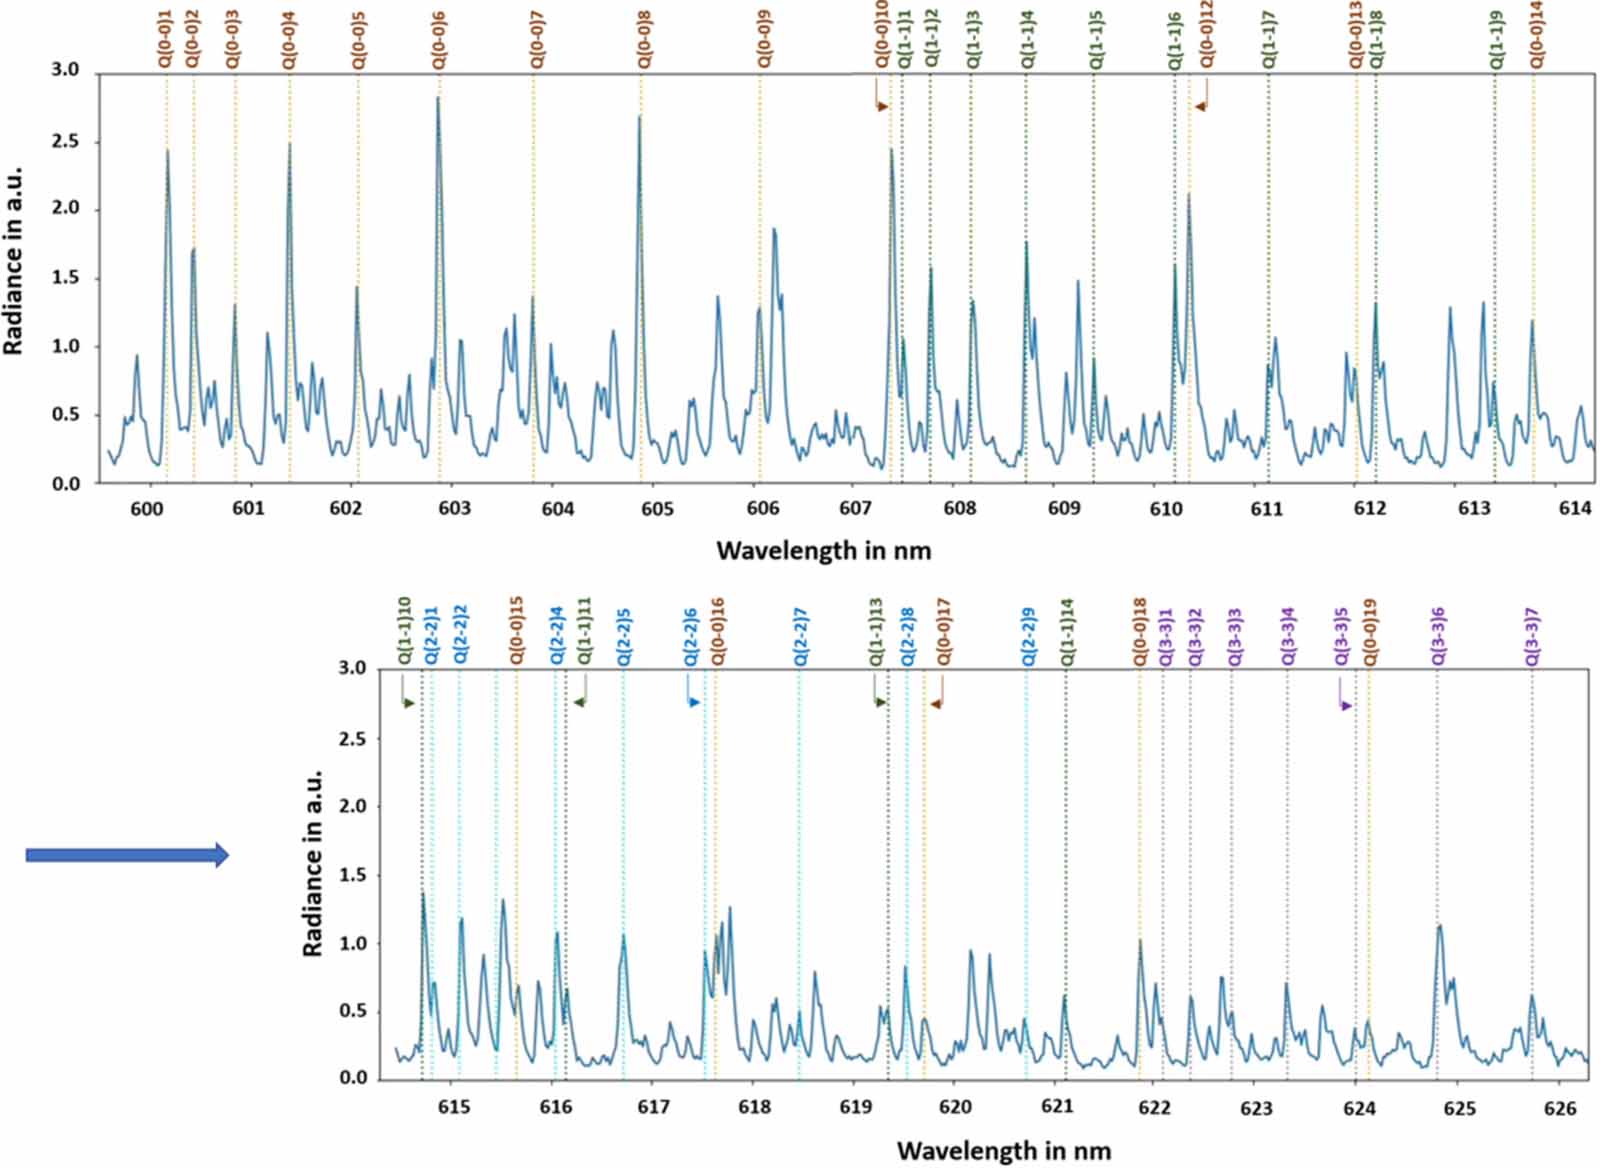
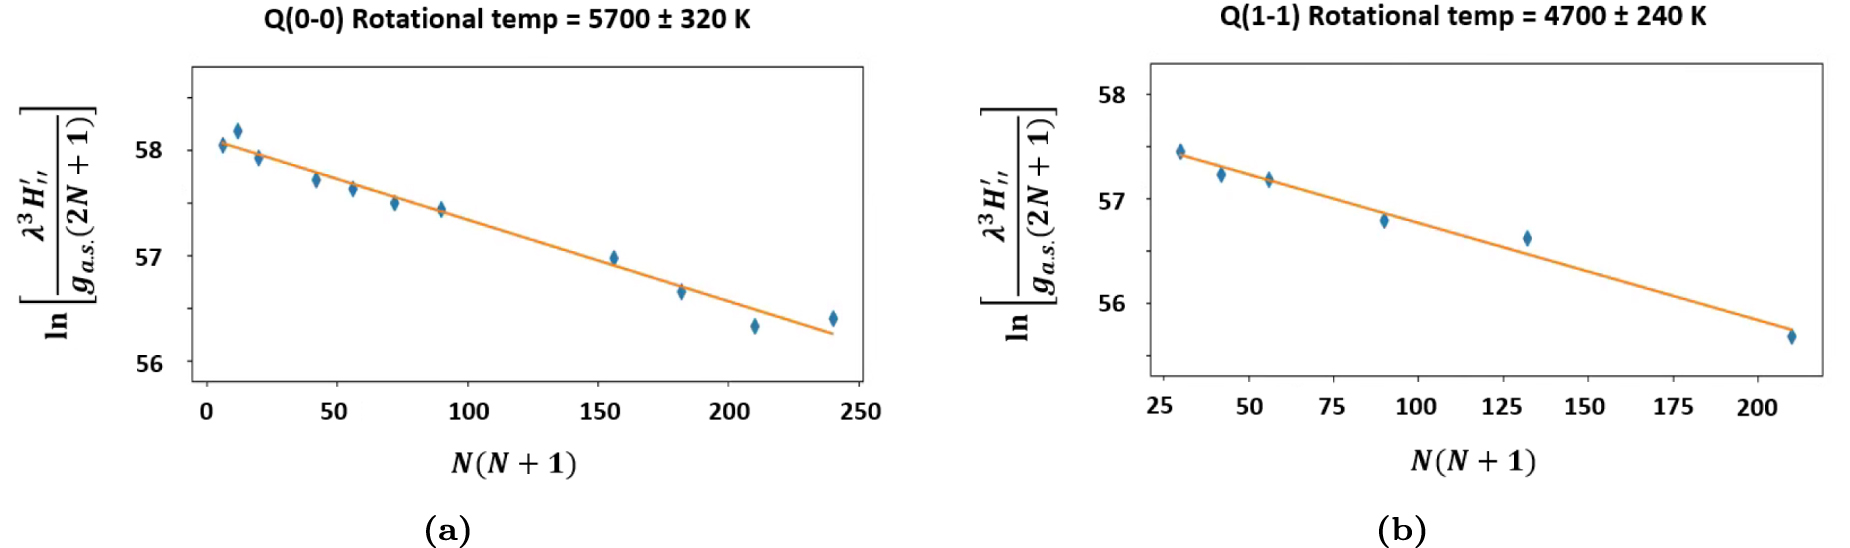
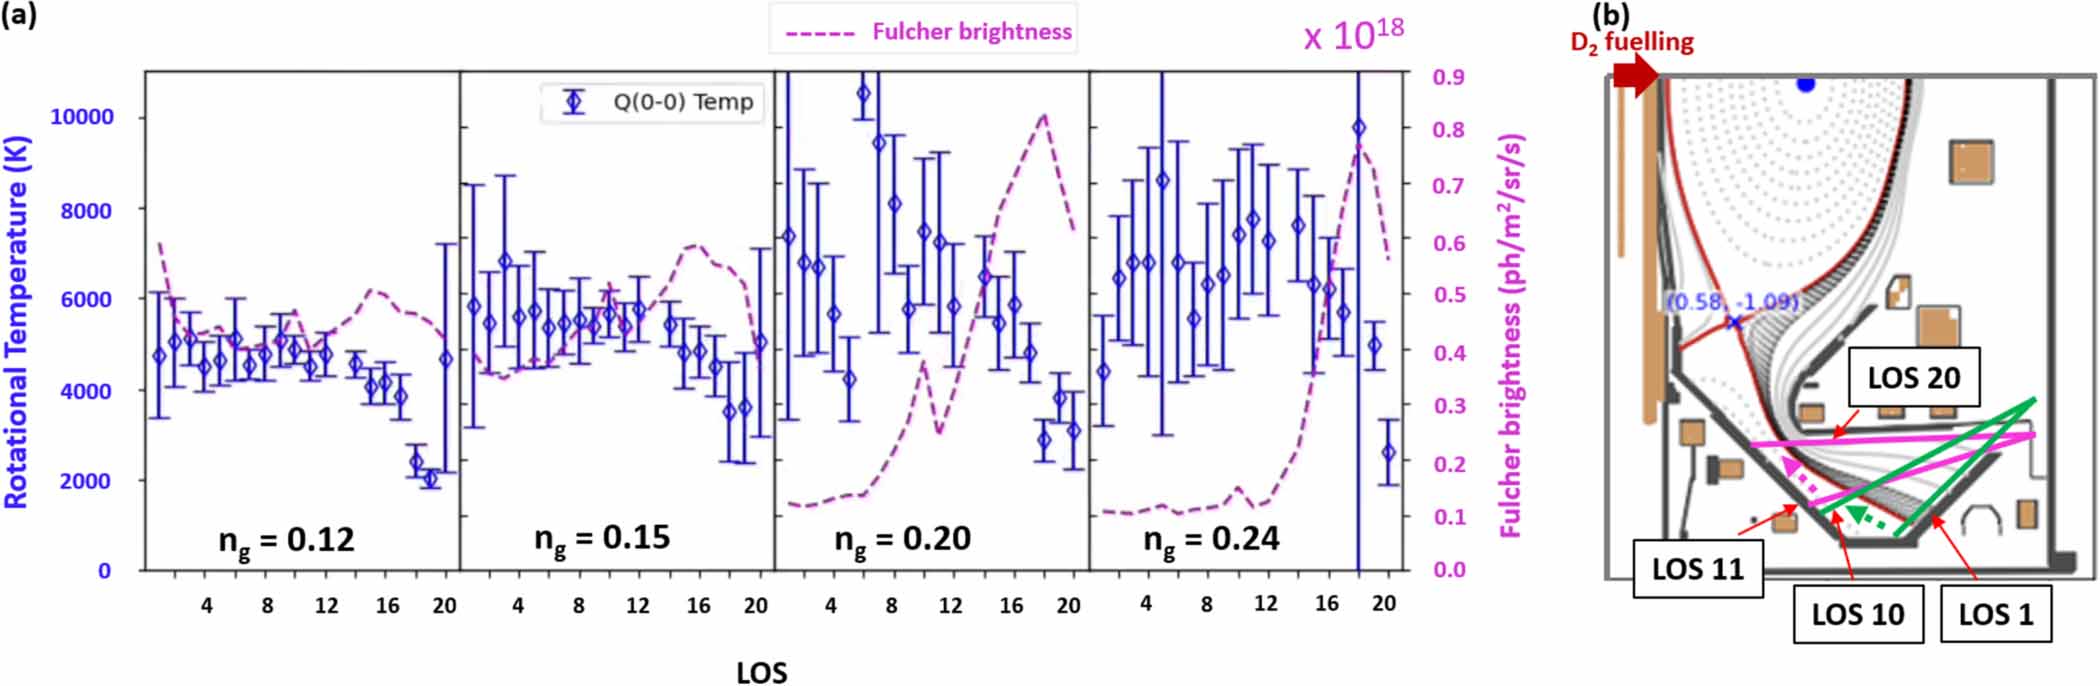
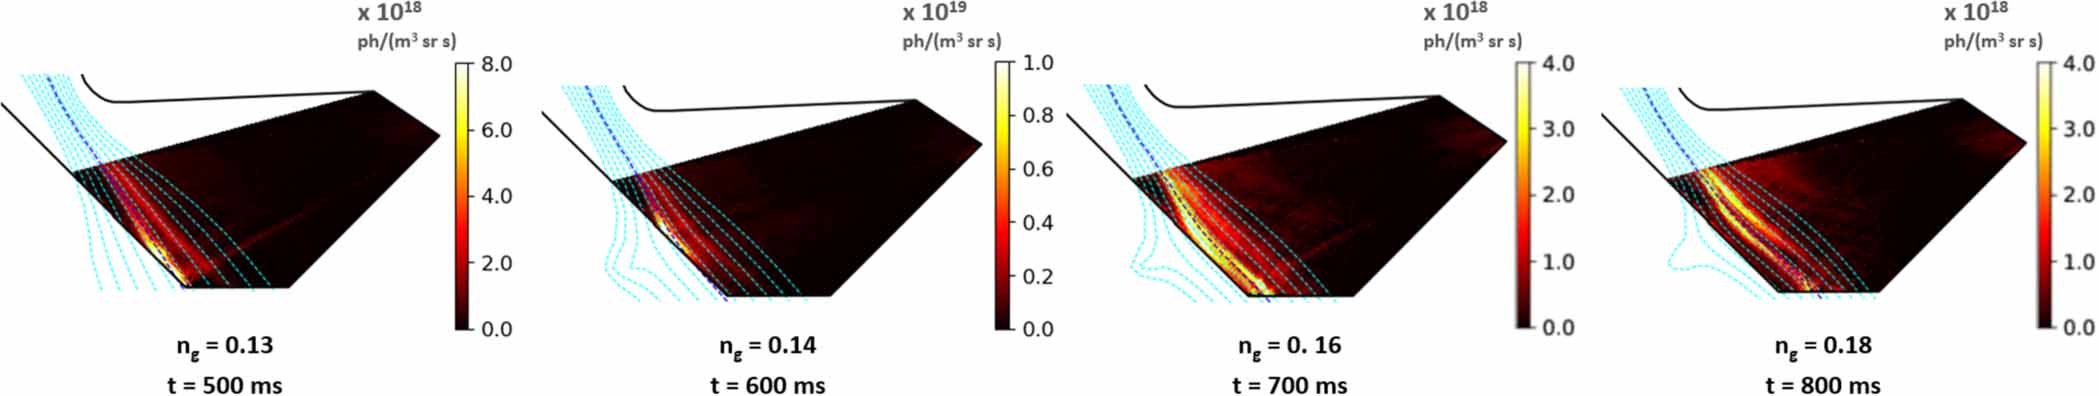
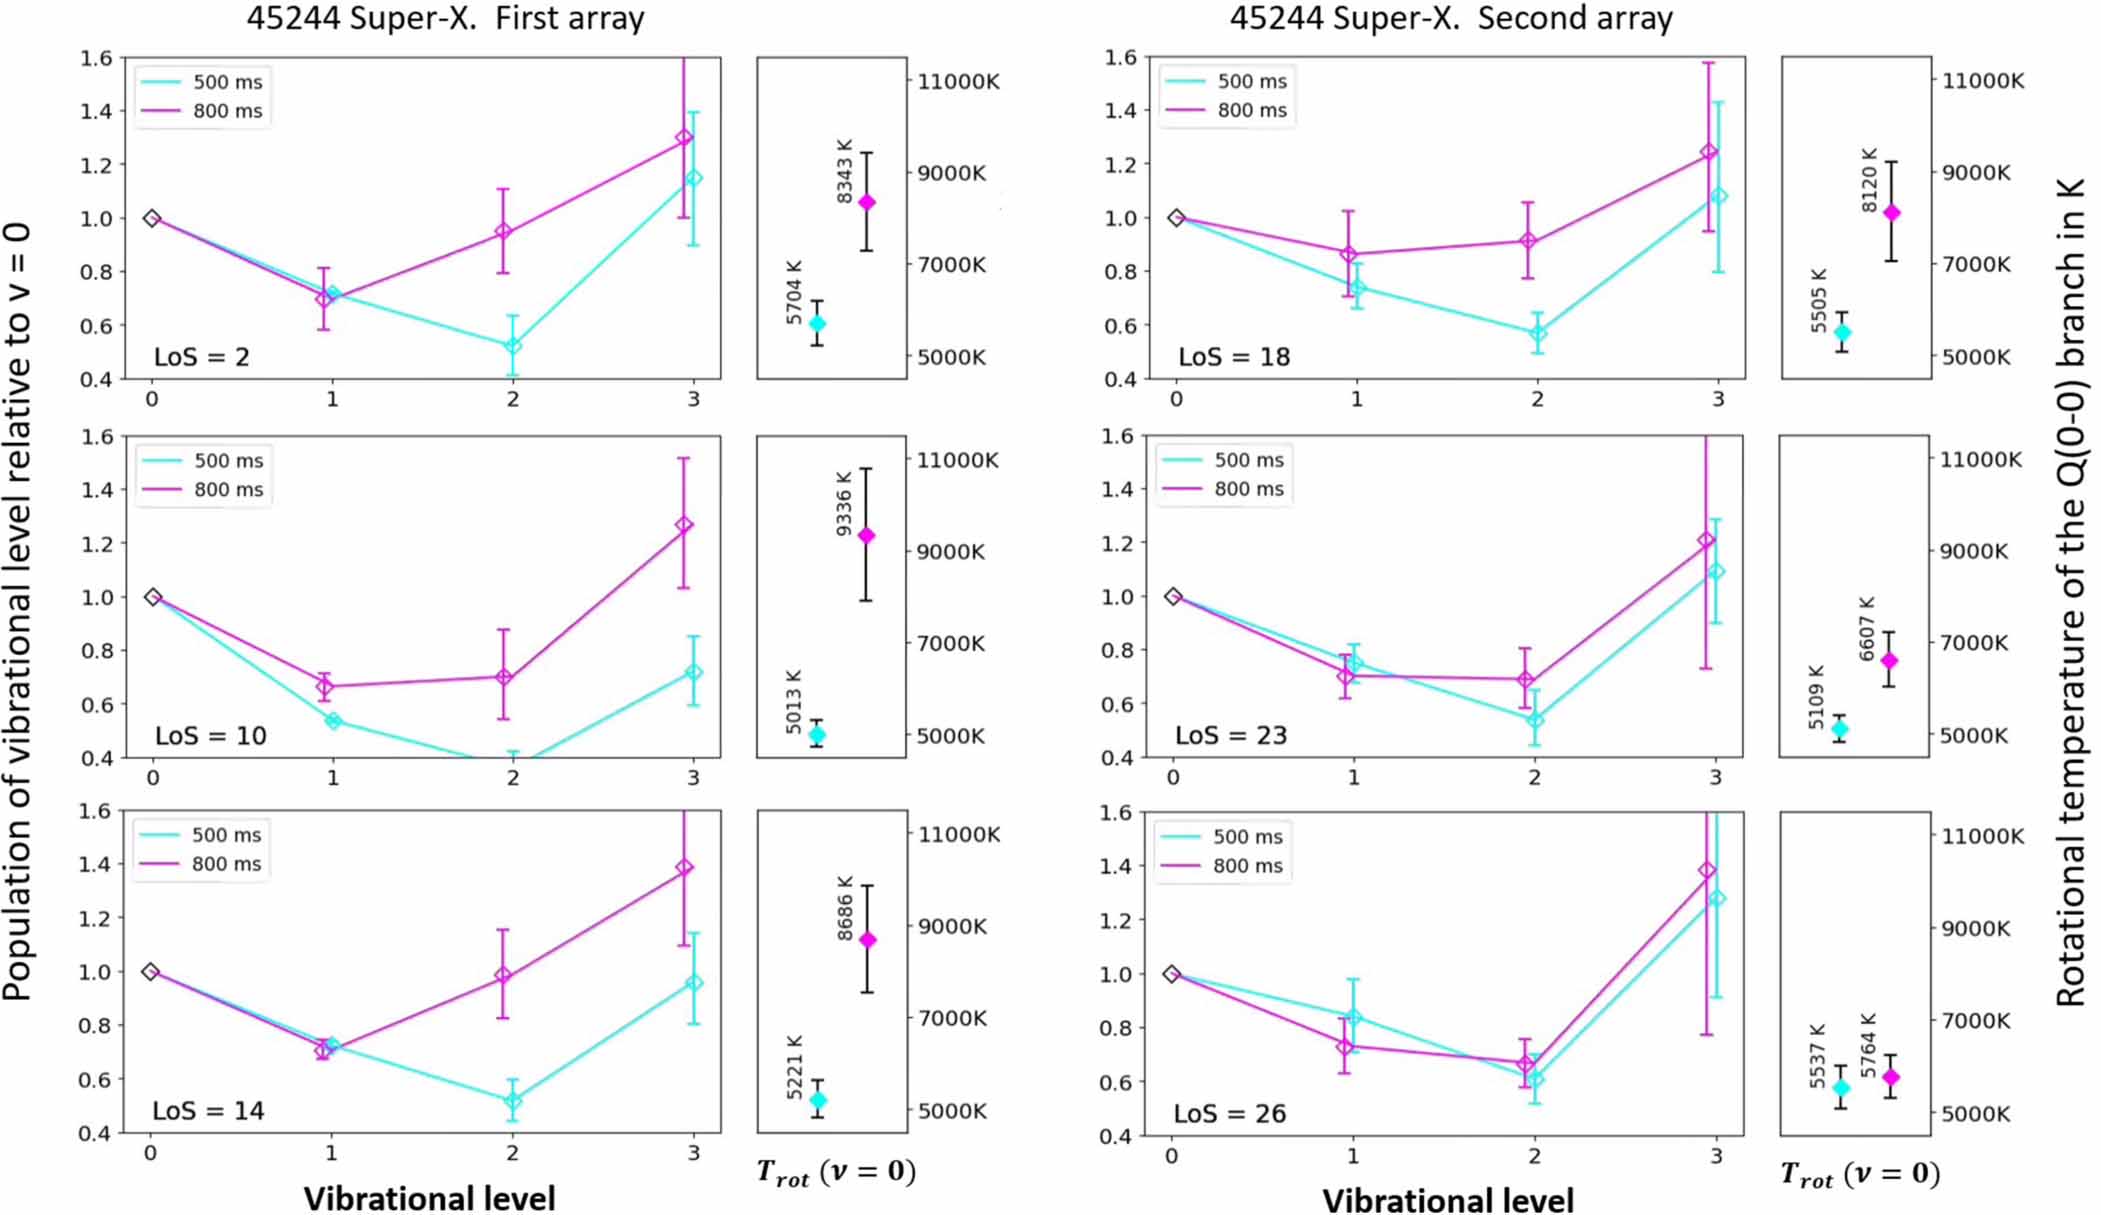
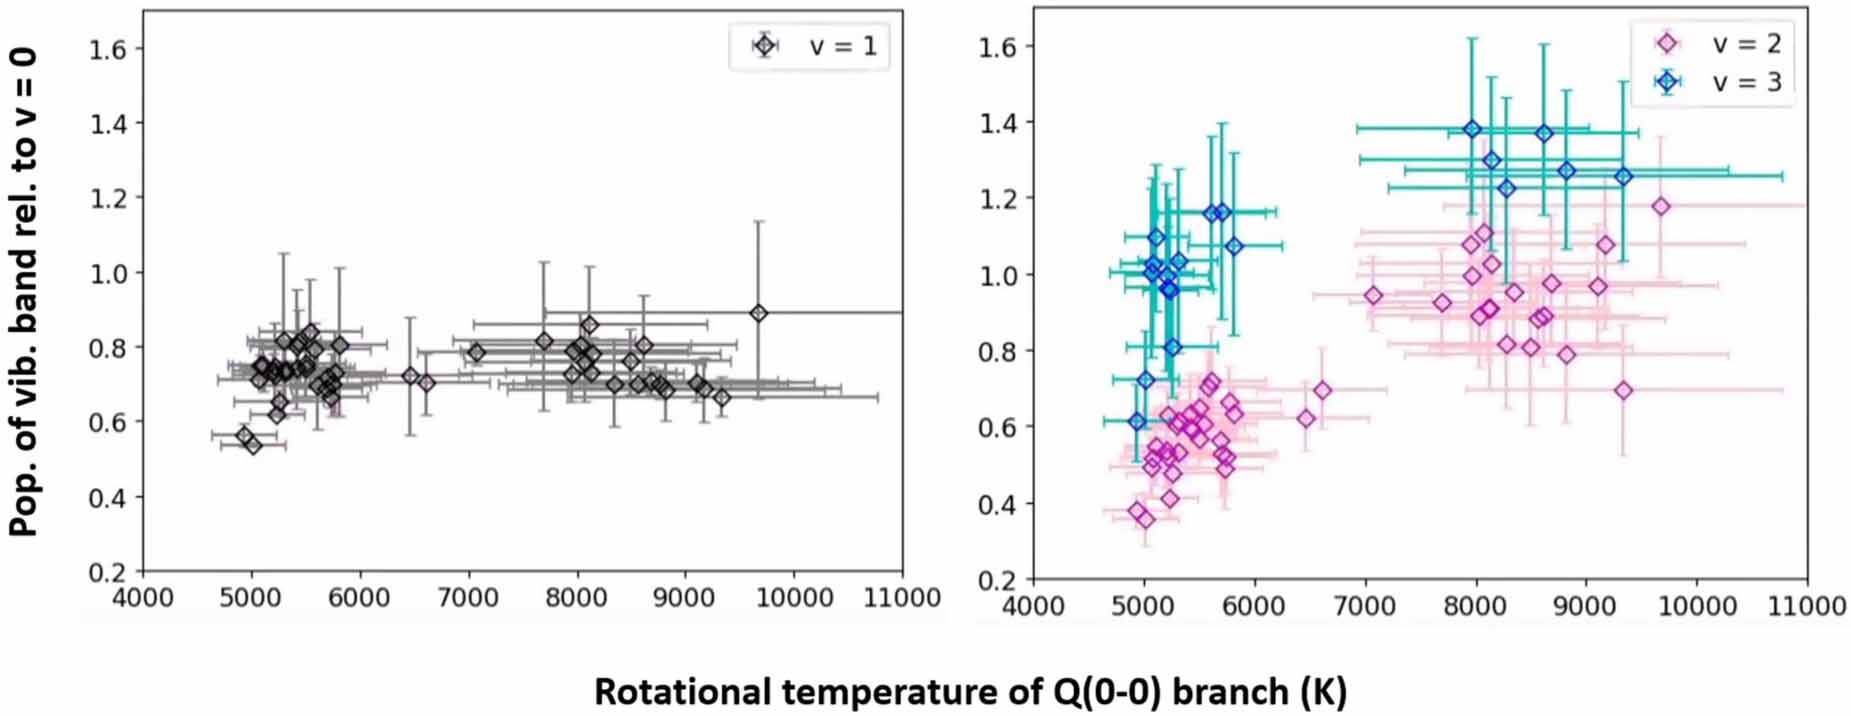
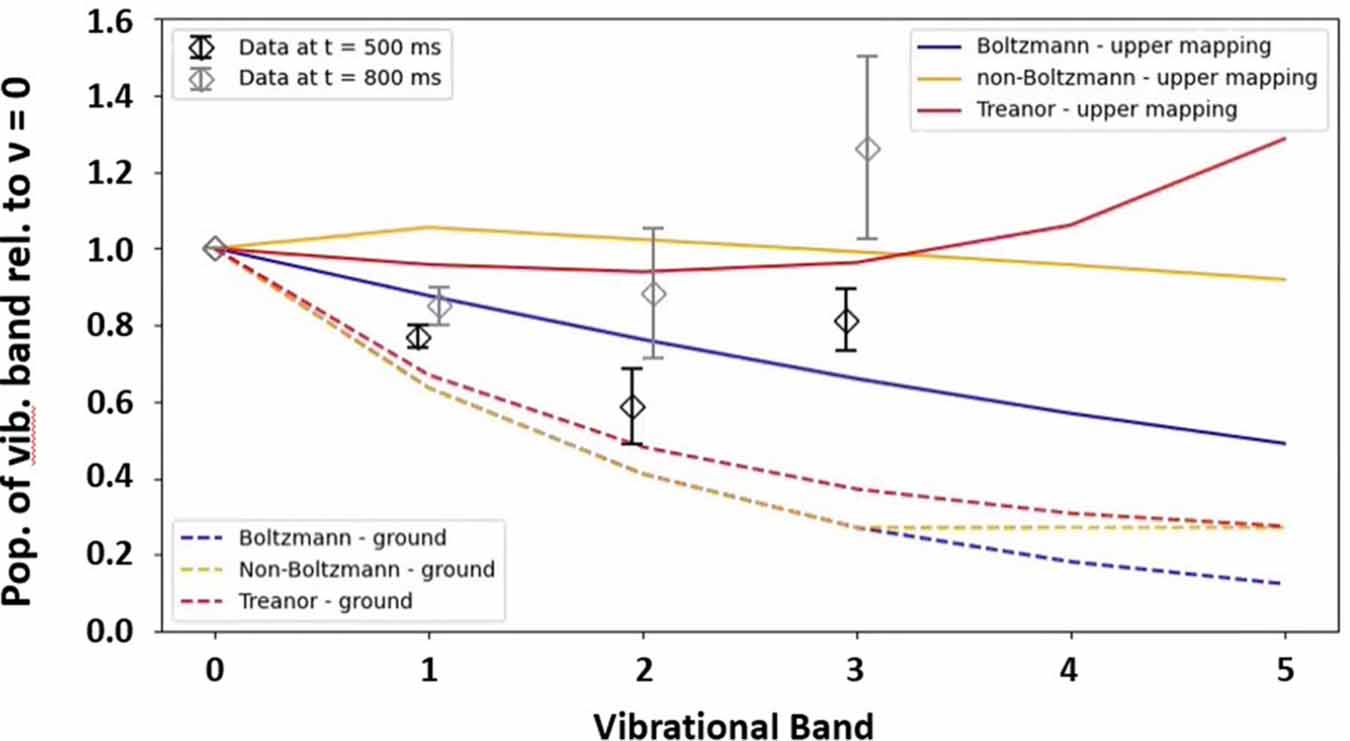
Figure 21. A Treanor distribution differs from a Boltzmann distribution in that the higher vibrational states are overpopulated.
Download figure:
Standard image High-resolution image
Footnotes
- 7
Note the rotational temperature has already been mapped to the ground state rotational temperature (see equation (13)).