
Abstract
This study explores important parameters for achieving a high-level positional control of DNA-nanoparticle hybrid structures by drop-casting onto a pre-structured silicon surface, in which the active adsorption sites were defined using electron beam lithography. By confining the adsorption sites to the scale of the DNA origami, we create multi-dimensional patterns and study the effect of diffusion and hybrid nanostructure concentration in the liquid on site occupation. We also propose a physical diffusion model that highlights the importance of surface diffusion in facilitating the adsorption of hybrid nanostructure onto active sites, particularly for two and one-dimensional adsorption sites. Our study shows prominent results of the hybrid nanostructure's selective adsorption, indicating high adsorption efficiency and precise control over the position, as well as the spatial orientation. We anticipate similar results in related systems, both in terms of different surfaces and similar DNA structures. Overall, our findings offer promising prospects for the development of large-scale nanoarrays on micrometer-scale surfaces with nanometer precision and orientation control.
Export citation and abstract BibTeX RIS

Original content from this work may be used under the terms of the Creative Commons Attribution 4.0 licence. Any further distribution of this work must maintain attribution to the author(s) and the title of the work, journal citation and DOI.
1. Introduction
The unique optical properties of metallic nanoparticles have made them increasingly popular for several applications, such as biosensing [1], molecular imaging [2], and photovoltaics [3]. In particular, plasmonic nanostructures have gained significant attention due to their remarkable ability to manipulate light at the nanoscale [4]. Through the utilization of short and long-range interactions, metal particles that are organized into ordered arrays with specific spacings in the range of the light wavelength can be used to control the surface near light field, generate significant electromagnetic field enhancements, and function as high-quality resonators [5, 6]. Such ordered arrays of metallic nanoparticles exhibit tremendous potential in various applications, including nanolaser [7], electronics [8, 9], surface-enhanced Raman spectroscopy [10], and bio-molecular sensing [11]. However, the preparation of plasmonic nanoarrays, particularly for three-dimensional (3D) nanoarrays or in the sub-100 nm range, remains challenging.
Recent studies have demonstrated the potential of combining top–down lithographic techniques with bottom–up (bio)chemical approaches to precisely control and position metallic nanoparticles and other biomaterials on macroscopic surfaces [12–17]. Of the various bottom-up methods, DNA origami nanotechnology has emerged as a promising approach for arranging nanoscale objects with a precision of 1–2 nm [13, 18–21]. This technology has facilitated the assembly of complex, hierarchical, and hybrid structures [22–24]. It has been utilized as a binding template to organize biotechnological molecules [25–27], nanodiamonds [28], quantum dots [29, 30], plasmonic nanostructures [31–36], and nanophotonic devices [37, 38]. The combination of bottom-up DNA self-assembly with high-resolution lithography techniques has great synergy, merging the advantages of both approaches.
In this study, we report on self-assembled gold dimer on functionalized DNA origami, producing a hybrid nanostructure. This approach allowed us to achieve high selectivity in positioning the structures onto a lithographically patterned Si substrate. We utilized the affinity of silanol groups on the surface of the substrate for binding DNA origami over unoxidized substrates, which aided in achieving this selectivity. The deposition was achieved by simple drop-casting of a colloidal solution on the pre-structured surface. To ensure the highest quality of the created pattern of the hybrid nanostructures, we implemented a post-deposition cleaning process that effectively eliminates unwanted hybrid nanostructures from the passive layer while retaining large amounts of hybrid nanostructures in the active layer. By confining the lateral extent of the active sites to the size of the origami as a reduction of the dimension of the active site's pattern, we examined the positional control of the hybrid nanostructures in two, one, and zero-dimensional patterns. We analyzed the influence of diffusion of the hybrid nanostructures on the surface and within the liquid, as well as the influence of the origami concentration in the solution on the positional control for different levels of confinement. We also suggest a physical diffusion model that provides insights into the role of surface diffusion in the adsorption of hybrid nanostructures. Our experimental results with zero-dimensional patterns demonstrate a high binding efficiency of hybrid nanostructures with precise position and orientation control. In conclusion, this study showcases the potential of combining top-down lithography and bottom-up self-assembly to achieve high binding rates, as well as the positional and orientation control of hybrid nanostructure adsorptions.
2. Experimental section
2.1. Preparation of hybrid nanostructures
In this study, we utilized rectangular DNA origami with dimensions of 100 nm × 70 nm as a platform for binding two gold particles (15 nm in diameter), as shown in figure 1(a). Specifically, we designed two axially symmetric sites along the long axis of the origami for the precise placement of the gold particles, with an average center-to-center distance of approximately 44 nm. The modification of the AuNPs was adapted from Gür et al [39]. Specifically, 20 mL of citrate-capped AuNPs with 15 nm diameter from BBI Solutions were mixed with 100 mM Bis(p-sulfonatophenyl)phenylphosphine (BSPP 150 mL) and shaken overnight. A small quantity of 5 M NaCl was added until the solution turned blue, followed by centrifugation at 8000 rcf for 20 min The supernatant was discarded and the pellet was re-suspended in 2.5 mM BSPP. This process was repeated while the concentration of the remaining AuNPs was determined using UV/vis spectrometry by evaluating the extinction coefficient of the nanoparticles suspension at 450 nm [40]. The AuNPs were then modified with thiolated thymine polymer (T12, single-stranded DNA with 12 thymine bases and a thiol group at the 5' end). T12 was added to the AuNPs at a molar ratio of 600:1 in 0.5× TAE buffer. Additionally, 5 M NaCl was added in four rounds to reach a final concentration of 500 mM, the solution was sonicated for 10 s and shaken for 10 min after each round. Finally, the mixture was left to shake overnight and the DNA-functionalized nanoparticle was collected by centrifugation, using the Amicon Ultra-0.5 mL Centrifugal Filters for 150 s at 10 000 rcf.

Figure 1. (a) Schematics of DNA origami template with two 15 nm AuNPs attached. (b) SEM image of the hybrid nanostructures randomly distributed on a Si substrate, the darker rectangular structures correspond to the DNA origami, and the bright dots are the AuNPs.
Download figure:
Standard image High-resolution imageThe DNA origami was designed using caDNAno software in the square lattice mode. A rectangular structure was formed by 24 double-stranded DNA helices with M13mp18 as a scaffold interconnected with 188 staples. Six staples were extended with twelve adenine bases (A12), which enable the linkage to two AuNPs with T12 modification. To produce the DNA origami, a solution containing 1 pM scaffold and staples in a 1:20 molar ratio was heated to 90 °C in a thermocycler (Bio-Rad) and then cooled down to room temperature over a duration of 70 min The folded structure was collected by centrifugation using Amicon Ultra-0.5 mL centrifugal filters at 10 000 rcf to remove the excess staples. The concentration of the residual DNA origami was determined using UV/vis spectroscopy.
The DNA origami was mixed with T12-modified AuNPs at a 1:50 molar ratio and incubated for 90 min. The resulting hybrid nanostructure was purified using gel electrophoresis and then extracted for future research. The DNA origami prepared this way can either have zero, one, or two AuNPs attached. Based on scanning electron microscopy (SEM) image analysis, approximately 60% of the DNA origami bind two AuNPs.
2.2. Preparation of the substrate
In this manuscript, we discuss the possibilities and important parameters to precisely control the position and orientation of the hybrid structures by pre-structuring the surface. It is known that the presence of silanol groups on a surface creates a hydrophilic environment that facilitates the attraction and stabilization of the negatively charged hydrophilic DNA origami structure. Magnesium ions act as charge neutralizers for the negatively charged phosphate groups of DNA, thus reducing electrostatic repulsion between the DNA and the negatively charged silanol groups on the surface. This enhances the electrostatic interactions between the DNA and the surface, leading to stronger binding. In contrast, for a passive layer, the hydrophobic nature of the Hexamethyldisilazane (HMDS) coating results in weak binding of DNA origami structures. By applying an appropriate cleaning method, it is possible to remove the DNA origami structures from the passivated surface [41].
The silicon substrate was prepared for patterning by first activating it with O2 plasma etching for 20 s. After plasma etching, the substrate was coated with HMDS in a vapor chamber at 125 °C for 100 s. A layer of poly(methyl methacrylate) (ALLRESIST 672.02, 950k PMMA) with a thickness of 120 nm was then spin-coated onto the substrate at 1000 rpm for 60 s and baked at 150 °C for 3 min, electron beam lithography was performed using a focus ion beam scanning-electron microscope (FIB-SEM, Thermo Fisher Scientific, Helios 5 UX dual beam) operating at 30 kV with electron beam current ranging from 1.6 pA to 0.4 nA. The electron dose varied between approximately 120–480 μC cm−2, depending on the pattern. Development was conducted with a 1:3 solution of methyl isobutyl ketone (MIBK) with isopropyl alcohol (IPA) for 30 s, followed by cleaning with IPA. Finally, the substrate was again activated with O2 plasma for 20 s to remove the HMDS layer and create silanol groups on the exposed areas. The resist was stripped by ultrasonication in n-methyl pyrrolidone (NMP) at 55 °C for 25 min, then rinsed in isopropanol followed by nitrogen stream drying.
A 1 μl droplet of the sample was placed on a silicon substrate containing the desired patterned adsorption sites. The substrate was then placed in a humid, hermetically sealed petri dish to prevent evaporation and incubated for typically 60 min using a buffer containing 0.5 TAE and 11 mM Mg2+. The substrate was subsequently washed three times for 5 min each, while being agitated on an automatic shaker. The washing process involved the use of a buffer containing 40 mM Mg2+, 40 mM Tris (pH 8.3), followed by a Tween 20 buffer consisting of 0.08% Tween 20, 40 mM Mg2+, and 40 mM Tris (pH 8.3), to remove weakly bound origami. A higher pH buffer containing 35 mM Mg2+ and 10 mM Tris (pH 8.9), was then employed to remove the Tween 20. Finally, a solution consisting of a mixture of ethanol and water was used to clean the substrate. It was immersed in a 50% (v/v) mixture of ethanol and water for 10 s, then transferred to a 75% (v/v) ethanol mixture for 20 s, followed by immersion in an 85% (v/v) ethanol mixture for 2 min Sequentially it was dried under ambient conditions for SEM imaging.
2.3. Imaging
The dried samples were investigated using a secondary electron detector equipped in the same FIB-SEM at 2 kV. To minimize charging effect and ensure clear visualization of both the AuNPs and the 2 nm thick DNA origami, we fixed the sample onto a stub holder using silver paste. We use low beam current (13–50 pA) to minimize surface contamination and charging effects. Figure 1(b) shows an SEM image of the hybrid nanostructures with the gold dimer on the DNA origami. The hybrid nanostructures in this image were drop-casted on an unstructured Si-substrate uniformly coated with silanol groups. We identified binding events of the adsorbed origami by manually annotation of the images and performed orientation measurements by hand using Image J.
Due to the overlapping of origami frames, precise measurement of the adsorbed density was challenging. However, a statistical analysis of 400 origami frames revealed an average of 1.35 nanoparticles per origami. Since the individual gold particles can be easily identified, counting the number of AuNPs is more precise. We can then estimate the number of hybrid DNA structures taking the average occupation into account. This information can be utilized to estimate the number of hybrid nanostructure units occupied at the adsorption site.
3. Results and discussion
3.1. 2D adsorption patterns
According to previous studies [41], the surface diffusion of bare DNA origami can significantly speed up the rate of adsorption at specific binding sites, as the dimensionally restricted motion helps with guiding the structures toward their desired surface positions. We started with a 2D case, in which the dimension of the adsorption site on the film surface is much larger than the size of the origami in both horizontal and vertical directions. Here, we prepared a circular adsorption site with a diameter of 150 μm (figure 2(a)). If the adsorption is dominated by 3D diffusion of the DNA in a liquid, we expect to see a homogeneous distribution of the bound origami across the active surface. In the case of mainly 2D diffusion over the non-activated surface regions, we expect to see an increased DNA origami density near the edges of the active area. We examined this by measuring the particle density along the diameter of the circular adsorption site after 30 min and 1 h of incubation in SEM. We observed significantly more DNA origami and nanoparticles adsorbed at the edge compared to the interior of the circular adsorption site. Figure 2(c) shows an exponential decline in particle density when moving from the edge of the active site towards the interior, while a constant, lower density is observed in the central region. Our data indicates that the particle density is proportional to the incubation time for both the edge and central regions. Based on these findings, we conclude that the system has not yet reached a saturation level of the number of particles adsorbed on the active site. Therefore, we can attribute the higher density at the edge to 2D diffusion of the hybrid nanostructures on the surface, which induces a flow across the site's interface. This flow is driven by the energetically favorable binding of the hybrid nanostructures, drawing the hybrid nanostructure from the passive layer to bind onto the silanol layer of the active sites. The resulting density gradients then cause diffusion on both the passive as well as the active sites. The particle concentration in the central region remains constant for a given incubation time, as the 2D diffusion length on the active sites is not sufficient to transport a significant number of hybrid nanostructures from the edge to the central region, as evidenced by the decay length of the exponential decline in density. This, in combination with the linear increase of particle density with incubation time, clearly indicates a direct adsorption from the liquid. This is found to be independent of position within the active site and thus must be a consequence of 3D diffusion within the liquid. The clear sign of 2D diffusion also is a strong indication that the adsorption contrast is not primarily caused by wetting of hydrophobic and hydrophilic surfaces as it requires adsorption of the hybrid nanostructures at the passive areas followed by diffusion to the active sites.
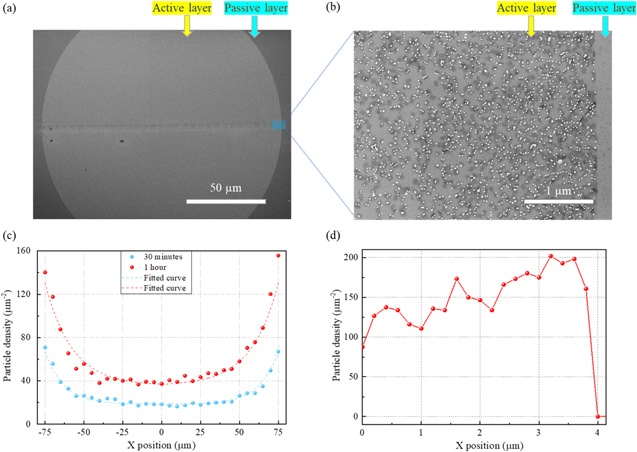
Figure 2. (a) SEM image of a circular adsorption site with a diameter of 150 μm. (b) SEM image shows the edge region of the circular site. (c) The scatter plots show the experimentally observed particle density measured along the x-axis through the circle's center after incubation for 30 min and 1 h, respectively; the dashed curves show fitting results (see text for details). (d) The red dots show the particle density integrated over the y-axis of (b). It illustrates the increased density close to the edge as well as the abrupt transition in the passive layer without any particles, this image was recorded in a sample with an incubation time of 60 min.
Download figure:
Standard image High-resolution imageHowever, the increase of particles observed near the interface to the passive layer, is a result of the 2D diffusion from the passive layer. Figure 2(b) shows the active layer in direct vicinity to the circle's edge. The small section on the very right of the image belongs to the passive layer. We observed a sharp decline in particle density when leaving the active layer. This image also demonstrates that the cleaning procedure is effective in removing the hybrid nanostructure from the passive layer, while the particle density in the active layer remains largely unaffected. This will be further discussed in the sections associated with lower dimensional binding sites. Furthermore, figure 2(b) provides additional evidence of the high efficiency of the cleaning procedure in eliminating any residual traces of the buffer solution. We observed a high particle density close to the edge on the active layer, leading to potentially high filling levels in this region. As a result, the collection of particles via 2D diffusion can be hindered during incubation, as the transition to the active layer is sterically hindered by previously bound particles. We expect this effect to be more pronounced in the 1D pattern. However, this high particle density also implies that 2D diffusion on the passive layer can potentially bring more particles to the interface, which can be channeled towards the center of the active layer. As the cleaning process after incubation eliminates almost all particles in the passive layer, we also conducted experiments that employed a filter paper instead of using the cleaning process. This approach enabled us to retain the majority of the particles in the passive layer.
Figure 3(b) displays the particle density measured on the passive layer for a sample after one hour of incubation using the modified procedure. The density of particles near the interface is lower than in the regions farther away from the interface. Together with all results summarized in figure 2, this illustrates that there is a significant surface diffusion towards the active layer, and the equilibrium density is not reached after 1 h incubation time.

Figure 3. The weakly absorbed hybrid nanostructures remain on the passive layer when the liquid is removed using filter paper after incubation, instead of following the normal cleaning procedure described in section 2.2. (a) SEM image of the interface between the passive and the active layer. Only a small number of particles are visible in the passive layer, compared to the active layer's abundance of particles. In addition, there is a significant amount of salts and other debris of the liquid which normally would be removed during the cleaning. (b) The particle density in the passive layer is shown in gray dots and the fitted curve is in red (fitted by equation (1), Deff2 = 0.256 ± 0.097 μm2 s−1).
Download figure:
Standard image High-resolution imageBecause the binding energies at the passive and active layers are different, the diffusion coefficient should differ at each layer. At the active layer, the stronger binding causes the hybrid nanostructure to diffuse more slowly. This explains why the particle density is high inside the circle and especially high near the interface. To obtain a deeper understanding of 2D diffusion quantitatively, we use the following one-dimensional model [42, 43] to fit the density profile:

In which the erfc is the complementary error function, C is the particle density, x is the distance from the interface and t is the incubation time. To consider the 3D diffusion, we added a spatially constant offset to the concentration that is proportional to the incubation time. We determined Deff1 to be 0.037 ± 0.005 μm2 s−1 (see supplementary information, S1) in figure 2(a) (fit shown as lines) for the active layer. The fitting analysis for the passive layer resulted in an estimated value of Deff2 at approximately 0.256 ± 0.097 μm2 s−1 (see supplementary information, S2). Notably, this value is consistent with reports of previous research on lipid membranes [44, 45]. As expected from the enhanced density in the active layer near the interface, we observe a diffusion coefficient in the passive layer that is almost an order of magnitude higher than in the active layer.
3.2. 1D adsorption patterns
Furthermore, we investigated the binding of hybrid nanostructures to the active sites within one-dimensional pattern consisting of thin lines with a period ranging from 500 nm to 10 μm. Moreover, we investigated two special cases: one consists of a single line patterned in a 100 μm square area as an approximation of an 'infinite' spacing. The other has a sizable square patch patterned to create a '0 nm' spacing. Figure 4 displays the resulting adsorbed particle density for different line periods and a given hybrid nanostructure density in solution.
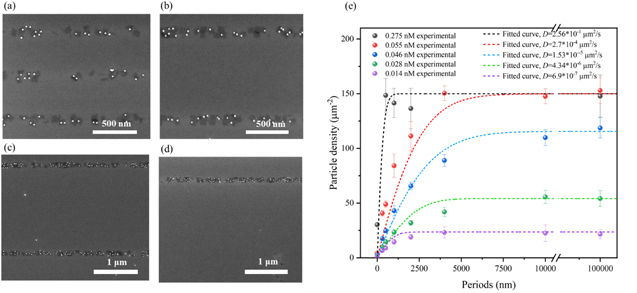
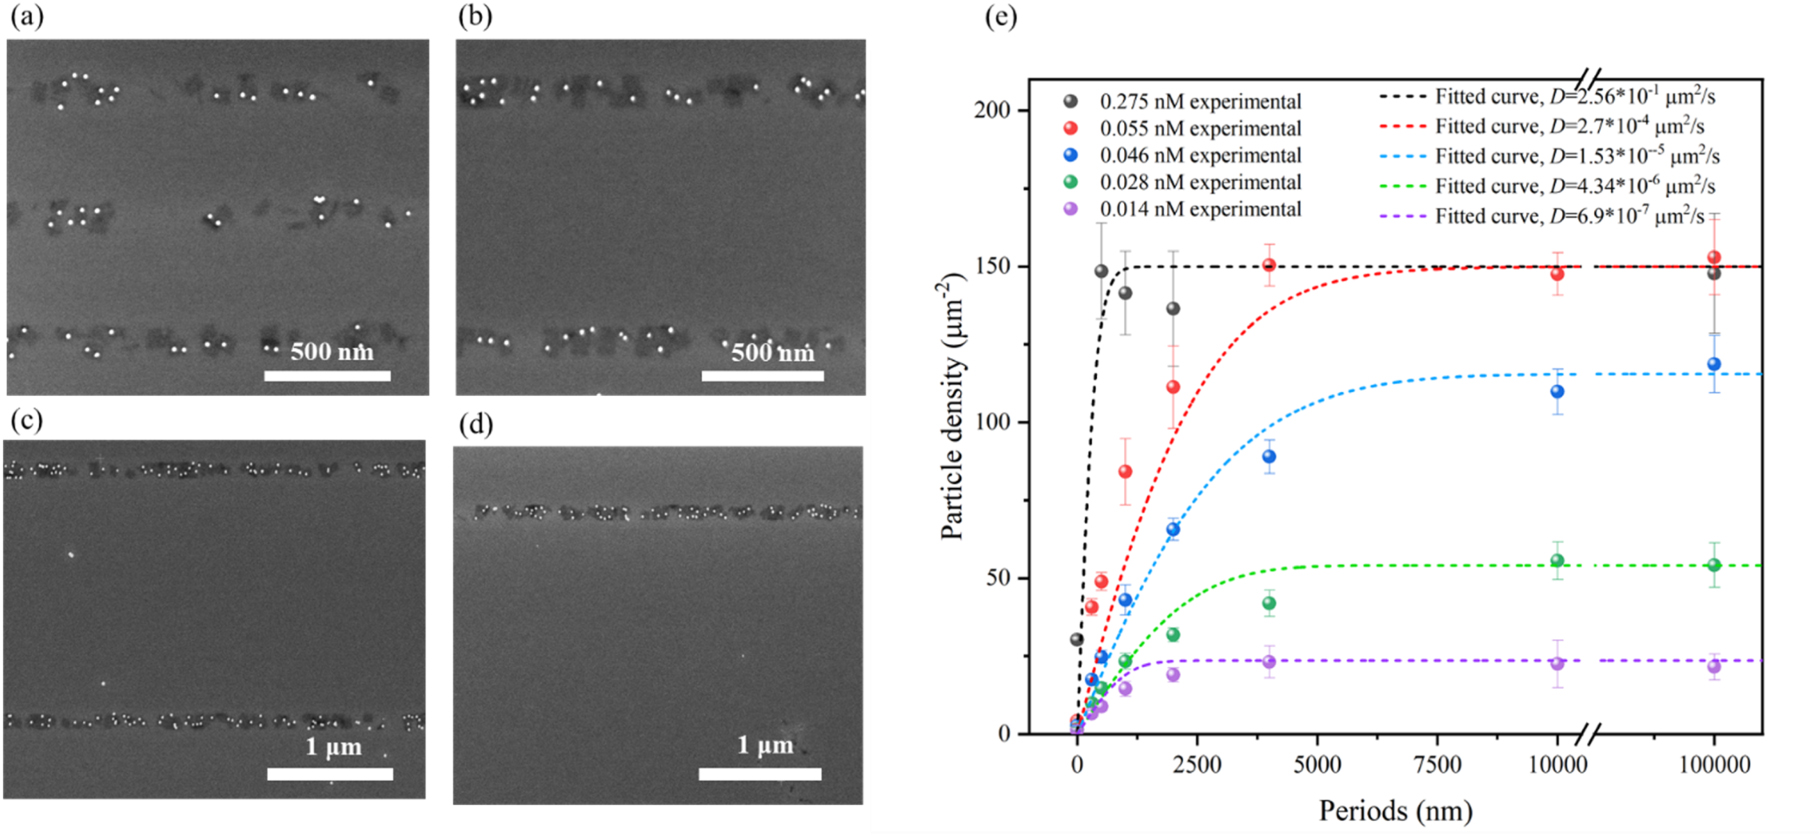
Figure 4. SEM images of the hybrid nanostructures adsorbed in line patterns with a width of 100 nm for different periodic spacings of (a) 500 nm, (b) 1 μm, (c) 2 μm, and (d) 4 μm between the lines, in the case of a particle concentration of 0.055 nM. (e) Shows the particle density on the 100 nm line patterns with different periods and the corresponding fitting curves obtained using a surface diffusion model that accounts for filling of the active area. The dots illustrate the experimental data, the dashed lines are fits with the model described in equation (3).
Download figure:
Standard image High-resolution imageWe first concentrate on the particle density determined for 0.275 and 0.055 nm (black and red dots in figure 4(e)). As expected for small concentrations of hybrid nanostructure in the solution and an important surface diffusion, we observed an increase in particle density per line, as the spacing between lines increases. This is a consequence of the increasing number of particles that originally adsorbed on the increasing passive surface areas between the lines and then diffused to the latter. Figure 4(c) also shows that the particle density at the active sites approach saturation as a result of steric hindrances. We calculated this density to be approximately 80% of the density expected from a perfectly ordered non-overlapping DNA origami lattice. We have investigated the influence of the finite number of adsorption sites on the observed pattern, as well as the effect of the particle density in solution on the observed particle density on the pattern.
The adsorption behavior of the hybrid nanostructures was examined at different concentrations and period lengths. The resulting particle densities were plotted and compared in figure 4(e). At a concentration of 0.275 nM, the particle density was observed to be low only at 0 nm period, and remained nearly constant from 500 nm to an infinite period. At a concentration of 0.055 nM, a clear rise in particle density was observed as the period length increased from 0 to 4000 nm, followed by a trend toward saturation. At low concentrations ranging from 0.014 to 0.046 nM, the adsorbed density is strongly reduced not only at a small period where this is expected from the number of available particles but also the saturation value is much below the density expected from space-filling.
To gain insights into the potential influence of surface diffusion on hybrid nanostructures density variation, we developed a physical diffusion model to describe this data. To facilitate our experiments, we used binding site lines with a length of 40 μm, which was significantly larger than the spacing used. This allowed us to approximate the diffusion of hybrid nanostructures in one dimension, thereby providing us with a simpler system to study.
We modeled the diffusion of hybrid nanostructures on the surface using Fick's second law. Therefore, we can relate the probability density of the diffusing species to its spatial and temporal evolution. C(x, t) is defined as the probability density of particles at position x and time t. The diffusion coefficient D governs the diffusion process of surface hybrid nanostructures. It was also assumed that C0 is proportional to the concentration and remains approximately constant during the diffusion process. Within this description, a partial solution to Fick's second law is given by:

Which is a Gaussian with a variance of  Additionally, we assumed that the hybrid nanostructure is immobile if it reached a binding site. Therefore, the number of adsorbed hybrid nanostructures can be calculated by integrating the probability density function C(x, t) from 0 to xn
, where xn
represents the passive length between the two lines. However, due to the limited number of adsorption sites, we take the steric hindrance into account by the following approximation. The probability of a particle originating from a distance xn
to the line is calculated as a product of the probability to reach the active site via diffusion in the given time and the probability of the binding site being unoccupied. In other words, the density in the lines is given by:
Additionally, we assumed that the hybrid nanostructure is immobile if it reached a binding site. Therefore, the number of adsorbed hybrid nanostructures can be calculated by integrating the probability density function C(x, t) from 0 to xn
, where xn
represents the passive length between the two lines. However, due to the limited number of adsorption sites, we take the steric hindrance into account by the following approximation. The probability of a particle originating from a distance xn
to the line is calculated as a product of the probability to reach the active site via diffusion in the given time and the probability of the binding site being unoccupied. In other words, the density in the lines is given by:
In this experimental study of 1D patterns, we maintained a constant incubation time of 3600 s while determining the initial concentration  from the measured density at a large 2D active site ('0 nm' spacing). The saturation density was determined from the measurements at large spacing and high concentration. Within the model, only one free fitting parameter was then used to obtain the best agreement of the curves to the experimental data, which is the diffusion constant. For experiments using the highest concentration of particles in the liquid (black dots in figure 4(e)), the diffusion length was already determined (for the same concentration) in the measurements discussed in section 3.1. The agreement of the black line in this sense is reached without a free parameter. Within this model, the only possibility to explain the lower saturation densities observed at low concentrations is by a reduction in the diffusion coefficient. It is worth noting that the diffusion coefficient can be influenced by the interactions between the hybrid nanostructures, which can vary considerably depending on the concentration [46, 47]. Therefore, considering the simplicity of our model, we obtained good agreement with all experimental data by assuming a strongly reduced diffusion coefficient for lower concentrations (see figure 4(e)). Here, the lower saturation at low concentration results from the limited number of hybrid nanostructures that can reach the active sites. To validate the strong dependence of diffusion on concentration, we also conducted the experiments discussed in section 3.1 for a lower concentration and found consistent behavior (see supplementary information, S2).
3.3. 0D adsorption patterns
Though 2D or 1D structures have interesting applications, it is highly desirable to selectively position a single hybrid nanostructure in a 0D pattern for many practical functions. The reduction in dimensionality results in a significant decrease in the density of active adsorption sites. From the results in section 3.2, we expect that the diffusion within the liquid will at large spacing already provide enough particles to occupy these sites. Therefore, we focus on the diffusion at shorter spacing in this section. To understand the adsorption mechanism in single binding sites, we examined a large area filled with binding sites separated by 500 nm, figure 5(a) shows an SEM image of the bindings events at a concentration of 0.055 nM.

Figure 5. (a) SEM image of the hybrid nanostructures adsorbed on a 0D pattern with an array of 100 nm × 70 nm active sites with a periodic spacing of 500 nm, at a concentration of 0.055 nM. (b) Histogram of the occupation probability for empty sites (yellow), single hybrid nanostructure binding (green), and multiple binding (purple), at varying concentrations of hybrid nanostructure. The corresponding Poisson probabilities are shown with transparent shading.
Download figure:
Standard image High-resolution imageFigure 5(b) summarizes our findings for rectangular patterns of active sites. We classified the occupation into three categories: empty, occupied with a single hybrid, and occupied with multiple hybrid nanostructures. The statistical analysis of 250–400 binding sites (see supplementary information, S3) reveals an occupancy rate of single hybrid nanostructure at 77% for a concentration of 0.275 nM. Furthermore, we repeated the analysis samples with lower hybrid concentrations. As the hybrid concentration decreases, the number of vacant sites rises and the rate of single binding falls (figure 6). The rate of multiple bindings does not change significantly with concentration, remaining at roughly 20% in the range of 0.055–0.275 nM. According to the study reported by Gopinath and Rothemund [41], multiple binding can occur when the second or third origami binds before the first one can fully occupy the site, resulting in an increase in multiple bindings with increasing concentration.

Figure 6. SEM images show the orientation of hybrid nanostructures in binding sites with dimensions of (a) 70 nm stripe, (b) 100 nm × 70 nm, (d) 20 nm stripe, and (e) 70 nm × 20 nm, scale bar 300 nm in all cases. The histograms of the orientation reveal a clear preference for hybrids orientation where the long axis of the origami is parallel to the long axis of the adsorption site (corresponding to an angle of 0°) on the lithographic 0D pattern with dimensions of (c) 100 nm × 70 nm and (f) 70 nm × 20 nm.
Download figure:
Standard image High-resolution image
As shown in section 3.1 of the 2D adsorption sites, a particle density of 35 ± 1.2 μm−2 can be reached via 3D diffusion for the highest concentration of 0.275 nM. From our analysis of 0D binding sites, we find an occupation of 98%, which equals a total particle density of 7.2 μm−2. Therefore, occupancy can be easily achieved via 3D diffusion of the hybrid nanostructures with this concentration. For the intermediate concentration of 0.055 nM, we expect a particle density of 4.2 ± 0.8 μm−2 from 3D diffusion in section 3.2. The experimental particle density determined for this concentration is 4.4 ± 1.0 μm−2. Since we find very large diffusion coefficients in our diffusion model for this concentration, the unoccupied site can be filled by a particle via surface diffusion. However, since the density of particles approaches the density of free sites, we already find unoccupied sites. For the low concentration of 0.014 nM, our results from the 1D pattern indicate a very small diffusion coefficient, so surface diffusion between two active sites in the 0D pattern is unlikely. In this way, the pattern can be viewed as isolated capture areas surrounding each active site. Within such a description, we estimate a density of 0.34 ± 0.22 μm−2 taking the values determined in the last chapter (see supplementary information, S4). We measured a density of 0.68 ± 0.33 μm−2. And we judge this agreement to be good considering the simplicity of the models used and take it as independent proof that, despite their simplicity, they are capturing the essential physics.
Notably, the probability of finding a site singly occupied for a given number of particles in these pre-structured surfaces is strongly enhanced compared to a statistical distribution from random (non-interacting) particles. To illustrate this, we have added the results expected from Poisson statistics as open boxes in figure 5(b) for the same total density of particles as experimentally observed. We find that the chance of higher occupation is strongly reduced compared to the Poisson distribution as expected, because the steric hindrance of the first particle adsorbed, reducing the chance for the next to attach to the same site. In addition, we observed that the probability of finding an empty site is significantly reduced. This is mainly due to the fact that only the final number of observed particles is considered as an input to the statistics. In reality, the density is much higher during incubation, however, particles remaining on the passive area are washed away afterward and do not enter active sites. Considering this higher density in the Poisson distribution will shift their weights further towards occupations larger than 1.
In addition to optimal occupation, accurate adsorption with high positional control is another critical factor for practical applications. We assessed the positional precision of our structures by employing a Python algorithm to analyze the center of mass (COM) of hybrid nanostructures in SEM images. We measured the individual deviations between the COM of the nanostructure and the COM of the binding site for 156 sites. The results showed a variance of 4.5 nm in the long direction and 3.7 nm in the short direction (see also supplementary information, S5).
As discussed in section 2.2, the negative silanol group present on the origami surface facilitates strong adsorption to the binding sites, while weakly bound hybrid nanostructures on the passive layer can be effectively removed using an appropriate cleaning approach. To verify the effectiveness of this cleaning method for the comparatively dense 0D pattern with small spacing between active sites, a statistical analysis was conducted. We observed that only 0.6% of the total particles were observed on the passive layer compared to the number of particles adsorbed on the binding sites, with a density of less than 0.043 μm−2. This corresponds to approximately 1 particle sticking to the passive layer for every 100 binding sites (see supplementary information, S6). The cleaning process, therefore, remains highly efficient also even for comparably dense 0D patterns.
3.4. Orientational control
Gopinath and Rothemund have demonstrated how to align fluorescent emission dipoles using the origami technique [12, 48]. In our study, we observed, that the long side of the DNA origami tends to align along the long axis of the active site when the width of the stripe pattern decreased from 70 nm (figure 6(a)) to 20 nm (figure 6(d)). Notably, in the 20 nm stripe pattern, approximately 90% of the adsorbed hybrid nanostructures exhibited an almost perfect alignment with the long axis. To understand the experimental angular distributions of the hybrid nanostructures that were positioned, we measured the orientation angle of 400 sites with single binding. Figure 6(c) shows a clear preference for the rectangular hybrid nanostructures in 100 nm × 70 nm binding sites, and the relative occupancy with the correct alignment of the orientation of hybrid nanostructures within ±15° is 40%. Encouraged by seeing the orientation in the stripe pattern, we redesigned binding sites with the size of 70 nm × 20 nm in order to optimize the alignment of hybrid nanostructure. Using this larger aspect ratio rectangular shape, we expect a higher degree of alignment control. As seen from the result in figure 6(f), the orientational ordering improves to 70% of the hybrid nanostructures aligned within ±15°. The active sites, in this case, are smaller than the DNA origami itself, but still able to bind a single hybrid nanostructure. Due to the relative flexibility of the origami along its short axis [49], it is expected that the origami may fold onto the active site, resulting in the observed improvement in orientational order for active sites with a high aspect ratio. However, employing smaller binding sites also decreases the binding efficiency. Therefore, the higher orientational alignment in this approach comes at the cost of lower site occupation.
4. Conclusion
In summary, our study successfully demonstrated the self-assembly of plasmonic dimers using DNA origami in combination with high-precision lithography to create adsorption sites on a silicon substrate. We achieved high binding selectivity, regardless of pattern dimension. We have also studied the effect of surface diffusion on the achieved ordering, demonstrating how it is affected by the concentration of the hybrid nanostructures in the liquid. For 0D pattern, the diffusion of hybrid nanostructure in the liquid and steric hindrance dominates the ordering. For 1D pattern, surface diffusion becomes increasingly critical. We also observed that the hybrid concentration has a crucial effect on diffusion. We modified a diffusion model to take these effects into account, which support our experimental observation. For 2D structures, steric hindrance becomes less important to the adsorption process. Instead, surface diffusion on both passive and active areas determines the adsorption. In particular, in reduced dimensions, a proper choice of parameters can allow high control over the ratio of occupied sites for a given pattern. In 0D pattern, this allows us to achieve a high occupation rate with single hybrid nanostructures. This recipe allows for a high level of positional and orientation control on essentially unlimited patterns. We expect these results to be qualitatively similar to different structures, different substrates, or different types of origami-particle hybrids. Our findings have significant implications for the development of nano-electronics and nano-plasmonics applications, as the high-precision positioning of individual plasmonic dimers holds great promise in driving progress within these fields.
Acknowledgments
This work was funded by the Deutsche Forschungsgemeinschaft (DFG, German Research Foundation) under Germany's Excellence Strategy—EXC-2123 Quantum Frontiers—390837967, as well as from the state of Lower Saxony under the project QuanTec., Project ID: 76251 (ZN 3820). We acknowledge DFG funding under grant INST 188/452-1 FUGG, the Research Training Group GrK1952, Metrology for Complex Nanosystems (NanoMet), and the Braunschweig International Graduate School of Metrology (B-IGSM).
Data availability statement
The data cannot be made publicly available upon publication because the cost of preparing, depositing and hosting the data would be prohibitive within the terms of this research project. The data that support the findings of this study are available upon reasonable request from the authors.
Supplementary data (1.7 MB PDF)