

Abstract
High orientation consistency and adjustable convex width of the low-spatial-frequency laser-induced periodic surface structures (LSFLs), crucial to the functional surface characteristics, have remained elusive. This paper proposes a new method to fabricate LSFLs with high orientation consistency on the rough surface of titanium by combining laser polishing and laser induction with LSFLs with a tunable convex width via laser melting as the post-treatment. Picosecond pulses trained with a 50-ns interval are applied to regulate the thermal incubation effect and achieve laser polishing and laser nanoscale melting. The melting time of titanium for laser polishing and laser nanoscale melting is determined to be on a microsecond time scale and around 100 ns, respectively. Experimental studies show that the surface texture of titanium lowers the orientation consistency of LSFLs and that its divergence angle is 30°. Picosecond pulses with a sub-pulse number of three are applied to achieve surface polishing and the formation of the rudiment of the LSFLs, followed by the picosecond laser induction. As a result, the divergence angle of LSFLs decreases from 30° to 12°. On this basis, aiming at the problem of the narrow adjustability of the convexity ratio of LSFLs, a nanoscale melting processing method based on picosecond pulse trains with a sub-pulse number of four is proposed, and LSFLs with the tunable convexity ratios from 0.3 to 0.87 are obtained.
Export citation and abstract BibTeX RIS
1. Introduction
Surface nanopatterning is an effective way to achieve various artificial surface functionalities, such as controllable optical response and adjustable wettability. Ultrashort laser-induced periodic surface structures (LIPSS) show regular groove structures with a period on the incident laser wavelength scale [1] suitable for the construction of functional surfaces [2], including superconductivity [3], antibacterial adhesion [4], fluorescence sensor [5], and structural color [6]. Additionally, they can be created on the surface of almost any material [7], including metals [8], semiconductors [9], insulators [10, 11], and so on [12, 13]. The geometrical feature of LIPSS, containing the period, orientation, and convex width, will affect their working performance, especially structural color.
Surface functional characteristics are closely related to the period of the LIPSS. Upon laser irradiation, LIPSS can be divided into two general classes. One is the low-spatial-frequency LIPSS (LSFLs), which have a slightly smaller period than the incident wavelength and an orientation perpendicular to the laser polarization direction. The other is the high-spatial-frequency LIPSS (HSFLs), which have a period equal to or smaller than half of the incident wavelength and an orientation perpendicular or parallel to the laser polarization direction [14]. Until now, the formation mechanism of HSFLs is disputable, and the control of their geometrical feature is ambiguous [15]. Moreover, it is widely accepted that LSFLs originate from an interference of the incident light with surface electromagnetic waves excited by laser irradiation [16]. Much work has been conducted on the effect of the laser parameters on the period of LSFLs. It was concluded that laser wavelength [17, 18] had the main responsibility for the period of LSFLs and laser power [19, 20], angle of incidence [21], and scan speed [20, 22], slightly modifying the period of LSFLs. As a result, the period of LSFLs can be easily modified by regulating the laser wavelength.
Additionally, the orientation control of LSFLs is the enchanted way to achieve anisotropic function, where the high orientation consistency of LSFLs is an essential precondition for the control of its orientation. For example, a high orientation consistency of LSFLs makes the colors observable in a narrow range of viewing angles [23]. Even though the orientation of LSFLs can be well controlled by the laser polarization direction [24, 25], the surface roughness of materials should be controlled down to a few nanometers to form LSFLs with high orientation consistency [26]. Many studies have reported that the LSFLs formed on a rough surface showed low orientation consistency [6, 27]. Especially, the surface roughness of metals is more disadvantageous to the orientation consistency of the LSFLs owing to their optical depth of dozens of nanometers. Moreover, fine polishing is costly, and a random nano-level high-frequency waviness is still generated on the surface of the material, which might also lower the orientation consistency [28]. Moreover, it is generally accepted that surface roughening is a necessary precondition for the formation of LSFLs on a metal surface [29]. In this context, it is essential to artificially construct a rough surface for the formation of LSFLs with high orientation consistency.
An adjustable convex ratio, defined as the ratio of the convex width of LSFLs to their period, determines the duty factor of the nanostructure, which is also very important for the modification of surface functionalization. Despite several decades of intensive research, the convex width of LSFLs cannot be adjusted on a large scale. According to the published work about the formation of LSFLs on bulk materials [3, 15, 30], it is found that the ratio of convex width to the period of LSFLs is higher than 60%. It is well known that the surface tension [31] can drive the liquid to the minimum energy, and the thermocapillary convection [32] can drive the liquid to the lower temperature zone. Hence, surface nanoscale melting seems an effective method to control the convex width of the LSFLs, which has not been reported yet.
Therefore, the purpose of this paper is to fabricate the LSFLs with high orientation consistency on the rough surface of titanium using pre-treatment of laser polishing and obtain the LIPSS with an adjustable convex width via the post-treatment of laser nanoscale melting. In this paper, the orientation consistency of the LSFLs on the rough surface of titanium is first evaluated by direct picosecond laser processing. Then, as shown in figure 1, a picosecond laser polishing with 50-ns interval pulse trains is proposed (sub-pulse number of three, shown in figure 1(a)) to achieve a smooth surface along with the rudiment of LSFLs. Then, picosecond laser induction is performed to fabricate the LSFLs with high orientation consistency. Last, picosecond pulsed laser nanoscale melting with 50-ns interval pulse trains (sub-pulse number of four, shown in figure 1(b)) is applied to modify the convex width of the LSFLs. Moreover, picosecond pulse trains with an interval of 50 ns are adopted to enhance the surface melting feature of titanium. The sub-pulse energy in figure 1 is defined as the pulse energy divided by the sub-pulse number.

Figure 1. Schematic diagram of the picosecond pulse trains for laser polishing and nanoscale melting, respectively..
Download figure:
Standard image High-resolution image2. Experimental section and simulation
2.1. Sample preparation
The surface roughness (Ra) of titanium (TA1) was approximately 100 nm. The purity of all the substrates was 99.99%. The sample was first cleaned several times ultrasonically in the alternate bath of acetone.
2.2. Picosecond laser irradiation
A Nd:YVO4 picosecond laser system (Edgewave PX200-2-GF), which delivers 10-ps-width pulses with a maximum power of 100 W, was applied. The laser beam has a Gaussian energy density distribution with a beam quality factor (M2) of approximately 1.1. The wavelength of 532 nm was used here. The formation of an elliptical spot is shown in figures S1 and S2. When the round spot and elliptical spot of the picosecond pulse were applied in direct picosecond laser induction, a motorized XYZ stage (Owis, Germany) controlled by a computer was used for the precise positioning of the samples. When the sequential combination of laser polishing, laser induction, and nanoscale melting was applied, a 2D galvanometric scanner (GalvoTech GS.9B9-10-03) was employed to move the laser beam along X- and Y-directions over a sample surface. The laser was focused normally on the sample surfaces through an F-theta lens (160 mm focal length), producing a focal spot size of about 20 μm.
2.3. Nanosecond laser irradiation
A Nd:YAG nanosecond laser system (InnoLas, Germany), delivering pulses with a duration of 10 ns, was used for the irradiation. The maximum pulse energy of the laser system was 150 mJ. The energy density distribution across the laser beam was Gaussian (corresponding root-squares were about 95% detected by the aser Beam Profiler (Duma Optronics, BeamOn-VIS)) with a beam quality factor of (M2) ∼ 1.3. In this paper, the applied laser wavelength was 1064 nm, and the repetition rate was 100 Hz. The laser beam was normally incident onto the surface of the sample without focusing. A motorized XYZ stage (Owis, Germany) controlled by a computer was used for the precise positioning of the samples.
2.4. Characterization
The surface waviness of the samples was detected using profile instruments (Taylor Hobson, PGI 3D). In addition, the surface of the samples was observed using a scanning electron microscope (HITACHI, S8000) and the Energy Dispersion Spectrum (EDS). Figure 2(a) shows that the bottom LSFLs in the SEM are substantially darker than the top LSFLs. Therefore, a two-dimensional Fourier transform diagram of the LSFLs with an area of 25 μm × 25 μm (figure 2(a)) was created using DigitalMicrograph software, which was commonly utilized for obtaining the Fourier-transform pattern of a crystal. Figure 2(b) depicts a two-dimensional Fourier transform diagram whose color varies with the log of intensity. Here, The maximum strength refers to the maximum amount of the LSFLs with a certain orientation, where 10% of the maximum strength is designated as the critical strength. The divergence angle of the critical strength computed from the Fourier transform diagram of LSFLs was used to evaluate their orientation consistency, as shown in figure 2(c). In this case, the reduction of the divergence angle means improving the orientation consistency of LSFLs.
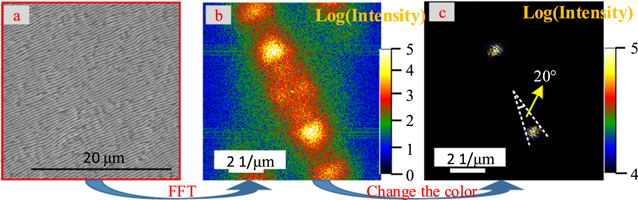
Figure 2. Method Diagram of computing the divergence angle of LSFLs.
Download figure:
Standard image High-resolution image2.5. Simulation section
The electric field was obtained with the electromagnetic wave, which is the frequency domain of COMSOL. The temperature simulation with pulse trains was performed via heat transfer in the solid module of COMSOL, where the physical parameters were the one TA1 built in COMSOL. The focus size of the laser pulse was 20 μm, and the repetition rate was 1 MHz.
3. Results and discussion
3.1. Low orientation consistency of the LSFLs on a rough surface of titanium by direct picosecond laser processing
First, the orientation consistency of LSFLs on the rough surface of titanium was examined. When the laser fluence is 0.769 J cm−2, the evolution of the surface shape with an effective spot overlapping number (equal to the diameter of the focus spot plus repetition rate/scan speed) is shown in figure 3(a). The absorption and transfer of laser energy by metals under ultrashort laser irradiation can be described via a two-temperature model which calculates both electron and lattice temperature at the same time. It is well known that the increase in the electronic temperature of titanium produces high electronic pressure. Under picosecond laser irradiation, the crystal temperature of titanium rises gradually due to the electron-phonon coupling processing and the electronic pressure [33]. In this state, the top part of the target undergoes an explosive decomposition into vapor and small clusters/droplets, which will become the nanoparticles deposited on the surface of the titanium [34].
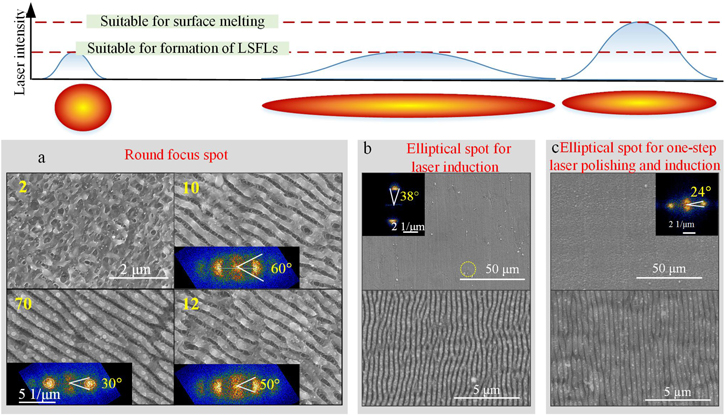
Figure 3. Fabrication of LSFLs on a rough surface of titanium by direct picosecond laser processing: (a) round spot; (b) elliptical spot with a laser fluence suitable for laser induction; (c) elliptical spot for one-step laser polishing and laser induction.
Download figure:
Standard image High-resolution imageTherefore, the surface roughness of titanium increases, the nanoparticles are deposited on the surface at the effective spot overlapping number of two, and the rudiment of LSFLs appears.The LSFLs become distinct at the effective spot overlapping number of 10, where the divergence angle is around 60°. The divergence angle is around 30° with an effective spot overlapping number of 70. Therefore, the orientation consistency of LSFLs by conventional direct picosecond laser processing is unsatisfactory.
Some researchers have shown that the orientation consistency of LSFLs can be improved with elliptical spots owing to its gradient decrease of laser fluence [13, 35]. However, as shown in figure 3(b), the orientation consistency of LSFLs produced under picosecond laser irradiation with elliptical spots (optimal parameters: spot size of 3 mm × 15 μm, pulse energy of 90 μJ (laser fluence of 0.064 J cm−2), the repetition rate of 100 kHz, the scan speed of 15 mm s−1, and scan interval of 200 μm) is still unsatisfactory, and the divergence angle is 38°. It can be concluded that the random surface texture worsens the orientation consistency of LSFLs, which also cannot be eliminated via an elliptical spot.
According to the research above, picosecond laser induction with elliptical spots still cannot improve the orientation consistency of LSFLs because the initial surface roughness of titanium is too large. Therefore, a one-step laser polishing and laser induction with elliptical spots are proposed. In detail, the highest laser fluence in the center of the spot beam is applied for laser polishing and produces the rudiment of LSFLs. In this context, the laser fluence slightly away from the center of the spot beam is suitable for the formation of LSFLs. Then, the low laser fluence away from the center of the spot beam is applied for structure refinement. Consequently, the peak laser fluence of the elliptical spot increases enough for laser polishing. As shown in figure 3(c), the divergence angle of the as-prepared LSFLs (optimal parameters: spot size of 200 μm × 15 μm, pulse energy of 10 μJ (laser fluence of 0.106 J cm−2 ), repetition rate of 100 kHz, scan speed of 8 mm s−1, and scan interval of 50 μm) is about 24°, suggesting that the orientation consistency of LSFLs improves. However, the lines crossing the LSFLs appear due to the beat frequency of photonic frequency and plasmon frequency.
As a result, the advantages of laser processing with elliptical spots are as follows. The center area with high laser energy is suitable for laser polishing together with the fabrication of the rudiment of LSFLs, and the low laser fluence in the edge of the spot beam is suitable for finishing the LSFLs. The two features of elliptical spots can improve the consistency of LSFLs. Its disadvantage is that it is a primary process, and there is an intermediate gradient laser energy, which destroys the orientation consistency and integrity of LSFLs. Laser polishing and laser induction are carried out step by step to solve this problem, secure the flexible regulation of the two processes, and obtain the LSFLs with high orientation consistency and integrity.
3.2. Feasibility analysis of thermal polishing and the formation of the rudiment of the LSFLs with picosecond pulse trains
It is very difficult to figure out the effect of roughness on the orientation consistency of LSFLs directly. It is well known that surface roughness is a combination of various waviness with a certain period and amplitude. Therefore, the effect of period and amplitude of waviness on the orientation consistency of LSFLs is investigated here. The effect of waviness on the absorbed laser energy distribution was carried out via electromagnetic wave theory to determine the critical period and amplitude of the waviness that affects the direction consistency of LSFLs. The maximum amplitude of the sinusoidal wave in the simulation was set to 50 nm. A detailed discussion is shown in the supplement (figure S3). It is found that if the spatial period of the waviness is less than 10 times the laser wavelength, the relation between the critical amplitude (A) and the period of the waviness (P) can be expressed as  If the period of the waviness is higher than 10 times the laser wavelength, the 50-nm amplitude of surface waviness has a negligible effect on the consistency of LSFLs.
Next, the role of thermal laser polishing in the removal of the surface texture was analyzed. As for the metal, the final amplitude of surface waviness,  with the melt time can be present in the form [36]:

where fx and fy are the spatial frequencies in the x and y directions, respectively, and fcr is the critical spatial frequency calculated as follows [37]:

where ρ is the density which is 4.5 g cm3, μ is the dynamic coefficient of viscosity, and tm is melting time.
According to equation (1), with the same melting time, i.e., the same critical spatial frequency, the amplitude of the waviness with a higher spatial frequency (an increase of fx or fy) decreases more obviously. Surface waviness with a high spatial frequency has more influence on laser energy deposition, and thermal laser polishing can more easily remove the waviness with a high spatial frequency. Therefore, laser polishing is an effective method for improving the orientation consistency of LSFLs. Additionally, according to equation (2), for the wavelength of 532 nm, the critical spatial frequency (its period has 10 times the laser wavelength) should be around 2 × 10⁵ 1/m (period of 5 μm). The melting time of titanium should be on the microsecond time scale.
As shown in figures 4(a1) and (a2), titanium is vulnerable to oxidization [38]. Then, the crack is covered on the surface of the titanium under nanosecond laser thermal polishing, even though the surface of the titanium becomes a mirror. After surface corrosion treatment, as shown in figures 4(a3) and (a4), it can be seen that the thickness of titanium oxide is approximately 500 nm. On the other hand, with conventional picosecond laser polishing, as shown in figures 4(b1) and (b2), there is no crack but melting ripples formed on the surface of the titanium, which is the new-formed surface roughness. As a result, LSFLs would have a low orientation consistency due to the melting ripples. However, as shown in figures 4(c1) and (c3), when picosecond laser polishing with pulse trains is applied, the titanium surface becomes smooth, and there are titanium oxide nanoparticles covered on the surface of the titanium. This indicates that the surface of titanium goes through oxidization while the thickness of titanium oxide is too thin to form cracks. Therefore, the picosecond laser with pulse trains has unique advantages in the surface polishing of titanium.

Figure 4. Comparison of the morphologies with nanosecond laser polishing (a1)–(a4), picosecond laser polishing (b1), (b2), and picosecond laser polishing with pulse trains (c1), (c2). (d) Theoretical surface temperature with various sub-pulse energy and pulse number at the fixed sub-pulse number of 3. The orange dotted line is the melting point of titanium.
Download figure:
Standard image High-resolution imageFrom the result above, the melting time of titanium should be on the microsecond time scale. Moreover, the microgroove will form and bring in new roughness with increasing laser power or decreasing scan speed. At the fixed sub-pulse number of three and repetition rate of 1 MHz, the theoretical surface temperature change with a pulse number of 30 (90 sub-pulse) was investigated under various sub-pulse energy. The repetition rate of the picosecond laser was 1 MHz, and the melting time was on the order of μs if the temperature of titanium between two pulses was above its melting time. As shown in figure 4(d), the surface melting time is on a microsecond scale when the sub-pulse energy is above 1 μJ (laser power of 3 W) with a pulse number of 30.
According to the results in figure 4, the repetition rate is set as 1 MHz, and the sub-pulse number with an interval of 50 ns is three. Additionally, the scanning interval is fixed as 5 μm, laser power is 2, 4, and 6 W (laser fluence of 0.159 J cm−2, 0.318 J cm−2 and 0.477 J cm−2), and the scan speed changes from 200 mm s−1 to 2000 mm s−1. The surface morphologies and the amplitude of surface waviness after laser polishing are shown in figure 5. The abrupt change of the amplitude of surface waviness indicates there is a peak on the surface of titanium which will lower the orientation consistency of LSFLs. In this regard, the amplitude of waviness had to be analyzed, and the abrupt change of their amplitudes had to be investigated.
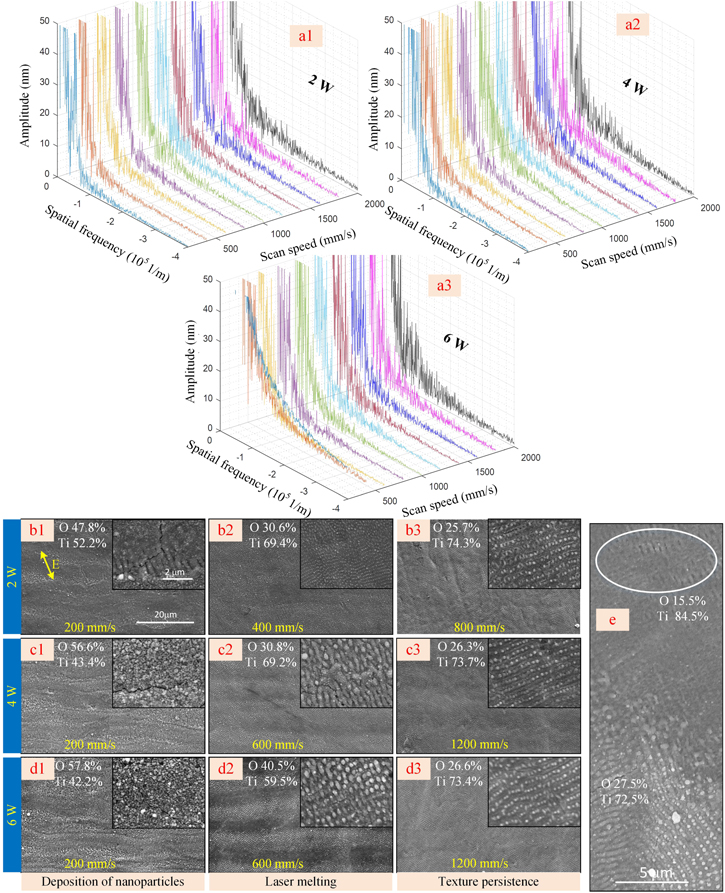
Figure 5. (a1)–(a3) The amplitude of the surface waviness with the laser power of 2, 4, and 6 W and various scan speeds. (b1)–(d3) The surface morphologies of titanium and the atomic contents of titanium and oxygen by EDS. (e) The rudiment of the LSFLs under the surface of titanium oxide.
Download figure:
Standard image High-resolution imageAs for the decrease in the amplitude of surface waviness (shown in figures 5(a1)–(a3), the melting time of titanium at the laser power of 2 W is on nanosecond timescales. Moreover, the high spatial frequency (1 × 10⁵ 1/m) remains, and the amplitude curve is not smooth. When the laser power increases to 4 W and 6 W, the surface texture is removed due to enough melting time. Specifically, the amplitude of the waviness decreases with the scan speed of 400 mm s−1 and 600 mm s−1, and the abrupt change of the curve is negligible.
As for the removal of the surface texture, when the laser power is 2 W (shown in figures 5(b1)–(b3), the surface texture disappears at the speed of 400 mm s−1 and remains at the scan speed equal to or larger than 800 mm s−1. However, when the laser power is 4 W and 6 W (shown in figures 5(c1)–(d3), there is no deposition on the surface of the titanium at the scan speed equal to or larger than 600 mm s−1. However, the surface texture cannot be removed at a scan speed larger than or equal to 1200 mm s−1. Therefore, even though a high laser fluence is applied, the surface texture cannot be removed at a high scan speed.
As for the surface oxidization, to avoid the abrupt change of the refractive index between the air and titanium, the ablated nanoparticles are deposited on the surface of titanium to form the flocculent structure at the scan speed of 200 mm s−1 for the three types of laser power. Additionally, the formation of cracks suggests the thickness of the TiO2 film is too thick. At other scan speeds, there are nanoparticles and nano lines covered on the surface of the titanium. In addition, it is found that a higher amount of oxygen is obtained by EDS compared to the initial sample (the atomic contents of titanium and oxygen are 85.8% and 14.2%, respectively). Therefore, laser polishing is accompanied by surface oxidization with picosecond pulse trains, which can mitigate adverse factors arising from surface defects.
As for the formation of the rudiment of LSFLs, it is very difficult to directly observe the rudiment of the LSFLs because the surface is covered with titanium oxide. Therefore, a single pulse with the same laser fluence is applied to remove the oxidized materials. As shown in figure 5(e), the rudiment of LSFLs is shown under the surface of titanium oxide. In this condition, LSFLs can be produced without roughening the surface again.
3.3. The high orientation consistency of LSFLs on a rough surface of titanium by combining picosecond laser polishing and laser induction
Laser induction is performed to determine whether the surface obtained by laser polishing is suitable for the formation of the LSFLs with high orientation consistency. The scanning interval is set as 5 μm, and the repetition rate is set as 400 kHz in laser induction. The optimization procedure and the corresponding results are shown in figure 6. The following three problems must be solved to obtain LSFLs with high orientation consistency on the rough surface of titanium:
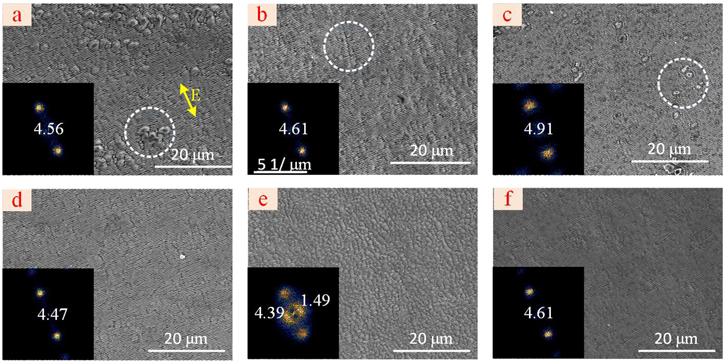
Figure 6. The optimization procedure of laser polishing and laser induction: (a) laser power and scan speed in laser polishing is 4 W and 200 mm s−1, respectively; laser power and scan speed in laser induction is 400 mW (laser fluence of 0.08 J cm−2) and 400 mm s−1, respectively. (b) Laser power and scan speed in laser polishing is 2 W and 400 mm s−1, respectively; laser power and scan speed in laser induction is 400 mW (laser fluence of 0.08 J cm−2) and 600 mm s−1, respectively. (c) Laser power and scan speed in laser polishing is 6 W and 400 mm s−1, respectively; laser power and scan speed in laser induction is 400 mW (laser fluence of 0.08 J cm−2) and 2000 mm s−1, respectively. (d) Laser power and scan speed in laser polishing is 6 W and 400 mm s−1, respectively; laser power and scan speed in laser induction is 400 mW (laser fluence of 0.08 J cm−2) and 600 mm s−1, respectively. (e) Laser power and scan speed in laser polishing is 6 W and 600 mm s−1, respectively; laser power and scan speed in laser induction is 400 mW (laser fluence of 0.08 J cm−2) and 400 mm s−1, respectively. (f) Laser power and scan speed in laser polishing is 6 W and 600 mm s−1, respectively; laser power and scan speed in laser induction is 350 mW (laser fluence of 0.07 J cm−2) and 400 mm s−1, respectively.
Download figure:
Standard image High-resolution imageThe first problem is that too much deposition cannot be removed by laser induction. As shown in figure 6(a), when the surface of titanium is covered with deposited materials, laser induction cannot remove the deposited titanium oxide, even though the as-formed LSFLs had a high orientation consistency.
The second problem is that the remaining surface texture will destroy the integrity of the LSFLs. When the surface texture remains on the surface of titanium, some of the LSFLs have a high orientation consistency. However, the surface texture destroys the integrity of the LSFLs, as shown in figure 6(b).
The third problem is that the unsuitable scan speed cannot remove the oxidization film to form the LSFLs in a large area. As shown in figure 6(c), when a good surface is obtained with laser polishing at the laser power of 6 W and a scan speed of 400 mm s−1, the oxidized material cannot be removed with a high scan speed of 2000 mm/s for laser induction. When the scan speed of laser induction is up to 600 mm s−1, the deposition is almost removed, as shown in figure 6(d). Therefore, when an excessive amount of surface oxidized material is present, a lower scan speed should be applied to ensure the entire oxidization layer can be removed.
Therefore, in laser polishing processing, an excessive amount of oxidized materials deposited on the surface during the removal of surface texture should be avoided. Then, laser polishing parameters are set as a laser power of 6 W, and a scan speed of 600 mm s−1, the pulse energy for laser induction is set at 1 μJ (laser fluence of 0.08 J cm−2), and the microstructures appeared with an orientation perpendicular to LSFLs as shown in figure 6(e). Lastly, the pulse energy for laser induction decreased to 0.85 ± 0.05 μJ(laser fluence of 0.068±0.004 J cm−2), and the surface was covered with the LSFLs with a high orientation consistency.
Hence, the optimal laser polishing parameters are a sub-pulse number of three, laser power of 6 W, a repetition rate of 1 MHz, and a scan speed of 600 mm s−1. The optimal laser induction parameters are laser power of 350 mW and a repetition rate of 400 kHz. The scanning interval of the two procedures above is 5 μm.
The surface morphologies with various scan speeds are shown in figure 7(a) to verify the workability of the laser polishing for laser induction. The LSFLs become distinct at the scan speed of 2200 mm s−1, of which the divergence angle is 19°, and there is no deposited oxidized material covered on the surface of the titanium. The divergence angle of the LSFLs is down to 12° when the scan speed decreases to 400 mm s−1. In addition, as shown in figures 7(b) and (c), the period of the LSFLs is almost the same, while the divergence angle decreases with the scan speed. The divergence angle of the LSFLs is summarized by direct laser induction with round spots and elliptical spots, one-step laser polishing and laser induction with elliptical spots, and the two-step combination of the laser polishing and laser induction, as shown in figure 7(d). It can be seen that the divergence angle of the LSFLs with the two-step combination method is half of the one-step combination method, as well as one-third of the direct laser induction with round spots. Therefore, a sequential combination of laser polishing and laser induction can drastically improve the orientation consistency of the LSFLs on the rough surface of the titanium.
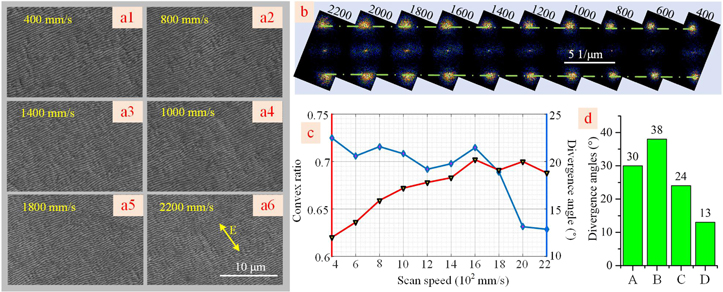
Figure 7. (a1)–(a6) LSFLs with various scan speeds. (b) The two-dimensional Fourier transform diagram of the LSFLs. (c) The divergence angle and the convex ratio of LSFLs with various scan speeds. (d) the divergence angle of the LSFLs with different methods: direct laser induction with round spots (A) and elliptical spots (B), one-step laser polishing and laser induction with elliptical spots (C), and the two-step combination of the laser polishing and laser induction (D).
Download figure:
Standard image High-resolution imageAs shown in figure 7(c), the convex ratio (convex width divided by the period of the LSFLs) increased from 0.62 to 0.73 with a decrease in the scan speed. Therefore, laser polishing accompanied by the production of the rudiment with picosecond pulse trains can help laser induction to obtain the LSFLs with high orientation consistency. However, their convex ratio value cannot change on a large scale.
3.4. The tunable convex width of the LSFLs via laser nanoscale melting with picosecond pulse trains
Pre-formed LSFLs affect the laser energy distribution, where the different temperatures cause thermocapillary convection. The simulational results are shown in figures 8(a) and 8(b), and laser energy intensity absorbed by titanium refers to the mean electromagnetic power loss density multiplied by the pulse duration. It can be seen that when the convex ratio is higher than 0.5, the laser energy intensity absorbed by titanium in the convex part is larger than that in the concave part of the LSFLs. On this condition, when a low laser fluence is applied, the convex part goes through melting and plugs the gap caused by the thermocapillary convection, increasing the convex ratio. When high laser fluence is applied, both the convex and concave parts of LSFLs go through melting, and the convex ratio decreases. Furthermore, when the convex ratio is 0.5, the laser energy intensity absorbed by titanium in the convex and concave parts of LSFLs is almost the same. As a result, micro melting happens as a whole, and the convex ratio will decrease because of the surface tension. In addition, when the convex ratio of LSFLs is less than 0.5, the laser energy intensity absorbed by titanium in the concave part of the LSFLs is higher than in the convex part. Therefore, the convex part of LSFLs can survive under laser melting.
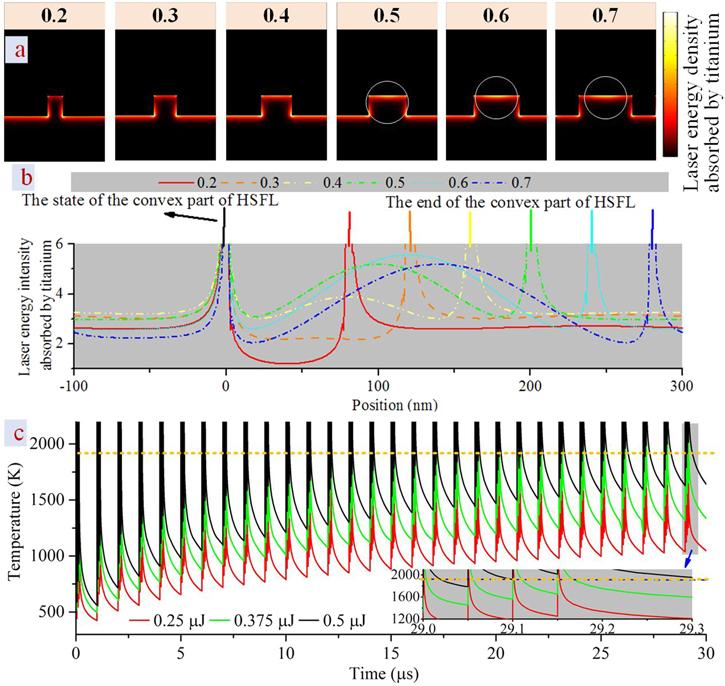
Figure 8. (a) Laser energy distribution modification on the surface of the titanium with the as-formed LSFLs with different convex ratios. (b) The line plot of the laser energy intensity absorbed by titanium of the LSFLs, where the distances between the black line and colorful lines are the convex part of the LSFLs. (c) Theoretical surface temperature with various sub-pulse energies and pulse numbers at the fixed sub-pulse number per pulse of 4. The orange dotted line is the melting point of titanium.
Download figure:
Standard image High-resolution imageAccording to equations (1) and (2), the nanoscale melting time should be on the nanosecond time scale (less than 100 ns) to ensure the survival of the LSFLs with a period close to 532 nm. Meanwhile, in order to control the melting time of titanium more flexibly, the sub-pulse number per pulse increases to four. At the fixed sub-pulse number of four and repetition rate of 1 MHz, the theoretical surface temperature changing with the pulse number of 30 (120 sub-pulse) is investigated under various sub-pulse energies and convectional heat transfer in the solid equation. The results are shown in figure 8(c). It can be seen that the melting time of titanium is on the picosecond timescale at the sub-pulse energy of 0.25 μJ, and the melting time of titanium is above 100 nanoseconds at the sub-pulse energy of 0.5 μJ with a pulse number of 30. Therefore, the sub-pulse energy should be from 0.25 μJ to 0.5 μJ (laser power from 1 W to 2 W).
In this section, the fixed parameters of the laser induction are the repetition rate of 400 kHz, laser power of 350 mW, and scanning interval of 5 μm, of which the variable is the scan speed. It can be obtained from figure 8 that laser power ranging from 1 W to 2 W is suitable for nanoscale melting. Therefore, fixed parameters of the laser nanoscale melting are the repetition rate of 1 MHz, pulse trains number of four, and a scanning interval of 5 μm, of which the variables are laser power (1 W, 1.5 W, and 2 W) and a scan speed (from 200 mm s−1 to 2000 mm s−1).
The scan speed for laser induction of 400 mm s−1 was chosen first, and the surface morphologies are shown in figure 9(a). The period of the as-prepared LSFLs is around 380 nm, and the width of the concave part is 110 nm, meaning the convex ratio is 71%. In addition, nanoparticles are located on the convex part of LSFLs. The nucleation, growth, and coalescence of voids take place under picosecond laser irradiation, and nanoparticles typically form due to the condensation of the ablation plume or from droplets splashed from the melt [39]. Then, these nanoparticles get oxidized in the air. The surface melting of titanium is not obvious when laser power for laser nanoscale melting is 1 W (laser fluence of 0.08 J cm−2). It can be seen that the surface oxidation and melting of titanium at the scan speed of 200 mm s−1 are more obvious than at the scan speed of 2000 mm s−1. Consequently, all nanoparticles aggregate into submicron points at the scan speed of 200 mm s−1, while some nanoparticles remain at the scan speed of 2000 mm s−1. Therefore, the laser power is so low that only nanoparticles are removed, but it is not enough to modify the convex ratio of LFSLs.
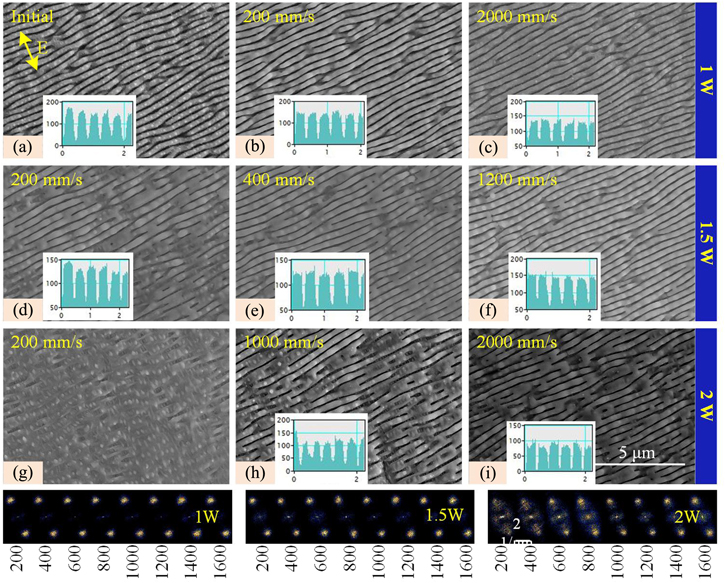
Figure 9. The evolution of LSFLs with the initial convex ratio of LSFLs of 71% via laser nanoscale melting.
Download figure:
Standard image High-resolution imageWhen laser power increases to 1.5 W (laser fluence of 0.14 J cm−2), obvious nanoscale melting occurs. Some LSFLs are connected due to the thermocapillary convection at the scan speed of 200 mm s−1, and the width of the concave part is 50 nm (the convex ratio of LSFLs is 87%). In addition, when the scan speed increases to 400 mm s−1, the convex ratio of LSFLs is 85%, and the nanoparticles disappear. Furthermore, the convex ratio of LSFLs is unchanged when the scan speed increases to 1200 mm s−1.
The nanoscale melting is too obvious with the laser power of 2 W (laser fluence of 0.16 J cm−2) and a scan speed of 200 mm s−1. Hence, LSFLs almost disappear, and only a few LSFLs with a convex ratio of 21% remain on the surface of titanium, as shown in figure 9(h). When the scan speed increases to 1000 mm s−1, almost all LSFLs survive, but some of them connect with each other. Then, the nanoparticles disappear with the scan speed of 1000 mm s−1, and the concave width of LSFLs is about 80 nm, which means the convex ratio is 79%.
Moreover, as shown in the Fourier transformation diagram, the laser nanoscale melting changes the convex ratio of LSFLs but not their period. This paper holds that for the initial convex ratio above 70%, nanoscale melting is more suitable for increasing the convex ratio of the LSFLs.
As a result, nanoscale melting can be achieved by modifying laser power and scan speed, where the period of the LSFLs does not change. However, the reduction of the convex ratio of LSFLs by laser nanoscale melting is not widely controllable when its initial convex ratio is 71%, which is suitable for obtaining the LSFLs with a higher convex ratio.
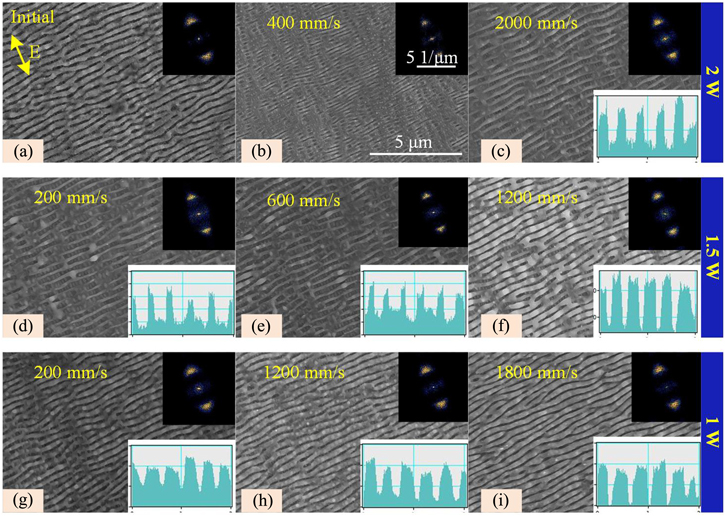
The LSFLs with a period of 380 nm and a convex ratio of 62% obtained with a laser induction scan speed of 2000 mm s−1 were chosen to obtain the LSFLs with a lower convex ratio by laser nanoscale melting. The LFSLs with various laser powers and scan speeds are shown in figure 10. As shown in figure 10(b), when the laser power is 2 W, the surface nanoscale melting effect is dominated. Therefore, even though the scan speed increases to 6000 mm s−1, the LSFLs disappear, and there is a big difference in the convex ratio of the remaining LSFLs. Until the scan speed increases to 2000 mm s−1, almost all LSFLs can survive, and their convex ratio is about 47% (figure 10(c)). When the laser power decreases to 1.5 W, the convex of LSFLs can be adjusted on a large scale with the change in the scan speed. In detail, the convex ratio is 29% at a scan speed of 200 mm s−1, 32% at a scan speed of 600 mm s−1, and 63% at a scan speed of 1800 mm s−1. It can be seen that the convex ratio of the LSFLs does not change but becomes smoother at the laser power of 1 W. As a result, the reduction of the convex ratio of the LSFLs by laser nanoscale melting is widely controllable when its initial convex ratio is 62%.
Figure 10. The evolution of LSFLs with the initial convex ratio of LSFLs of 62% via laser nanoscale melting.
Download figure:
Standard image High-resolution image
LSFLs with various convex ratios from 30% to 85% are obtained after conducting experimental studies with many variable parameters, as shown in figure S4.
4. Conclusions
A non-adjustable convexity ratio of LSFLs on the rough surface of titanium, picosecond laser polishing, and nanoscale melting with 50-ns interval sub-pulse was applied to address two major problems of poor direction uniformity. It was found that the melting time of titanium for laser polishing and laser nanoscale melting is determined to be on a microsecond time scale and around 100 ns, respectively. First, experimental results by one-step picosecond laser processing have shown that the divergence angles of LSFLs are 30°, 38°, and 24° for the round spots, elliptical spots suitable for laser induction, and elliptical spots for one-step laser polishing and induction, respectively. Therefore, laser polishing is an effective measure for improving the orientation consistency of LSFLs. Then, picosecond pulses using pulse trains with a sub-pulse number of three were applied to achieve surface polishing and form rudiments of LSFLs. Then, picosecond laser induction was performed to obtain LSFLs with high orientation consistency. As a result, the divergence angle of LSFLs was obtained as 13°. Additionally, picosecond nanoscale melting processing using pulse trains with a sub-pulse number of four was applied to expand the scope of the adjustable convexity ratio of LSFLs. The LSFLs with convex ratios from 0.3 to 0.87 were obtained by modifying the parameters both for laser induction and laser melting.
Acknowledgments
This paper is supported by the National Natural Science Foundation of China (NSFC) (51735010) and Key Research and Development Program of Shaanxi (Program No. 2021ZDLGY10-05).
Data availability statement
No new data were created or analysed in this study.
Supplementary data (0.3 MB PDF)
Supplementary data (0.8 MB DOCX)