
Abstract
Graphene oxide (GO) and reduced graphene oxide have outstanding qualities that could be exploited as reinforcement and antibacterial agents in a plethora of biomedical applications. In this contribution, it is reported the deployment of a polyacrylamide GO-hydrogel composite (GO@pAAm) which was photo-converted and structured by ultra-short laser irradiation using a direct laser writing (DLW) approach. The materials were characterized by Fourier Transform Infrared spectroscopy, scanning electron microscopy and confocal microscopy. The laser structure generates a multi-photo-induced effect: surface foaming and patterning, microdomains with enhanced selective water-swelling and effective GO photo-reduction. A first laser scan seems likely to induce the photo-reduction of GO and subsequent laser pulses trigger the structure/foaming. The photo-reduction of GO is evidenced by Raman spectroscopy by the relatively changing intensities of the D to G signals. Macroscopically by an increase in conductivity (decrease in sheet resistance from RS-GO@pAAm = 304 ± 20 kΩ sq−1 to RS-rGO@pAAm-DLW = 27 ± 8 kΩ sq−1) suggesting a reduction of the material measured by 4-Point-Probe.
Export citation and abstract BibTeX RIS

Original content from this work may be used under the terms of the Creative Commons Attribution 4.0 licence. Any further distribution of this work must maintain attribution to the author(s) and the title of the work, journal citation and DOI.
1. Introduction
Since its discovery by KS Novoselov and AK Geim in 2004 [1], graphene and its derivatives have become a trend topic material that has attracted the interest of the scientific community for its unique electronic, thermal, optical, and mechanical properties [2, 3]. In particular, graphene oxide (GO) and reduced graphene oxide (rGO) have exceptional qualities that could be used in a wide variety of biomedical applications as reinforcement and antibacterial agents, enhancing the generation of new functionalities in composite materials. For instance, Celiešiūtė et al developed chitosan-modified graphene substrates fused onto an ITO electrode surface electrochemically activated by IR-laser for applications in electrochemical sensors and biosensors [4]. In other research work, Wang et al prepared antibacterial poly-lactic acid/poly-urethane nanocomposites GO-reinforced that exhibited excellent broad-spectrum antibacterial activity due to the high specific surface area and inherent antibacterial properties of the films [5]. In additional studies, Khademhosseini and co-workers. fabricated gelatine/methacrylate decorated with rGO as hybrid hydrogels to be used as myocardial tissue scaffolds [6]. The authors reported that the incorporation of rGO into the hydrogel matrix improves the conductive and mechanical properties of the material. Besides, enhancing biological activities such as cell viability, proliferation, maturation, and others. The GO is easily dispersible in water and can be integrated into a polymeric hydrogel by in situ polymerization or absorption. However, it is unstable and poorly conductive. This drawback can be overcome by using reduced GO. The rGO could be produced from GO by thermal heating, chemical reduction or light irradiation [7]. Although several methodologies have been developed, large-scale production of rGO composites remains a challenge [8]. The route based on laser photo-induced reduction of GO has been a promising method to achieve large-scale production of rGO-based composites [9]. On the other hand, hydrogels are crosslinked polymeric 3D networks which are able to absorb large quantities of aqueous solutions [10]. Particularly, polyacrylamide hydrogels are one of the most studied systems due to their unique properties regarding ease of handling and their tuneable stiffness [11]. Subramani et al have shown that pAAm with 0.2 wt% of crosslinker (e.g. bisacrylamide) exhibits constant elastic modulus even six days after swelling and that they reach the swelling equilibrium very quickly [12]. Thus, pAAm hydrogels are materials that combine the soft properties of hydrogels with the stability and mechanical properties of conventional polymers.
The inclusion of nanomaterials within hydrogels has been explored to improve and combine synergistically the properties of both materials. In this regard, several smart materials have been developed including thermo mechanochemical [13], antibacterial materials [14, 15], and patterned-surface actuators [16], among others. Besides, the incorporation of a coloured nanomaterial improves the transparent hydrogel to absorb radiation, beneficial feature when materials are processed by laser systems [17]. In this contribution, an original work about the combination of foamed structuring and photo-reduction of a polyacrylamide rGO-hydrogel composite induced by ultra-short pulsed laser writing is reported (rGO@pAAm-DLW).
2. Experimental
2.1. Materials
Ethanol (EtOH, assay ≥ 96%), potassium hydroxide (KOH, assay ≥ 85%), acetone (assay ≥ 99.5%), hydrogen peroxide (H2O2, assay ≥ 30%, 100 vol.), sulfuric acid (H2SO4, assay ≥ 95%), acetonitrile (ACN, assay ≥ 99.5%), methacryloxypropyltrimethoxysilane (MPS, assay ≅ 100%), acrylamide (AAm, assay ≅ 99%), N, N'-methylene bisacrylamide (BIS, assay ≥ 99%), potassium persulfate (KPS, assay ≅ 100%), N, N, N', N'-tetramethylethylenediamine (TEMED, assay ≥ 99%), graphene oxide (GO, water dispersion, 4 mg ml−1) (Graphenea Inc. USA). All the materials were used as received without further purification. The solvent used was bidistilled water. All used reagents, except GO, were purchased from Sigma Aldrich or similar brands.
2.2. Preparation of GO@pAAm composites
The preparation of polyacrylamide GO hydrogel composites thick films (GO@pAAm) consisted of three main stages. In a first stage, the glass slides were vinyl-functionalized using a silane coupling agent. In a second stage, the pAAm hydrogel films were synthesized using the modified glass slides as substrate. In the final stage, the GO was incorporated into the hydrogel matrix by swelling the dried films in the GO water dispersion.
2.2.1. Stage I: glass slides vinyl-modification
Glass coverslips (22 × 22 mm, thickness 0.13–0.17 mm) were used as a support for the hydrogel thick films preparation. The coverslips were thoroughly washed and later modified with MPS to achieve covalent adhesion of the hydrogel film to the substrate. Next, the coverslips were washed with alcoholic potash (KOH 10 wt% in EtOH) in ultrasound bath for 30 min. Then they were gently rinsed with EtOH and acetone. Later, each side was dried under a N2 atmosphere. In a second stage, dried glass slides were immersed into boiling piranha solution (7:3 H2SO4:H2O2 mixture) for 1 h. After that, the clean glass slides were rinsed with large amounts of bidistilled water, EtOH, and ACN, respectively. In the final stage, the ultra-clean cover slides were vinyl-functionalized by placing them in a beaker containing the MPS solution (1 wt% in ACN) for 24 h at room temperature. Lastly, modified glass slides were placed in a homemade hermetic chamber (so-called synthesis chamber) and dried under N2 flow to carry out the synthesis of hydrogel films on top of them.
2.2.2. Stage II: hydrogel thick films synthesis
Hydrogel films were fabricated by free radical polymerization of the monomer acrylamide AAm using BIS as a crosslinking agent. In a typical experiment, a pre-polymer solution was prepared by dissolving AAm (0.5 M) and BIS (5 mM) using bidistilled water as solvent. The solution was bubbled with N2 for 10 min to eliminate the dissolved O2 and after that, it was immersed in an ice–water bath. Then, the polymerization was initiated by adding the redox initiator system consisting of KPS (4 mg ml−1) and TEMED (10 μl ml−1). Using a syringe, 200 ml of the pre-polymer solution were immediately placed on top of each modified glass slide inside the synthesis chamber. The reaction was carried out at room temperature for 1 h. Once the reaction was over, the hydrogel films were removed from the chamber and washed with bidistilled water for 3 d, renewing the water several times per day. Finally, the films were dried in a drying oven at 40 °C for 7.
2.2.3. Stage III: incorporation of GO
In order to obtain the GO@pAAm hydrogel composites, the dried pAAm hydrogel films were immersed in a GO water dispersion (0.4 wt%) for 24 h. After that, the composites were gently rinsed with bidistilled water and air-dried at room temperature for 72 h. Once dried, the composites were ready to be laser-treated.
2.3. Direct laser writing experiments
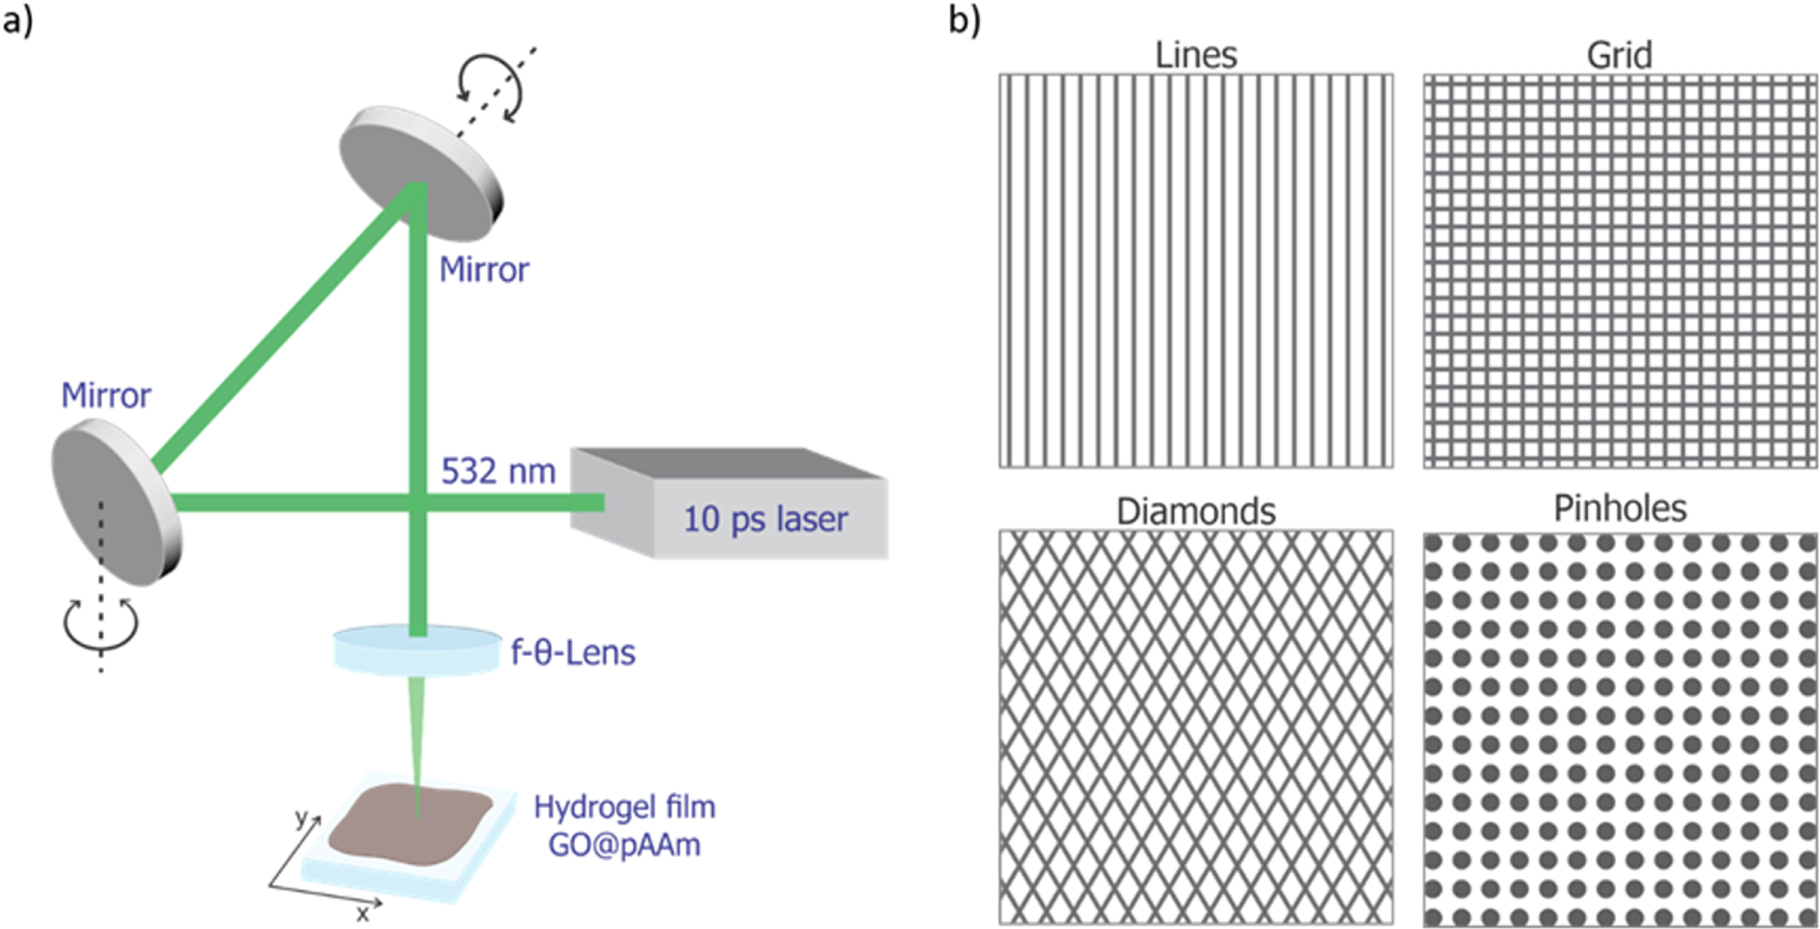
Direct laser writing (DLW) method was used for fabricating the micro/nanostructures and simultaneously induced the GO photo-reduction. The DLW system utilizes a galvanometric scanner module (Scanlab GmbH, Puchheim, Germany) equipped with a f-θ theta lens with a focal length of 100 mm and collimation unit for beam adjustment. This optical configuration produces a beam diameter (1/e2) of 35 μm with a Gaussian intensity distribution. An ultra-short pulsed solid-state laser source (Edgewave GmbH, Germany) is utilised, operating at 532 nm of laser wavelength, which provides a maximum output power of 30 W. The pulse duration was fixed at 10 ps and pulse repetition rate was settled at 10 kHz. It was selected at a relatively low frequency value to decrease possible overheating of the samples during the pattern formation process. According to the frequency, the processing speed was set to allow a steady and constant pulse-to-pulse lateral distance to form the pattern on the samples without overheating it. Thus, the laser beam was scanned along the surface of the sample with a constant speed of 1000 mm s−1. The structure periodicity, distance between the scanned lines, was fixed at 50 μm. The approximate ablation threshold fluence for the GO@pAAm films was 63 mJ cm−2. It was determined by linear regression of laser pulse diameter measurements at various fluences at the described working conditions.
The figure 1 shows a schematic drawing of the experimental configuration of the DLW galvanometric scanner (a) and the different geometries of the patterns (b) used.
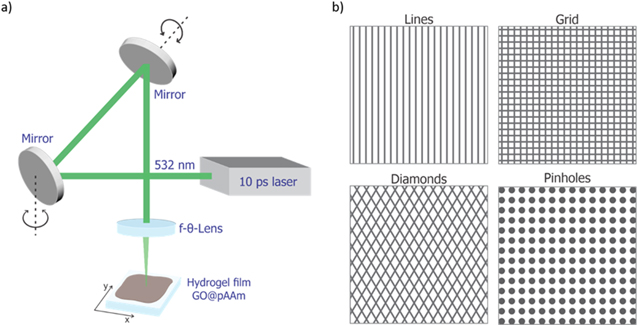
Figure 1. Schematic illustration of (a) the optical elements of the DLW setup used and (b) the laser writing patterns with different geometries.
Download figure:
Standard image High-resolution imageIn the case of the grid pattern, a first scan process was carried out in the vertical direction. Then, the direction of the scanned lines was rotated by 90° with respect to the initial structure. To fabricate the diamonds-like pattern, scanning direction of −30° and +30° were used.
2.4. Characterization
2.4.1. Characterization of GO@pAAm
In order to characterise the obtained hydrogel films Fourier Transform Infrared (FT-IR) spectroscopy were performed. A FT-IR spectrophotometer was used to measure the pAAm hydrogel, GO dispersion and the GO@pAAm. The FT-IR spectrum was acquired using KBr (potassium bromide) pellets in a wavenumber range of 600–4000 cm−1 with a resolution accuracy of 4 cm−1 using the spectrophotometer (Perkin Elmer Spectrum Two, USA) at room temperature. In addition, the equilibrium swelling (24 h-swelling) of the GO@pAAm films was examined by monitoring their swelling degree using confocal microscopy (CM, Sensofar S Neox, Spain). The collected topographic data were then analysed with SensoMap software (SensoMap 'Premium' Version 7, Sensofar S.A., Spain).
2.4.2. Characterization of rGO@pAAm-DLW
2.4.2.1. Topographical characterization
To analyse the produced structures, high-resolution surface images were captured with a Scanning Electron Microscope (SEM, Quattro ESEM, Thermo Fischer Scientific, Germany) at an accelerating voltage of 5 kV. To examine the topography of laser-induced foaming phenomena CM images were taken of the dried and 24 h-swollen rGO@pAAm-DLW films.
2.4.2.2. GO@pAAm-DLW photoreduction characterization
To examine the photo-reductive effect of laser treatment, resonance Raman spectroscopy microscopy was conducted using a Raman spectrometer (S&I Monovista CRS+, Germany). In addition, at the monolithic/macroscopic level sheet resistance measurements were performed using the 4-Point Probe electrometer (Sourcemeter 2450, Keithley, USA), since the conductivity of rGO is higher than that of GO. In this manner, it was possible to indirectly evaluate the reduction of GO [18].
3. Results and discussions
3.1. pAAm hydrogels characterization
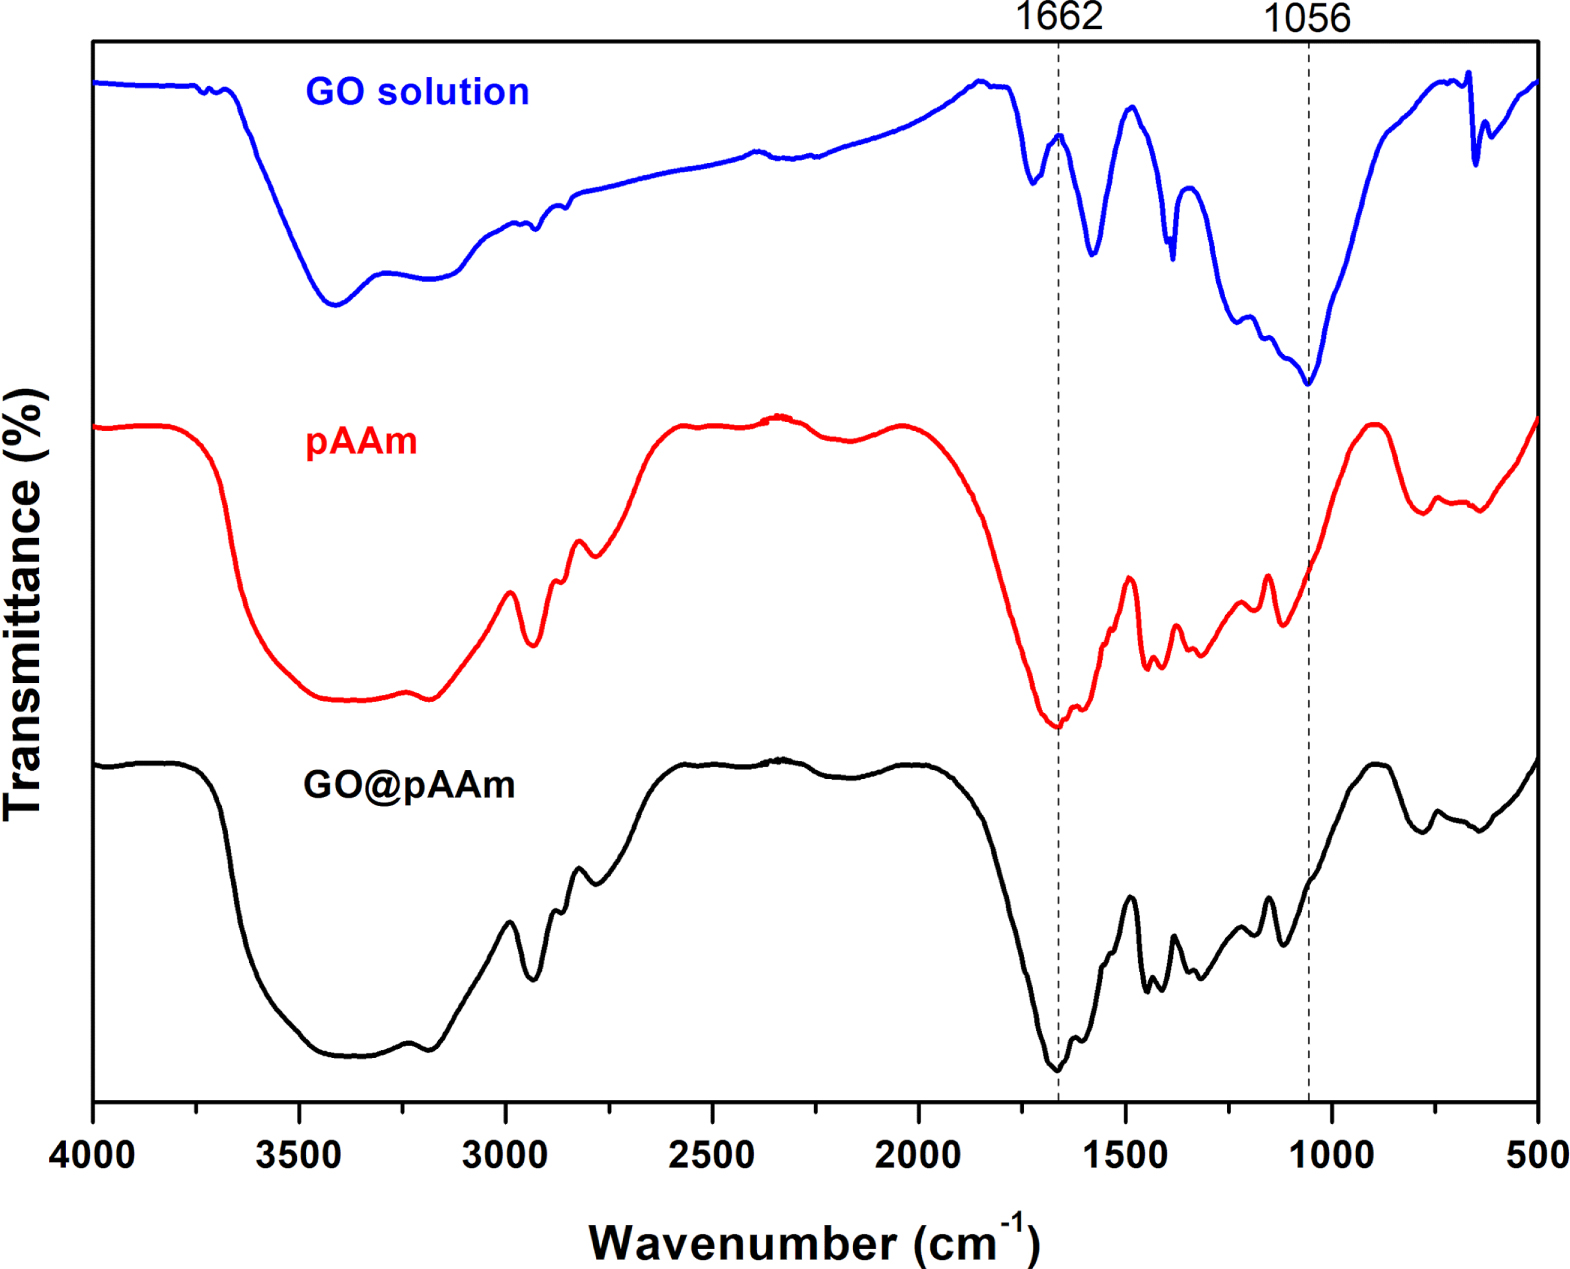
Composite hydrogels were obtained by adsorption of GO into pAAm hydrogel thin films. The incorporation of the GO into the hydrogel network can be clearly seen by naked eye due to the dark colour of the nanomaterial (see figure S-1 in the supplementary information for more details). Moreover, the nanocomposites were characterized by FT-IR. In figure 2 the characteristics band of the pristine hydrogel are observed at ∼1700 cm−1 corresponding to the C=O group. Also, the aliphatic C–H stretching band at 2925 cm−1 and a broad N–H amine band in the range 3100–3500 cm−1 are depicted [14]. For GO spectrum the typical band at ∼1100 cm−1 is distinguished. While for the composite material all bands are presented confirming the incorporation of the GO into the network [6].
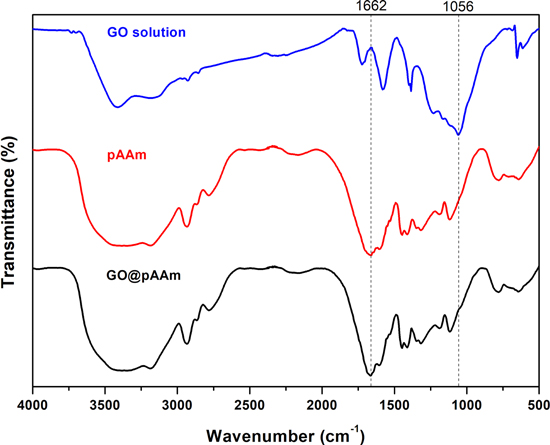
Figure 2. FT-IR spectra of commercial GO (blue line), pAAm hydrogel (red line) and GO@pAAm (black line).
Download figure:
Standard image High-resolution imageAs the hydrogel was a film fixed to a glass (in the xy-plane) it was feasible to monitor the degree of swelling as a function of the change in average height of the material in the z-direction (z). The swelling percentage was calculated by using the equation (1):

where: V correspond to the volume and z is the height of the film given by the CM profile images, the subscripts indicate the dry (d) or swollen (s) state of the hydrogel respectively.
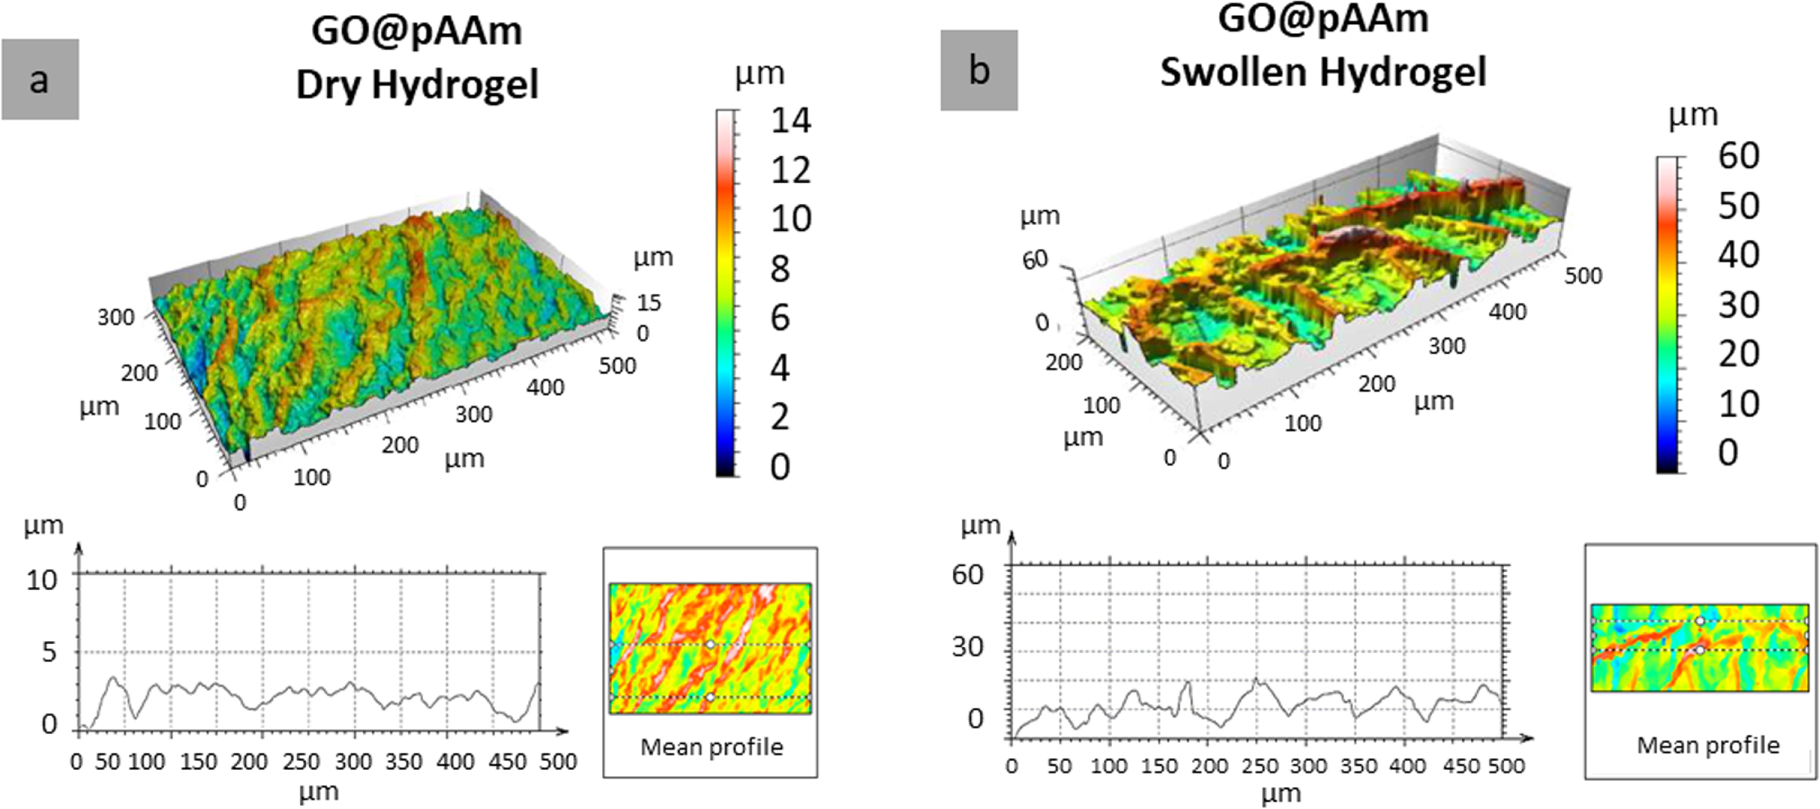
Thus, figure 3 shows the hydrogel dried (a) and swollen to equilibrium (b). The percentage of swelling as a function of the volume of water incorporated was 415 ± 55%. Although this confirms its characteristics as a hydrogel (% S >100% [19]), the low swelling percentage is clearly due to the glass attachment of the polymer.
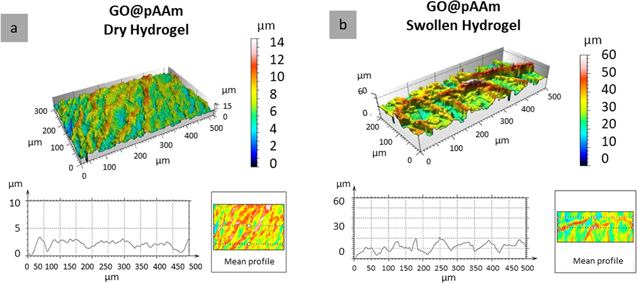
Figure 3. CM images of GO@pAAm (a) dry and (b) 24 h swollen hydrogels and corresponding surface profiles (bottom of each figure).
Download figure:
Standard image High-resolution image3.2. rGO@pAAm-DLW composites characterization
As a first insight, the patterning of rGO@pAAm-DLW films was screening at increasing impinging scan repetitions. As it can be seen in the SEM figures 4(a)–(b), well-defined periodic lines were produced in GO@pAAm samples after 3 scans (resulting in Φcum = 105 mJ cm−2). The ps-laser irradiation locally removes the absorbed GO in the hydrogel. The locally generated temperature induces decomposition of the GO into rGO in the immediate vicinity of the irradiated zone. The effect is presumed to be caused by the presence of oxygenated groups at the surface of GO immersed in the highly cross-linked structure of the porous hydrogel matrix. This leads to the production of low molecular weight gaseous species (O2, CO2, CO, H2). Hence, internal bubbles, that may or may not reach the surface, create this bulging effect. This phenomenon has already been reported for nanosecond lasers in other polymers by applying Direct Laser Interference Patterning (DLIP) to co-polymers where some chemical groups decompose forming bubbles. At lower fluences, swelling of the polymer occur with formation of smooth protruding shapes. At higher fluences, the bubbles explode and craters are formed [20]. Since no record exists on the fast photoablation process, it is not unlikely for the same swelling to happen in other polymers but the minimum fluence used already produce bubble exploding [21]. However, to the best of our knowledge, this is the first time that this effect has been reported for pAAm hydrogel-GO composites. Lazare et al also pointed out the difficulty in discerning between laser foaming and laser ablation phenomena, driven by photo-chemical or photo-thermal mechanisms, on the surface of polymers, due to their simultaneous occurrence and their relative importance with increasing laser fluence [22]. In this regard, Ränke et al combined ps-laser interference patterning and polygon scanning technologies to produce linear micropatterns in doped-black poly-styrene foils [23]. The authors reported that these patterns were induced by local expansion of the material at low cumulative fluences, and by a combination of ablation and foaming at higher fluences. For higher cumulative laser fluences (Φcum = 315 mJ cm−2) the treated areas showed a more pronounced modification of the material surface, depict in figures 4(d)–(e). Instead, the intricate structure formed appears to be due to a combination of foaming and thermal stress processes triggering the overall foaming of the hydrogel—including in areas where the GO has been removed.
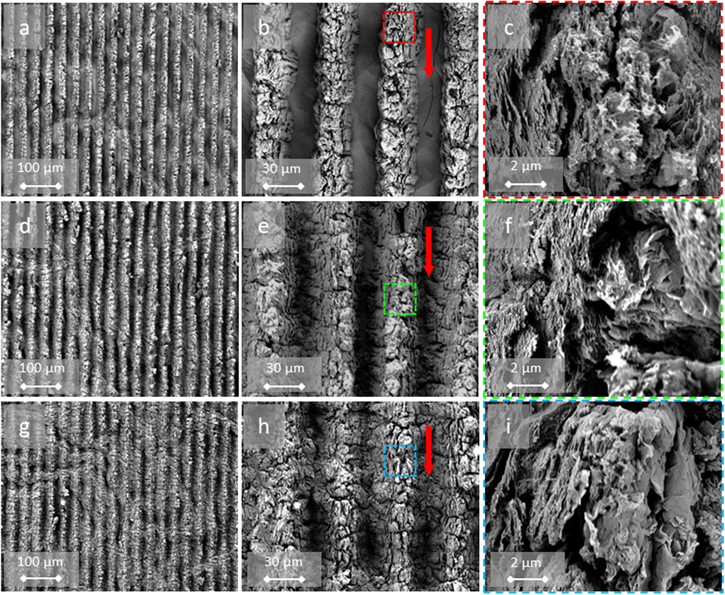
Figure 4. SEM images of GO@pAAm DLW-patterned at (a)–(c) 105 mJ cm−2, (d)–(f) 315 mJ cm−2, (g)–(i) 630 mJ cm−2 cumulated fluence. Mgf.: 100 × (left), 500 × (middle), 1k × (right). The red arrow in the middle column indicates scan direction. The colour code insert in the middle column indicates the amplified area in the images in the right column.
Download figure:
Standard image High-resolution imageIn all experiments, the process parameters were selected so that the laser irradiation did not perforate the composite and did not detach from the glass, illustrated in figure S-1 Following this trend, under conditions well above the threshold fluence—when the number of incident pulses or the accumulated fluence is significantly high (Φcum = 630 mJ cm−2)—regardless of whether an area is irradiated by the laser, the complete surface is prone to foaming, as shown in figures 4(g)–(h). It should be keep in mind that GO converts into rGO upon heating and irradiation [24]. Consequently, it is likely that the first pulse has enough energy to produce rGO. The following pulses will produce more structuring since rGO has a larger absorption coefficient than GO [7]. As a result, the DLW-periodic structures blurred partially. For the sake of comprehension, an image of the structured-unstructured edge area of the material and its corresponding topographical profile are displayed in figure 5. Moreover, additional confocal microscopy images contrasting the foaming in GO@pAAm and the ablation phenomenon in a stainless steel model material are shown in figure S-2.
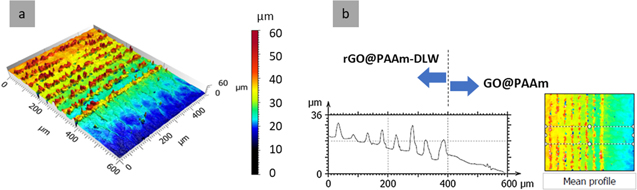
Figure 5. (a) CM image of rGO@pAAm-DLW showing the border of laser treatment and (b) corresponding surface profile, where the dash line indicate the border.
Download figure:
Standard image High-resolution imageThe SEM images of the irradiated areas at higher magnification, illustrated in figures 4(c), (f) and (i), revealed an intricate and formless porous nanostructure in which GO nanosheets can be arbitrarily distinguished (see, for example, figure 4(i)). These structures lead to significant surface area enhancement (non-quantified) compared to the non-porous surface of the pristine hydrogels.
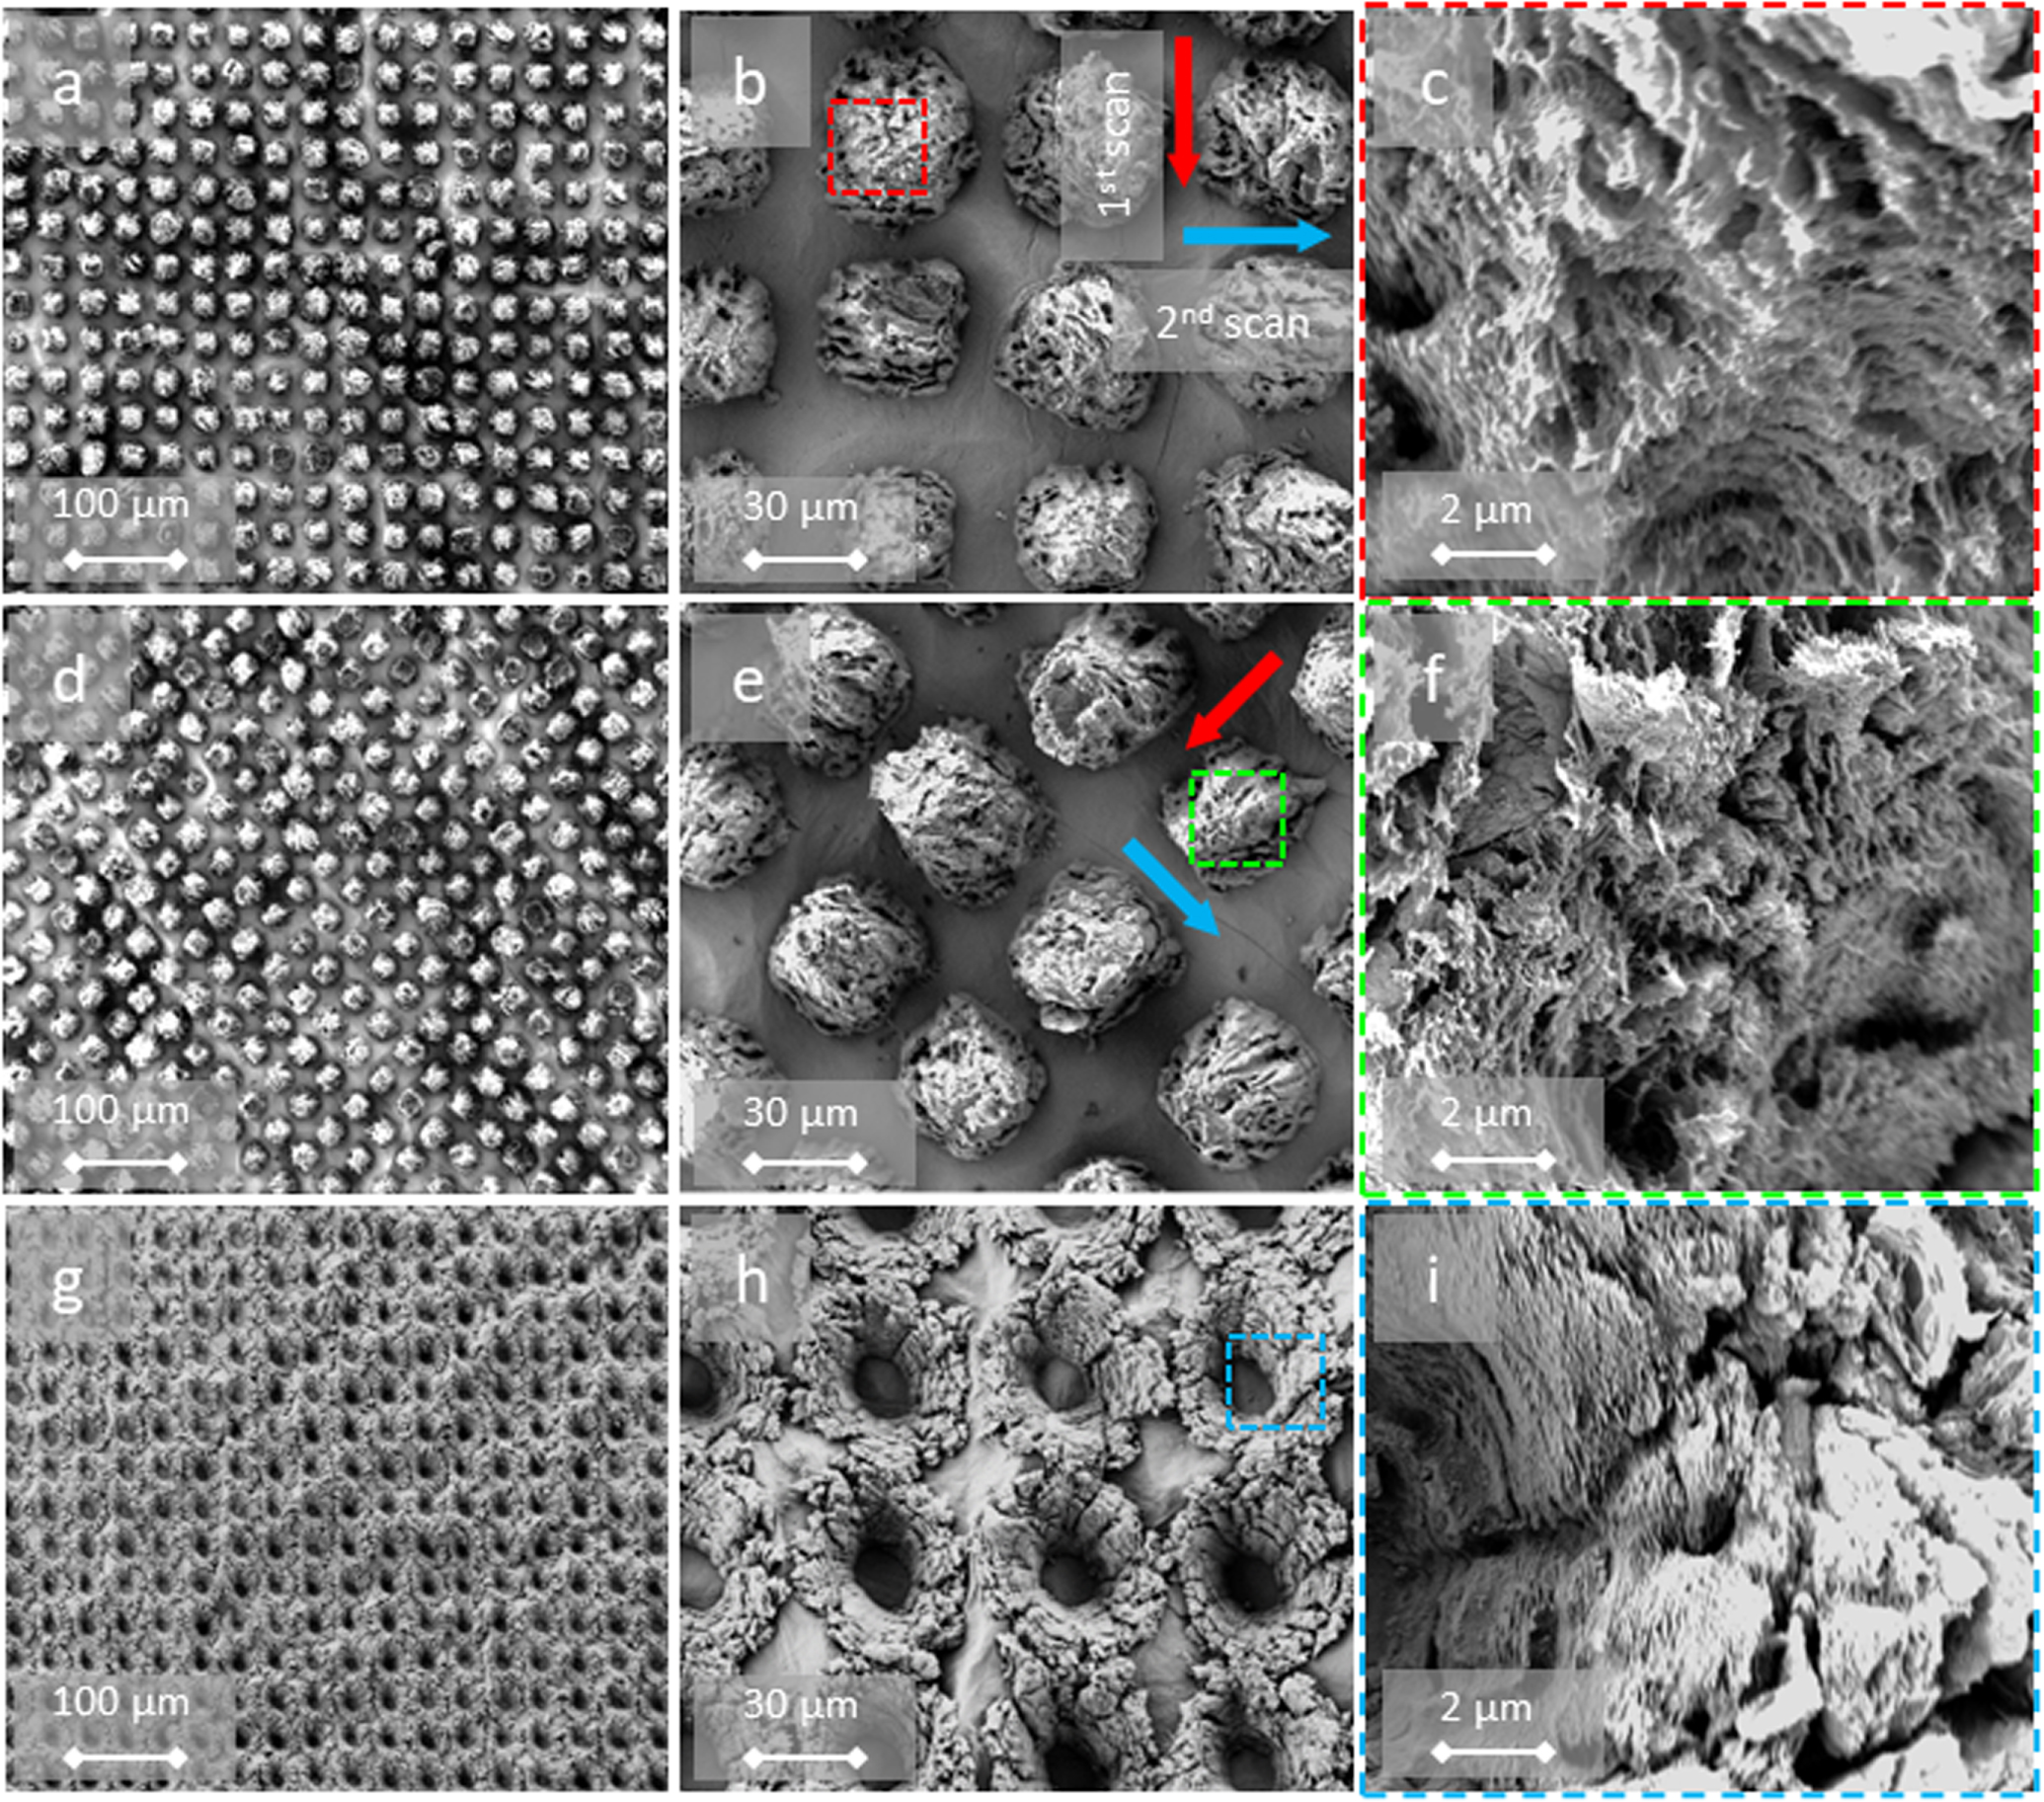
In a second series of DLW experiments (Φcum = 305 mJ cm−2, 1000 m s−1, 10 ps, 10 kHz and 532 nm) and in order to highlight the flexibility of the technique, several pattern geometries were produced. As shown in the SEM images in figure 6, not only line/slot patterns were acquired straightforwardly but also (a) grids, (b) diamonds and (c) pinholes lattices. In figures 6(b), (e), (h) the arrows indicate the direction of each laser-scan step. In all the geometries examined, the laser foaming effect is observed. Additionally, similar porous nanostructures are observed in the microscopies of the areas irradiated with the laser at higher magnification.

Figure 6. SEM images of GO@pAAm DLW-patterned (a)–(c) grid-like, (b)–(f) diamond-like, (g)–(i) pinhole-like geometries. Mgf.: 100 × (left), 500 × (middle), 1k × (right). The red and blue arrow in the middle column scan direction. The color code insert in the middle column indicates the amplified area in the images in the right column. Φcum = 315 mJ cm−2.
Download figure:
Standard image High-resolution imageAs shown in CM of figure 7(a), the dry GO@pAAm-315 mJ cm−2 hydrogel presents structures with an average depth of 3 μm, while for the 24 h swollen hydrogel the structure reaches heights of up to 7 μm. Due to the covalent linkage of the GO@pAAm film to the glass, the osmotic swelling at the film/substrate interface is restricted. Thus, showing an anisotropic swelling, preferentially in the direction normal to the surface [25]. The characteristics of the material, which is chemically attached to the glass substrate, in combination with the DLW process reflect in the fact enables that the patterned not only remain after swelling, but also expand. This finding is consistent with the small degree of swelling previously reported in figure 3. In contrast, previous studies on dye-doped pNIPAm hydrogels structured by DLIP with nanosecond pulses reported an opposite effect [26]. This behaviour can be attributed to a blending effect of the laser-foaming and the rupture of polymeric chains provoking a decreased molecular weight of the polymer [27]. This causes the hydrogel become less cross-linked, e.g. 'softer' and prompt to higher swelling ratios. These findings are supported by the work of Xiong et al [28], in which the chain scission at high temperatures of linear pAAm as well as the rupture of the cross-linker of pAAm hydrogels is shown. At the same time, the partial hydrolysis of acrylamide groups to carboxylic groups might occurred, rendering the hydrogel more hydrophilic and increasing the swelling ratio.

Figure 7. CM-3D images (top) and corresponding average profiles (bottom) of GO@pAAm-DLW patterned (a) dry-state and (b) 24 h water- swollen hydrogel. Φcum = 305 mJ cm−2.
Download figure:
Standard image High-resolution imageFinally, resonance Raman spectroscopy was conducted with laser excitation by a single frequency 561 nm diode laser and a scan range of 500–2000 cm−1. The GO@pAAm samples were measured at pristine state as a reference and processed at Φcum = 305 and 630 mJ cm−2 with line-like structures. The analysis was focused on measuring the variations in relative peak intensity of the D-band and G-band, which are characteristics of GO and rGO [29]. All spectra, depicted overlayed in figure 8, contain the D-band (∼1350 cm−1), which points the presence of structural defects and the G-band (∼1588 cm−1) associated with the graphitic crystalline structure. In the pristine material, the D- and G-band have a similar intensity. Instead, after laser treatment, the intensity of the D-band increased with relation to the G-band. Previous work suggests that the ratio of intensities between the D-band and the G-band (I(D)/I(G) ratio) is inversely proportional to the effective crystallite size in the graphite plane direction [30]. Hence, the I(D)/I(G) ratio is relates to sp3/sp2 carbon ratio and can be used as an indirect method to determine the GO reduction. An increase in G-band intensity with respect to D-band intensity, as observed when comparing the spectra of GO@pAAm and rGO@pAAm-DLW at 305 mJ cm−2, suggests a slight but not negligible laser-induced photo-reduction. The values associated with the Raman shift and intensity of these peaks for each case are summarised in table 1. Moreover, irradiation with high fluence (630 mJ cm−2) seems to degrade the GO and polymer matrix as evidenced by significant changes in the Raman spectra. The solid state bands of GO/rGO (G and D bands) decrease in intensity and several new vibrational bands appears. The bands at 1248 cm−1 (C–H bending [30]) and 1587 cm−1 (amide I band [31]) has been observed in the acrylamide monomer. Its occurrence suggest the occurrence of heat induced depolymerization/scission producing AAm end groups. The band at 1347 cm−1 has previously been observed in polyacrylic acid [32], suggesting heat promoted hydrolysis of the amide units to produce carboxylic acid. In result, at higher laser irradiation fluence (Φcum = 630 mJ cm−2) the D and G bands decrease in intensity and other bands, normally inactive by Raman, were generated. These were possibly activated due to the photon confinement effect induced by the generated defects [33].

Figure 8. Resonance Raman spectroscopy of GO@pAAm pristine (black line) and line-like DLW patterned at Φcum = 305 mJ cm−2 (blue line) and Φcum = 630 mJ cm−2 (red line). λ Raman = 561 nm.
Download figure:
Standard image High-resolution image
Table 1. Resonance Raman spectroscopy signals of pristine GO@pAAm and line-like DLW patterned GO@pAAm at Φcum = 305 mJ cm−2 and Φcum = 630 mJ cm−2. λRaman = 561 nm.
| D-band | G-band | ||||
|---|---|---|---|---|---|
| Raman shift (cm−1) | Intensity % | Raman shift (cm−1) | Intensity % | I(D)/I(G) | |
| GO@pAAm pristine | 1338 | 0.99 | 1581 | 0.89 | 1.112 |
| rGO@pAAm-DLW 305 mJ cm−2 | 1338 | 0.99 | 1580 | 0.97 | 1.025 |
| rGO@pAAm-DLW 630 mJ cm−2 | 1316 | 0.51 | 1590 | 0.52 | 1.003 |
Moreover, the observed foaming structure is consistent with the apparent photo-reduction of GO. Since at laser processing temperatures, most of the carboxyl, hydroxyl, and epoxide groups can be removed from GO. However, upon leaving the structure, these groups create structural topological defects due to the formation of CO and CO2 gases during the reduction process.
The conductivity of the GO@pAAm and rGO@pAAm-DLW with line-like structures processed at Φcum = 305 mJ cm−2dry films was measured by a 4-Point Probe system using an electrometer (Sourcemeter 2450, Keithley, USA). The dimension of each sample was 1 × 1 cm2. For statistical reasons, a total of 3 measurements were made for each sample. The measurements were conducted longitudinally to the DLW-strips. The current used was set at 1 μA and a correction factor of 0.75 was applied to compensate for the current path limitation caused by the proximity of the boundaries following a standard proceedings [34]. The sheet resistance (RS) was obtained by using the formula RS = R· 4.5 · 0.75. For the laser-processed films, an increase in Rs (decrease in conductivity) was expected due to the removal of GO material but a more significant decrease in Rs due to photo-reduction of GO. Thus, the value for the processed films resulted RS-GO@pAAm = 304 ± 20 kΩ sq−1 and RS-rGO@pAAm-DLW = 27 ± 8 kΩ sq−1 suggesting some reduction in the material by the action of the laser. For the pristine hydrogels (without GO) sheet resistance in of the order of magnitude close to the detection limit of the equipment (∼MΩ sq−1) was registered as they are a dielectric material. The results obtained are in trend with those reported by the manufacturer of the liquid GO dispersion [18] Also, they are in the same order of magnitude as the ones reported by other authors in similar GO-composite materials [35].
4. Conclusions
In summary, this study reports the deployment of an original GO-based structured soft material photo-converted by ps-laser irradiation. The structure through DLW generates a multi-photo-induced effect: surface foaming and patterning, microdomains with selective water-swelling, and effective photo-reduction of GO. It seems likely that a first laser scan induces GO photo-reduction and that subsequent laser pulses trigger structure/foaming. The photo-reduction of GO is evidenced by Raman spectroscopy by the relative change in the intensities of the D and G signals. Also, macroscopically by an increase in the conductivity (decrease in sheet resistance) of the material measured by 4-Point-Probe. Further studies regarding the expenditure of this material for biomedical applications such as soft tissue scaffolds and burn dressings are being conducted.
Data availability statement
All data that support the findings of this study are included within the article (and any supplementary files).
Declaration of competing interest
The authors declare that they have no known competing financial interests or personal relationships that could have appeared to influence the work reported in this paper.
Supplementary data (2 MB TIF)
Supplementary data (0.3 MB PDF)