

Abstract
Plasmonic bimetallic Ag-Cu nanodendrites were synthesized by an electrodeposition process and their potential as surface-enhanced Raman scattering (SERS) substrates was studied. We demonstrated a facile and efficient way for the preparation of highly sensitive SERS substrates. The electrodeposition time was an important parameter in the formation of Ag-Cu dendrites onto the Al sheet. The Ag-Cu dendrites showed an excellent response detecting Rhodamine 6 G at ultra-low concentrations such as 1 × 10⁻¹⁵ mol l−1. This Ag-Cu substrate possesses an excellent SERS activity and it could be used for the detection of molecules at trace level. This electrodeposition process could be extended for the fabrication of other plasmonic bimetallic dendrites.
Export citation and abstract BibTeX RIS
1. Introduction
Surface-enhanced Raman scattering (SERS) is an analytical technique that has gained great interest in the scientific community due to the ease and quick detection of analytes at low concentrations and even at molecular levels [1]. This is of great importance when detecting species which are highly polluting or harmful for living beings, even at trace levels, and which may be of a chemical [2] or biological nature [3]. Different nanomaterials are being used as SERS substrates, and those with anisotropies, roughness, peaks, edges, or angles have been shown to have a better response by increasing the Raman signal [4]. The increase is originated by the fluctuations of the electromagnetic field which have a greater intensity in the nanostructure defects, giving rise to the localized surface plasmon resonance (LSPR). This effect has been called the hot-spot effect. Thus, hot spots are caused by certain areas in the nanostructure capable of increasing Raman signals up to 1015 orders of magnitude [5]. SERS substrates of Ag, Au and Cu have been successfully tested in the detection of analytes at low concentrations [6–10]. Dendrites are hierarchical superstructures that have numerous branches with a high number of corners, edges, and staggered atoms that promote the generation of various modes of LSPR, making them an excellent option to be used as SERS substrates. These types of structures are widely used in photocatalysis applications [3], sensors [4], electrocatalysts [5], photothermal therapy [6], heterogenous catalysis [7] and as SERS substrates [11] due to the large surface area and effectiveness in those applications. Bimetallic dendrites are usually obtained from galvanic replacement due to the ease of the technique, however, sometimes long times or strong conditions are necessary for their formation [12]. Thus, Ag-Cu bimetallic dendrites with application in SERS have been obtained by Sun et al [13]., which were able to detect Rhodamine 6 G (R6G) at a concentration of 10–3 mol l−1. The most efficient Ag-Cu dendrite obtained by galvanic replacement was achieved by Hu et al [14], with a R6G detection limit of 10–13 mol l−1. However, the concentration of the metallic precursors and the reaction time employed for the formation of the dendrites were usually higher than those used in the present work. Electrodeposition offers advantages compared to other methods such as short preparation time, one-step process and great reproducibility [15]. Ag-Cu dendrites obtained with electrochemical methods have been demonstrated to be good SERS substrates. Li et al [16]. have shown that Ag-Cu dendrites obtained by an electrodeposition process onto a graphene substrate were capable to detect R6G at concentration as low as 10–8 mol l−1.
Therefore, in this investigation, the electrodeposition of Ag-Cu dendrites onto aluminum was studied and its usefulness as bidimensional SERS substrates was demonstrated. The evaluation of the analytical enhancement factor (AEF) and the limit of detection (LOD) was established.
2. Materials and methods
2.1. Materials and reagents
Silver nitrate (AgNO3 99%) and copper nitrate (Cu(NO3)2 · 2H2O 99%) were obtained from Sigma-Aldrich and used as received. Milli-Q water with a resistivity of 18.2 MΩ · cm was used for the preparation of all solutions. A custom-made cell was used for the electrodeposition experiments. A piece of 2.5 cm2 of 5052-H32 aluminum alloy was used as a substrate (cathode) for the electrodeposits; electrolytic Cu was used as anode.
2.2. Electrodeposition
For electrodeposition, a Microstar DuPr10-3-6 was used as a power supply. Electrodeposition was performed in a 10 ml galvanic cell arrangement with 1 cm of distance between anode and cathode, at ambient temperature under different potential and deposition time. Before electrodeposition, the aluminum substrates were washed with deionized water and ethanol. The bimetallic dendrites were obtained using a constant potential of 5 V, for 10 s, 30 s and 60 s, in an electrolyte solution composed of a mixture of the precursors (AgNO3 + Cu(NO3)2) at a concentration of 10 × 10−3 mol l−1 each in a ratio of 1:1. After the electrodeposition process the substrates were dried in an oven at 50 °C for 30 min.
2.3. Characterization techniques
The UV–Vis absorption spectrum was recorded on an Optizen Pop spectrophotometer using a 1 cm optical path quartz cuvette.
The spectrum was acquired from a dispersion of Ag-Cu material detached from the aluminum substrate in ethanol. Scanning electron microscopy (SEM), Scanning transmission electron microscopy (STEM), and energy-dispersive x-ray (EDX) spectroscopy were carried out on a FEI Nova NanoSEM 200 microscope. Grazing incidence x-ray diffraction (GIXRD) patterns were obtained in a PANalytical Empyrean Cu-Kα (λ = 0.1542 nm) diffractometer. An Inductively coupled plasma emission spectrometer (ICP-OES) Thermo Electron-ICAP 6500 was used for quantification of metal ions in the solutions. X-ray photoelectron spectroscopy (XPS) was carried out on a Thermo Fisher Scientific ESCALAB 250Xi XPS with an Al-Kα (1486.7 eV) x-ray source. Raman spectroscopy measurements were performed using a Horiba LabRAM HR Evolution spectroscopic microscope, using a magnification of 50x long working distance objective, with a wavelength laser 633 nm at 25% of power (100% = 17 mW), 3 accumulations and integration time of 12 s.
2.3.1. Angle estimation.
The angle between branches and arms was estimated using ImageJ software which has a tool that allows angle estimation. An explanation of this procedure is included in the ESI in figure S2 (https://stacks.iop.org/NANO/31/465605/mmedia).
2.4. SERS detection
The aluminum substrates with the electrodeposited bimetallic dendrites were used as bidimensional SERS substrates. For the acquisition of Raman and SERS spectra, the substrates were submerged in 500 µl of R6G solutions at different concentrations from 10–6 mol l−1 to 10–15 mol l−1 for 3 h. The SERS acquisition was performed with the substrate immersed in the solution of R6G (for detailed information refer to the ESI). SERS spectra were obtained with laser wavelenght of 633 nm operating at 1.76 mW. A mapping of 10 points was made onto Al substrate with the Ag-Cu dendrites for every concentration tested and the average spectrum was reported.
3. Results and discussion
3.1. Ag-Cu dendrites synthesis
Electrodeposition of silver nanodendrites onto Al sheets was achieved in our group with the same experimental apparatus detailed in the experimental section obtaining excellent results in SERS application [15]. In this investigation the co-electrodeposition of bimetallic nanodendrites was studied, this method presents several advantages such as no need for the use of seeds, reducing agents, or another molecule such a stabilizer that could interfere with the SERS application; also, no post-treatment or washes were necessary. The electrodeposits were obtained using an electrolytic Cu foil as anode and Al as the cathode. The bimetallic dendrites were obtained under a constant potential of 5 V at different times 10 s, 20 s, 30 s, and 60 s (figure S3). 4 V at 20 s (figure S4) was also tested in order to verify the presence of dendrites. However, the electrodeposits obtained were mainly self-assembled nanoparticles in a dendrite-like arrangement. It was found that the best conditions for obtaining dendrites were at 5 V and 30 s. Two different Ag: Cu atomic ratios to obtain nanodendrites were tested: 1:1 and 1:3. When an atomic ratio of 1:1 was tested nanodendrites are obtained, however, with an atomic ratio of 1:3, mounds of interconnected nanoparticles are present (see figure S5). The electrodeposition of Ag-Cu with 5 V and 30 s was selected as the optimal condition for the formation of the nanodendritic structure of Ag-Cu with an atomic ratio of 1:1. In addition, this electrodeposition process compared with the Ag-Cu nanodendrites obtained by Li et al [16] presents several advantages such as no incubation time needed, deposition time lower than 1 min, the aluminum substrate is affordable and cheaper than graphene, and also no signals from our substrate interfere in the spectrum of the analyte. The SERS behavior shows also greater LOD taking into account that the R6G does not chemisorb onto the surface as 4-mercaptobenzoic acid does.
3.2. Grazing incidence x-ray diffraction (GIXRD) and energy dispersive x-ray analysis (EDX)
The composition of the dendrites was analyzed by GIXRD, EDX, and quantification of Cu2+ and Ag+ from the feed solution before and after the electrodeposition. GIXRD patterns of bimetallic Ag-Cu nanodendrites are shown in figure 1 where peaks of high intensity attributed to face centered cubic Ag crystal ({111}, {200}, {220}, and {311}, JCPDS 01-077-6577), and from face centered cubic Cu crystal ({111} and {200}, JCPDS 01-080-5762) were assigned, which confirmed the crystalline phases of Ag and Cu present in the structure. Also, peaks from CuO (JCPDS 04-007-0518) were found, due to the oxidation of Cu possibly during and after the electrodeposition of the dendrites. It should be noted that the most intense peaks are the sum of the main reflections for silver, aluminum, and copper (refer figure S6). The presence of diffraction peaks associated with Cu and Ag, as well as diffraction peaks associated with an Ag0.5Cu0.5 alloy phase suggest that Ag and Cu are in a segregated arrangement [15, 17, 18] in coexistance with alloyed Ag0.5Cu0.5 nanozones. The average crystallite size was estimated by using the Scherrer equation on the {220}, {220} and {311} planes of Cu and Ag, the estimated size was 25.01 ± 1.06 nm. The EDX analysis (figure 2) showed that the dendrites are composed of Ag and Cu with an atomic ratio of 1:1 determined to be 47.58% and 52.42%, respectively. The above was confirmed by the ICP-OES analysis where the feed solution was 10 × 10−3 mol l−1 for both precursors before the process, and after the electrodeposition the concentration of the Ag+ and Cu2+ were 5.8 × 10⁻³ and 5.7 × 10⁻³ mol l−1, respectively. The above data also indicate that a concentration of 6 × 10⁻³ mol l−1 is enough for obtaining Ag-Cu nanodendrites under this condition.

Figure 1. GIXRD patterns of Ag-Cu nanodendrites obtained at 5 V and 30 s.
Download figure:
Standard image High-resolution image
Figure 2. EDX analysis of the Ag-Cu bimetallic nanodendrite, (a) composition profile through a line located on a secondary branch of the nanodendrite and (b) EDX spectrum indicating the composition of Ag and Cu (atomic ratio 1:1).
Download figure:
Standard image High-resolution imageFor a better understanding of the arrangement of Ag and Cu in the structure, an EDX profile was obtained in two regions of approximately 50 nm and 100 nm. For such analysis, the dendrites were mechanically detached from the aluminum substrate and were suspended in isopropanol and then deposited on Au grids for STEM analysis.
Thus, micrographs were obtained in STEM mode where the dendritic structures are seen in greater detail. Figures 3(a) and (b) correspond to 30 000 and 200 000 magnifications respectively, where dendritic nanostructures were observed, which have good control of shape, size and without agglomerates. Figure 3(b) shows two dotted white lines where the sites correspond to the composition scan lines made on a secondary branch of the dendrites. Figure 4 shows a graph with the second derivative of the Ag and Cu concentration profiles to verify whether the signals have maxima and minima in the same positions or not. It was found that, when analyzing a dendrite, most zones show signals of both Ag and Cu. However, in some regions the presence of Ag can be found, but Cu signal is absent and vice versa (indicated as blue arrows in the image). Therefore, the data obtained suggests that the dendrites are made up of (nearly overlapping) mixed Ag and Cu regions, but in addition there are zones in their ramifications formed by segregated areas of either Ag or Cu.

Figure 3. STEM micrographs of Ag-Cu nanodendrites. (a) 30 000X, and (b) 200 000 X where the dotted white scan lines indicate EDX line mapping analysis corresponding to figure 4
Download figure:
Standard image High-resolution image
Figure 4. Second derivative of the scanned lines obtained with EDX for Ag-Cu nanodendrites. The numbers 1 and 2 are referred to the dotted lines in figure 4(b).
Download figure:
Standard image High-resolution imageFigure 5 shows the SEM micrograph of the Ag-Cu nanodendrite obtained with a constant voltage of 5 V and 30 s. It is observed that this bimetallic nanodendrite has a star-shape with 6 axes with 1.5 μm average length. Also, the structure is formed by several assembled nanoparticles (average size 23.9 ± 4.1 nm) which is in agreement to the crystallite size obtained by GIXRD. The angle between the primary stems is ∼ 60°, whereas the secondary and tertiary branches angle value are around 50–55° and it persists constantly for several nanodendrites.

Figure 5. SEM micrographs of Ag-Cu nanodendrites at different magnifications.
Download figure:
Standard image High-resolution imageThe presence of nanoparticles suggests that the first step for nanodendrite formation is the nucleation and growth of nanoparticles followed by their subsequent self-assembly to form the different arms and branches. Due to the high concentration of small nanoparticles and the great mobility they possess, they start to aggregate and self-assemble into a hierarchical superstructure (nanodendrite) to reduce their surface free energy. Nanodendrite formation is governed by the effect of diffusion-limited aggregation, which agrees with the same observations by other authors [19–21].
In addition to the above, the potential applied for the formation of nanodendrites is crucial since this type of structure is formed under non-equilibrium conditions, so the potential used must be greater than the standard reduction potential of both metal ions (Ag 0.9 V vs NHE and Cu 0.38 V vs NHE). This overpotential is used as a driving force for the reduction of metal ions but also for the formation of different morphologies in the deposits. Electrodeposition is a process that also depends on time, longer times benefits crystal growth. In this case the Al substrate provides adequate characteristics for the formation of nanodendrites in just 30 s with a constant overpotential of 5 V.
3.3. UV–Vis spectroscopy
The spectrum of bimetallic Ag-Cu nanodendrites is shown in figure 6. The spectrum shows many absorption modes; in particular, the band at 278 nm is attributed to the presence of small spherical nanoparticles with average sizes around 20–30 nm [19], which is in accordance with the crystallite size obtained from GIXRD data and SEM. In this case, this corresponds to Ag-Cu nanoparticles, which was confirmed by EDX analysis (figure S7). This type of band has been atributted to a certain arrangement of aggregated nanoparticles, as shown by Jiang et al [22]. It was reported that the hybrid quadrupolar resonance can indeed occur in the short wavelength region, when the plasmonic silver nanoparticles are coupled due to a certain nanoparticle aggregation (as shown in figure S8). Thus, it can be inferred that this resonance mode is originated from the arrangement of Ag-Cu nanoparticles decorating the nanodendrite structure. Other bands with maximum absorption at 472 nm and 569 nm are characteristic values for LSPR of Ag-Cu nanomaterials [23]. Dendrites are hierarchical structures whereby the LSPR extends throughout the visible region and near-infrared due to the multiple branched structures in the substrate. This makes these materials robust in detecting analytes using the SERS technique in the visible wavelength region [15, 24].

Figure 6. UV–Vis spectrum of bimetallic Ag-Cu nanodendrites obtained using 5 V, 30 s.
Download figure:
Standard image High-resolution image3.4. X-ray photoelectron spectroscopy (XPS) analysis
XPS has the benefit of being a very surface selective technique for the elemental composition and oxidation states present on the surface of materials; the data collected is representative of the outer 10 nm of the sample. Figure 7(a) shows the XPS spectra survey for Ag-Cu nanodendrite in which C, O, Ag, and Cu elements are present. The high resolution XPS spectrum of Cu 2p (figure 7(b)) shows that the surface is composed by elemental copper Cu0 and copper oxide CuO (Cu2+) due to the presence of the spin-orbital doublets of Cu 2 p1/2 and Cu 2 p3/2 at binding energies of 932.1 and 951.9 eV for Cu0 and at 935.2 and 955.1 eV for Cu2+. The formation of copper oxide (II) during the electrodeposition of Cu was observed by other authors [18]. The ratio of Cu0: Cu2+ found was 1:3. These results suggest that the copper is mainly found as a mixture of copper and copper oxide (II). The high-resolution spectrum for silver (figure 7(c)) shows the characteristic spin-orbit splitting of the 3 d level for metallic silver at 368.1 eV and 374.1 eV[25]. Also, the absence of the satellites in the spectrum could be attributed to the formation of other compound [18], in this case, the presence of Cu in the Ag structure which is in agreement with the GIXRD and EDX analysis. The C 1 s spectrum in figure 7(e) shows the characteristic peaks of the adventitious carbon components: C–C, C–O–C, and O–C = O at binding energies of 284.8 eV, 286.8 eV, and 289.8 eV, respectively. The oxygen spectrum (figure 7(d)) shows a feature at 530.1 eV attributed to the presence of metallic oxides[26], in this case, copper oxide (II). Li et al [16]. also reported the presence of CuO in their Ag-Cu dendrites, however the SERS performance is low compared with the results achieved in the present work. In the work reported by Li et al, the lowest concentration of 4-mercaptobenzoic acid (4-MBA) detected was 1 × 10⁻⁸ mol l−1. 4-MBA is a molecule that chemically binds with silver through thiol groups, and due to the above a better SERS activity would be expected. In the same manner, there are reports which claim that the presence of CuO diminish the SERS activity [27, 28]. However Dubkov et al [29] prove that the presence of CuO in Ag-Cu nanoparticles does not affect the SERS properties, and it was observed that the presence of Ag in Ag-Cu nanoparticles amplify the Raman signal in a wide range of wavelenghts (488–633 nm). In addition, good SERS activity of Cu2O nanoparticles assembled in a superstructure was obtained by Lin et. al. in the detection of R6G and crystal violet [30]. Thus, the presence of copper oxide (II) on the surface of the nanodendrite does not diminish their SERS activity, as shown in the following section.
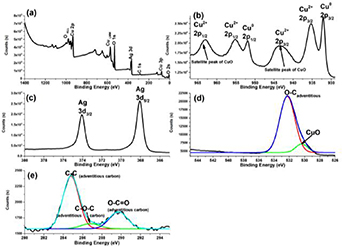
Figure 7. XPS spectra of Ag-Cu nanodendrites, (a) survey spectrum, (b) Cu 2p, (c) Ag 3d, (d) O 1 s, and (e) C 1 s.
Download figure:
Standard image High-resolution image3.5. Evaluation of Ag-Cu dendrites as SERS substrates
The SERS measurements were obtained using Rhodamine 6 G (R6G) as the probe molecule. The Raman spectra of the bare Al sheet used as a substrate for electrodeposition and the Al/Ag-Cu nanodendrites (Ag-CuD) substrate with R6G were acquired. Figure 8 shows the Raman spectra of substrates in contact with R6G solutions at different concentrations, from 10–6 mol l−1 to 10–15 mol l−1.
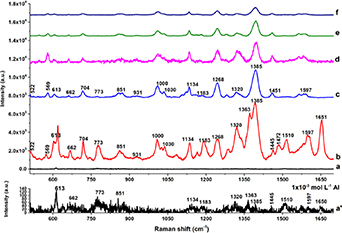
Figure 8. Raman spectra of bare Al with R6G 1 × 10⁻³ mol l−1(a), zoom in of (a) in (a'); Ag-CuD as SERS substrates (b) to (f) with different concentrations of R6G (b)1 × 10⁻⁶, (c)1 × 10⁻⁹, (d)1 × 10⁻¹⁰, (e)1 × 10–12, and (f)1 × 10–15 mol l−1.
Download figure:
Standard image High-resolution imageFigure 8(a) and (a') shows the spectrum of R6G (10–3 mol l−1) when the bare Al sheet is used, it can be seen that the peak at 612 cm−1 it is the most intense. However, the effectiveness of Ag-Cu nanodendrites can be observed as an enormous increase of the signals for very dilute solutions of R6G (figures 8(b) to (f)).
When the Ag-CuD SERS substrate is used, most of the characteristic Raman peaks of R6G are obtained: 613, 662, 704 (C-C–C bend in-plane), 774 (in-plane deformation of xanthane ring)[31], 851 (phenyl ring with the COOC2H5 group)[31], 931 (C–H out of plane bending), 1000 (N–H stretching), 1030 (C–H out of plane bending in a pair of methyl groups), 1134 (C–H in-plane bend), 1183 (C–H in-plane bend + C–C streching), 1268 (C–O–C stretching), 1320 (arom. C–O–C stretching), 1363 (arom. C–C streching), 1385 (C–N streching), 1445 (rocking motion of the methyl group adjacent to the xanthene ring)[31], 1472 (C–N streching), 1510 (arom. C–C stretching), 1597 (arom. C–C streching), and 1651 (arom. C–C stretching) cm−1[32].
Raman and SERS signals with their assignment are summarized in Table S3. It can be observed that more signals appear in the SERS spectrum in comparisson with the obtained in bare Al. Also, a few signals disappear when low concentrations are tested (10−9−10−15 mol l−1). The above is in agreement with the reported data when a SERS substrate is used and when low concentrations of the analyte were tested [33–35]. The signals at 1385 and 1445 cm−1 are broadened and slightly shifted, this shifts in signals are attributed to a strong interaction of the analyte with the substrate [36] and also to small changes in energy levels specially at high concentrations (e.g. 10–3 mol l−1)[37].
The AEF for R6G was determined using the following equation:
ISERS: Intensity of the Raman peak for the Ag-CuD substrate.
IRS: Intensity of the same Raman peak for the Al substrate.
CSERS: 1 × 10⁻⁶, 1 × 10⁻⁹, 1 × 10⁻¹⁰, 1 × 10⁻¹², and 1 × 10⁻¹⁵ mol l−1.
CRS:1 × 10⁻³ mol l−1.
Table 1 shows the AEF values obtained using the Ag-CuD substrate with the different concentrations of R6G. For example, the intensity of the 613 cm−1 band obtained with the bare Al substrate and R6G concentration of 10–3 mol l−1 was 118 units, whereas for the Ag-CuD substrate and R6G concentration of 10–6 mol l−1 an intensity of 3593 was obtained. For the calculation, the peak at 613 and 1385 cm−1 were chosen, since 613 cm−1 is the most intense band for Raman spectrum and 1385 cm−1 for SERS spectrum.
Table 1. AEF data for the different R6G concentrations.
| [R6G]/mol L−1 | AEF (613 cm−1) | AEF (1385 cm−1) |
|---|---|---|
| 10−6 | 3 × 10⁴ | 1.1 × 10⁵ |
| 10−9 | 3 × 10⁶ | 1.1 × 10⁷ |
| 10−10 | 8.8 × 10⁷ | 3.1 × 10⁸ |
| 10−12 | 6.5 × 10⁸ | 2.3 × 10⁹ |
| 10−15 | 6.5 × 10¹¹ | 2.3 × 10¹² |
Our Ag-CuD substrate offers an excellent choice for its use in analyte detection. The simplicity of the preparation process adds advantages compared to those currently reported [13, 16, 38–40].
3.6. Limit of detection (LOD)
The peak at 1385 cm−1 was selected to investigate the linear relationship between Raman intensity and concentrations, as shown in figure 9. An excellent linear response was observed between the intensity and R6G concentration. The linear response is highly useful for quantitative determinations of the analyte using SERS. LOD can be obtained from the equation of the graph according to the following equation:

Figure 9. The linear relationship between the intensity of the bank peaking at 1385 cm−1 and R6G concentrations.
Download figure:
Standard image High-resolution image
sa: Standard deviation of the blank.
b: Slope of the lineal adjust.
Standard deviation was estimated using Raman spectra recorded at ten different positions on the substrate.
The Ag-CuD substrate allowed us to obtain a LOD of 1.3114 × 10⁻¹⁵ mol l−1 or 0.6560 attomoles of R6G. Ag and Cu possess high SERS activity when they work together as a substrate as observed in this investigation. Hu et al [14]. achieved one of the lowest LOD for R6G using Ag-Cu dendrites obtained via galvanic replacement which is 10–13 mol l−1, two orders of magnitude lower than ours. For the best of our knowledge the LOD achieved in this investigation is the lowest using Ag-Cu dendritic nanomaterial.
4. Conclusions
In summary, we have demonstrated a simple method for the formation of Ag-Cu dendritic nanostructures with an electrodeposition process onto Al substrates. The morphology of the Ag-Cu nanodendrites deposits at different deposition times shows that the formation of Ag-Cu dendritic nanostructures derives from the continuous aggregation growth and self-assembly of small nanoparticles. The dendritic structure is composed of nanodomains of Ag, Cu, and AgCu according to the data of GIXRD, EDX, and XPS. The SERS effect of the Ag-Cu nanodendrites obtained using R6G probe indicates that the substrate is highly active in SERS. A low limit of detection was achieved for R6G, being able to detect up to 0.6560 attomoles with an AEF in the order of 1012.
Acknowledgments
We are grateful to CONACyT for financial support (Fronteras de la Ciencia Project: FC 2016/1700). R D Rivera-Rangel and M E Navarro-Segura would like to acknowledge CONACyT for the postdoctoral and doctoral scholarship, respectively. The authors would like to thank Alonso Concha (XRD, CIMAV Monterrey), J Alejandro Arizpe (Raman Spectroscopy, CIMAV Monterrey), Gerardo Silva and Marcelo Martínez (XPS, CIMAV Monterrey), Julio Rivera (ICP-OES analysis, CIMAV Monterrey), and Nayeli Pineda (SEM, STEM, and EDX, CIMAV Monterrey) for their help and assistance with the characterization techniques.