

Abstract
Tin (IV) oxide (SnO2) nanostructures are regarded as one of the most popular materials for conventional gas sensors, due to their high surface area and fast response in regard to most reducing and oxidizing gases. However, their high operating temperature (>200 °C) leads to high power consumption and limits their applications. Here, a new nanocomposite fiber materials, consisting of undoped and doped (nickel and palladium) SnO2 nanorods, polyaniline (PANI), and polyhydroxy-3-butyrate (P3HB) are synthesized via the hydrothermal method,followed by an in situ polymerization and electrospinning technique. The as-synthesized nanocomposites are tested using ethanol gas at different operating temperatures: 25 °C (room temperature), 60 °C, and 80 °C. The results reveal that all samples began to show a response at 80 °C. Pd:SnO2/PANI/P3HB nanocomposite fiber sensors demonstrate a relatively higher response than that of SnO2/PANI/P3HB and Ni:SnO2/PANI/P3HB nanocomposite sensors. At 80 °C , the Pd:SnO2/PANI/P3HB nanocomposite sensor records a response (R0/Rg) of 1610, with a response time (Tres) of 90 s and a recovery time (Trec) of 9 min in relation to 1000 ppm ethanol gas in N2. The sensor also displays a good level of response (R0/Rg = 200) at a low concentration level (50 ppm) of ethanol gas. Structural and chemical characterizations indicate that the ethanol gas sensing performance of Pd:SnO2/PANI/P3HB nanocomposite fibers can mainly be attributed to the p-n heterojunction, fiber geometry, and one-dimensional structure of SnO2 and to the presence of the Pd catalyst. This bio-nanocomposite fiber has the potential to be a breakthrough material in biodegradable low temperature ethanol sensing applications.
Export citation and abstract BibTeX RIS
1. Introduction
In recent years, the fabrication of flexible sensors has become a new trend in the production of advanced electronic devices. The main challenge in producing flexible gas sensors lies not only in establishing their mechanical properties, but also in retaining their selectivity, sensitivity and reproducibility. Therefore, several different approaches have been explored to overcome these drawbacks.
Conducting polymers such as polyaniline (PANI), polypyrrole (PPy), and polythiophene (PTh) have been used as gas sensor materials since the 1980s [1]. The presence of charge carriers to move along the bonds makes theman excellent candidates as gas sensors. Among the family of conducting polymers, PANI has attracted a great deal of attention, owing to its high electric conductivity and typical π conjugated structure, its excellent environmental stability, and facile fabrication process, as well as its low cost [2]. For the past few decades, PANI has been extensively studied as a sensor material for the detection of various oxidizing and reducing gases [3]. Although PANI exhibits good sensitivity at much lower operating temperatures compared to conventional gas sensors (e.g. metal oxides), it demonstrates low responsivity at low target gas concentrations, together with a long response and recovery time, limiting its application.
On the other hand, semiconducting metal oxide-based gas sensors have attracted the interest of many researchers since Seiyama and co-workers first discovered in 1962 that the adsorption and desorption of gas molecules on the surface of zinc oxide (ZnO) causes a rapid change in electrical conductivity [4]. Since then, various metal oxides, such as tin oxide (SnO2) [5–7], titanium oxide (TiO2) [8], zinc oxide (ZnO) [9–11], and vanadium oxide (V2O5) [12] have been widely investigated as gas sensors. Of these, one dimensional (1D) SnO2 nanostructures are regarded as one of the most popular materials for conventional gas sensors, due to their high surface area and fast response towards most reducing and oxidizing gases [13–15]. Although 1D SnO2 nanostructures show some encouraging results in gas sensor applications, improving theirpoor gas sensing response, high recovery time and high operating temperature (>200 °C) requires more effort and remainsa challenge. One of the most common techniques for improving gas sensing performance is by introducing transition metals or noble metals as dopants [16].
In our recent work, we successfully synthesized undoped and doped (Ni and Pd) SnO2 nanorods using the hydrothermal method, and tested these on ethanol gas [17, 18]. The results showed that the sensing properties of the SnO2 sensor improved greatly subsequent to doping with 5 mol% Pd. Generally, doping results in the formation of a p-n junction or generates catalytic activity to improvethe sensing properties of the SnO2. Ni is one of the common transition metals used for doping SnO2, due to its comparable sensing performance with noble metal-doped SnO2. The dramtic changes in the sensing capability of Ni doped SnO2 is strongly related to the p-n heterojunction, which increases the thickness of the depletion layer, consequently raising the resistance of the sensor material [11, 17, 19–21]. Palladium (Pd) is also well-known for its catalytic activity, where the target gas molecules activate on the Pd dopant and subsequently transfer to the SnO2, where they react with chemiabsorbed oxygen ions [22–24]. Nevertheless, sensors doped in this way still require a relatively high operating temperature (>200 °C). It is therefore essential to develop an efficient gas sensor to meet the requirements of current electronic devices.
In order to overcome the drawbacks of both PANI and SnO2, a new concept has recently been introduced, involving the fabrication of a flexible gas sensor based on an inorganic—organic nanocomposite. A great deal of reseacrh has been conducted in relation to the use of metal oxide—PANI nanocomposites as gas sensors; the results indicate that the gas sensing mechanism is different from that of single oxide semiconductors or PANI [25–28]. Interestingly, such sensors demonstrate excellent response and recovery at lower operating temperatures (<200 °C) [29–33].
Typically, the synthesis of a metal oxide/PANI nanocomposite involves the mixing of metal oxide nanopowders with a PANI polymer, which is then fabricated into a thin film. The research conducted by Geng and the co-researchers in 2017 synthesized SnO2/PANI via hydrothermal treatment, where PANI was polymerized via an in-situ process [34]. However, this method decreased the surface area of the sensor materials. In order to increase the surface area of the sensor material, the electrospinning technique is generally considered to be an efficient and relatively simple method for producing nanocomposite fibers. Subsequently, the higher surface area of the sensor material leads to higher sensitivity [35]. However, the low molecular weight of PANI is generally insufficient for direct electrospinning into the fibers [36]. Thus, to circumvent this problem, the material is usually blended together with a higher molecular weight polymer such as Polyvinylpyrrolidone (PVP) [35].
Poly-3-hydroxybutyrate (P3HB) is a high molecular weight biopolymer belonging to the polyhydroxyalkanoates (PHAs) family, which are produced by microorganisms. In recent years, a number of studies have been conducted on the synthesis of a PANI/P3HB conductive polymer, with the eventual aim of combining the characteristics of biodegradability and electrical semiconductivity with good mechanical properties [30, 31].
The present research work therefore focuses on the development of environmentally friendly, flexible, polymer based nanocomposite fibers for gas sensing applications. To achieve this goal, 1D SnO2 and doped (Ni and Pd) SnO2/PANI nanocomposites were synthesized using the hydrothermal method, followed by in situ polymerization. The nanocomposite samples were electrospun together with P3HB to produce bio-degradable nanocomposite fibers. The sensing performance of the prepared nanocomposite was evaluated by exposure to ethanol gas. Based on the results, the Pd:SnO2/PANI/P3HB nanocomposite fibres sensor exhibited better sensing properties at a relatively lower temperature of 80 °C as compared to undoped and Ni doped SnO2 nanocomposite sensors. This significant improvement is mainly attributed to the p-n heterojunction, the fibres' geometry, and 1D Pd:SnO2 nanorods, as well as the presence of catalytic active Pd. The enhanced gas sensing performance at low temperature may be explained in terms of the reliable gas sensing mechanism of electrospun Pd:SnO2/PANI/P3HB nanocomposite fibers.
2. Experimental details
2.1. Chemicals
All solvents and reagents were used without further purification. Tin chloride pentahydrate (SnCl4 · 5H2O, purity: 98%) and aniline (C6H5NH2, purity: >99.5%) were purchased from Sigma–Aldrich (USA). Palladium (II) chloride (PdCl2) and nickel chloride hexahydrate (NiCl2 · 6H2O) were obtained from R&M Chemicals (Essex, UK). Ammonium persulfate (APS) was procured from Bendosen (Norway). N, N-dimethylformamide (DMF), chloroform and methanol were obtained from Merck (Germany). Gas cylinders containing nitrogen (N2, 99.999%), argon (Ar, 99.999%) and 1000 ppm ethanol (C2H5OH) in N2 were supplied by Linde Malaysia Sdn. Bhd.
2.2. Hydrothermal synthesis of SnO2 and doped SnO2 nanorods
The undoped SnO2, Ni doped SnO2 (Ni:SnO2) and Pd doped SnO2 (Pd:SnO2) nanorods were hydrothermally synthesized using a procedure reported elsewhere [17, 18, 37]. Briefly, a reaction solution was prepared at room temperature by mixing 1.7 g of SnCl4.5H2O in a solvent having 1:1 (v/v) ratio of absolute ethanol and water under vigorous stirring. For the preparation of Ni:SnO2 and Pd:SnO2 samples, a 5 mol% solution of NiCl2 · 6H2O and PdCl2 was added to the previously prepared solutions, respectively. While stirring, 6 M NaOH aqueous solution and absolute ethanol were added dropwise to the solution until the pH reached 13. Prior to hydrothermal treatment, the final volumes of the reaction solutions were maintained at 40 ml by adding a mixture of absolute ethanol and distilled water at a volume ratio of 1:1. Next, the reaction solutions were transferred into a 50 ml teflon linen stainless steel autoclave and heated to 180 °C for 24 h for SnO2, and 15 h for Ni:SnO2 and Pd:SnO2. Subsequent to the reactions, the precipitates were washed and centrifuged repeatedly with distilled water and ethanol. The resulting precipitates were oven dried at 180 °C for 24 h. White, green, and grey colored fine powder were obtained, and the samples were identified as SnO2, Ni:SnO2, and Pd:SnO2 nanorods, respectively.
2.3. Synthesis of SnO2/PANI nanocomposite with Ni and Pd doping
The SnO2/PANI, Ni:SnO2/PANI and Pd:SnO2/PANI nancomposites were synthesized via an in situ polymerization method. A 5 mmol aniline solution was mixed together with 70 ml of 1 M HCl aqueous solution. Next, 0.5 g of as-synthesized SnO2 nanorods were added to the solution and sonicated for 30 min. Meanwhile, 5 mmol of ammonium persulphate (APS) was dissolved in 30 ml of 1 M HCl separately. Under constant stirring, at a temperature of 0 °C–5 °C, the APS solution was added dropwise to the aniline-SnO2 solution. In order to achieve a good degree of polymerization, the sample was stirred for at least 6 h. Emeraldine green precipitate formed in the reaction solution. The precipitates was washed and filtered several times with 1 M HCl, distilled water, and finally ethanol solvent, until the supernatant liquid became clear. Finally, the samples were dried in an oven at 50 °C for 24 h. Similar procedures were applied to the synthesis of Ni:SnO2/PANI and Pd:SnO2/PANI nanocomposite powders.
2.4. Synthesis of SnO2/PANI/P3HB nanocomposite fibers
Polyhydroxy-3-butyrate (P3HB) was synthesized from Cupriavidus necator cells, provided by the Ecobiomaterial Research Laboratory, School of Biological Sciences, Universiti Sains Malaysia. The harvested and freezed-dried cells were processed by using chloroform to eliminate the biomass residuals, mainly consisting of cellular materials. Prior to the electrospinning process, 0.2 g of the purified P3HB sample was mixed in a 5 ml solvent containing chloroform and N,N-dimetylformamide (DMF), mixed at a ratio of 4:1 (v/v) and stirred vigrously at 55 °C until all the P3HB had dissolved in the solvent. Next, 0.5 g of as-synthesized SnO2/PANI, Ni:SnO2/PANI and Pd:SnO2/PANI were added to the P3HB solution separately, before being continuously stirred for 4 d. A green viscous solution was obtained, and the sample was introduced into a Esprayer ES-2000 via a glass syringe needle with an inner diameter of 0.5 mm. The electrospinning process was performed at three different applied voltages and flow rates of (1) 15 kV, 16.67 µl; (2) 18 kV, 3 µl and (3) 28 kV, 15 µl by maintaining the distance between the nozzle and the target point (20 cm). The nanocomposite fibers were directly deposited onto Au interdigitated alumina substrates with dimensions of 5 mm × 5 mm (Case Western Reserve University, Cleveland, OH, USA) at room temperature. The deposition time was fixed at 5 min in order to achieve good coverage.
2.5. Characterizations
The formation of bio-nanocomposite fibers was observed under an optical microscope (Olympus BX 41) connected to a digital camera (XCam). The sample morphology was analyzed using a scanning electron microscope (SEM: Quanta FEG 650) along with an energy dispersive x-ray (EDX: X Max 50, Oxford Instrument) spectroscope. The x-ray diffraction (XRD) patterns of the samples were recorded using PANalytical PW 3040/60 X'PERT PRO with CuKα radiation. The scanning step size was 0.0340°, and the scan time was 20 s per step. The x-ray photoelectron spectroscopy (XPS) spectra were collected using a Kratos Axis Ultra DLD with monochromatic AlKα radiation (1486.6 eV photons) and a background pressure of 10−7 Pa. The C1s signal (284.6 eV) was applied to calibrate the data, and the data were analyzed using CASAXPS (version 2.3.17) software. A Gaussian (70%)—Lorentzian (30%) profile and a standard Shirley background were applied for fitting the XPS data. The samples were also investigated under a Fourier transform infrared (FTIR) spectroscope using a Perkin Elmer 2000 FTIR system in the range of 500–4000 cm−1.
2.6. Ethanol sensing test
A systematic approach was employed to investigate the performance of the bio-nanocomposite fiber [8]; detailed information on the configuration of the instrumentation can be found in our previous work [17]. As mentioned in section 2.5, the bio-nanocomposite fibers were deposited onto Au interdigitated alumina substrates and stabilized at 150 °C in Ar gas flowing at a rate of 500 sccm. Next, the sensor was placed inside the closed quartz tube of a horizontal tube furnace (Lindberg Blue M, TF5503A-1) connected to the data acquisition system (DAQ: Agilent 34972A) via Au wire (Alfa Aesar, diameter: 0.2 mm). The sensors inside the quartz tube were exposed to N2 (background gas) and 1000 ppm ethanol in N2 (target gas). The total flow rate of the gases was maintained at 200 sccm using mass flow controllers (MFCs: Sierra, C100L-CM-NR-2-0V1-SV1-PV2-V1) at room temperature, 60 °C, and 80 °C. The performance of selected sensors was evaluated at the optimum operating temperature using various concentrations of ethanol gas (50 ppm to 1000 ppm) in N2.
Three important gas sensing performance parameters, i.e. sensor response (R0/Rg), response time (Tres), and recovery time (Trec) were investigated. The sensor response is denoted as R0/Rg, where R0 is the sensor resistance in background or carrier gas (N2), and Rg is the sensor resistance in the target gas, i.e. ethanol in N2. Tres is expressed as the time period taken for the sensor to reach 90% of its total resistance change upon exposure to the target gas, whereas Tres is defined as the time needed for the sensor undergo 90% of its total resistance change upon removal of the target gas.
3. Results and discussion
3.1. Fiber formation
In order to produce uniform fibers, the SnO2/PANI/P3HB nanocomposite samples were electrospun in three conditions by varying the applied voltage (kV) and flow rate (μL/min), as shown in figure 1. The fibers shown in figures 1(a)–(c) were electrospun at the voltages and flow rates of 15 kV, 16.67 μl min−1; 18 kV, 3 μl min−1 and 28 kV, 15 μl min−1, respectively. The average thickness of the fibers shown in figures 1(a)–(c) are 452.9 ± 31.8 nm, 546.3 ± 184.6 nm and 696.7 ± 185.3 nm, respectively. A noticeable decrease in coverage density can be observed in samples electrospun at a higher flow rate (figure 1(a)), suggesting that high flow rate decreases the coverage density [38]. The increase in the diameter of fibers in figure 1(c) could be ascirbed to the applied voltage being greater than the visco-elastic force (from viscous solution) [39]. Thus, a charged jet travelled much faster to the grounded target, which has less time to evaporate. This resulted in the formation of thicker fibers with non-uniform size [40], whereas at a voltage of 15 kV and a flow rate of 16.67 µl min−1, the forces are well-balanced, resulting in narrow distribution of nanofibers (figure 1(b)). Thus, an voltage of 15 kV and a flow rate of 16.67 µl min−1 were selected as representing the optimal conditions for synthesizing Ni:SnO2/PANI/P3HB and Pd:SnO2/PANI/P3HB nanocomposite fibers.
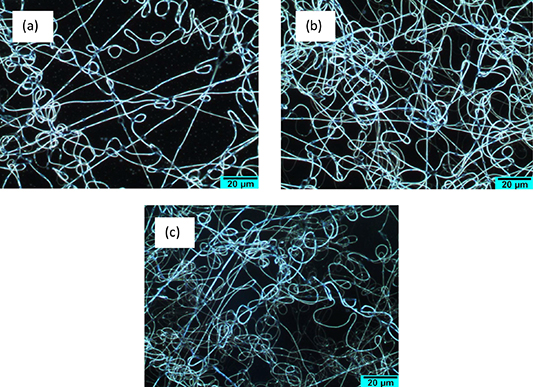
Figure 1. Optical micrographs of SnO2/PANI/P3HB nanocomposite fibers at different applied voltages and flow rates: (a) 15 kV, 16.67 μl min−1; (b) 18 kV, 3 μl min−1; and (c) 28 kV; 15 μl min−1.
Download figure:
Standard image High-resolution image3.2. Ethanol gas sensing test
In our previous study, SnO2, Ni and Pd doped SnO2 nanorods were synthesized via the hydrothermal route, and found to be highly sensitive to ethanol gas [17, 18]. Ni and Pd doped SnO2 nanorods improved the overall sensing performance. However, these still required a high operating temperature of 450 °C [17, 18]. Thus, the goal of the current study is to reduce the operating temperature without losing the high sensing performance of SnO2.
Three different nanocomposite fiber sensors, namely SnO2/PANI/P3HB, Ni:SnO2/PANI/P3HB, and Pd:SnO2/PANI/P3HB were tested by exposure to 1000 ppm C2H5OH in N2 at room temperature, 60 °C and 80 °C. However, at room temperature and 60 °C, no change in resistance was observed in either the background or the target gas environment. The sensors began to show changes in resistivity when the temperature was raised to 80 °C.
The changes in resistance of the SnO2/PANI/P3HB, Ni:SnO2/PANI/P3HB, and Pd:SnO2/PANI/P3HB sensors in background (N2) and target gas environment (1000 ppm ethanol in N2) at 80 °C are shown in figure 2(a). It can be observed that the resistance of all sensors decreases in the ethanol environment, indicating that all sensors are n-type. The response (R0/Rg) of the sensors is calculated from figure 2(a), and plotted in figure 2(b). The Pd:SnO2/PANI/P3HB sensor showed the highest responsivity to the ethanol gas (R0/Rg= 1610.3), followed by the Ni:SnO2/PANI/P3HB and SnO2/PANI/P3HB sensors, with responses of R0/Rg = 27.4 and R0/Rg = 5.2, respectively. The SnO2/PANI/P3HB sensor exhibited a faster response time (70 s) compared with the Ni:SnO2/PANI/P3HB and Pd:SnO2/PANI/P3HB fiber sensors (90 s). The recovery times for SnO2/PANI/P3HB and Ni:SnO2/PANI/P3HB were 8 min and 10 min, respectively, while Pd:SnO2/PANI/P3HB recorded 9 min. Even though the response and recovery time of the SnO2/PANI/P3HB nanocomposite sensor are better than those of either Ni:SnO2/PANI/P3HB or Pd:SnO2/PANI/P3HB, the responsiveness of SnO2/PANI/P3HB is far lower than for the Ni and Pd doped SnO2/PANI/P3HB sensors. Of these three sensors, the responsivity of Pd:SnO2/PANI/P3HB is significantly higher than that of the other two. Hence, the Pd:SnO2/PANI/P3HB sensor was selected for further investigations.
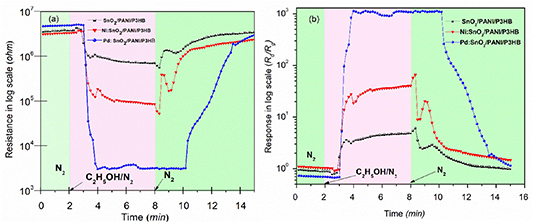
Figure 2. Response of nanocomposite fibers sensors to 1000 ppm ethanol in N2 at an operating temperature of 80 °C (a) resistance curves and (b) response curves.
Download figure:
Standard image High-resolution imageTo study the lower limit of detection and stability of the Pd:SnO2/PANI/P3HB sensor, gas sensing tests were performed at various concentrations (1000–50 ppm), while maintaining an operating temperature of 80 °C. The response curve of the Pd:SnO2/PANI/P3HB fibers sensor is shown in figure 3. The response decreases gradually with decreasing ethanol gas concentrations. By decreasing the ethanol concentration from 1000 ppm to 50 ppm, the response level drops from 1610.3 to ∼200, respectively.

Figure 3. Real time-response curve of Pd:SnO2/PANI/P3HB nanocomposite fibers sensor, exposed to different concentrations of ethanol gas.
Download figure:
Standard image High-resolution imageThe response time and recovery time of the Pd:SnO2/PANI/P3HB sensor decreases with a decrease in the concentration of ethanol gas, as illustrated in figure 3. The response time decreases from 90 s to 30 s, with a decrease in the ethanol concentration from 1000 ppm to 50 ppm, respectively. This decline in response time at lower concentrations of ethanol may be due to the fast diffusion of ethanol gas molecules into the fibrous sensor material, whereas at higher concentrations the diffusion of ethanol gas molecules slows down. Similarly, the recovery time of the sensor is also reduced with a decrease in the ethanol concentrations. It is assumed that at a low concentration of ethanol the reaction product leaves the sensor surface immediately,which is not in the case for higher concentrations of ethanol [8, 28]. Typically, the variation in the response time and recovery time depends upon the adsorption and desorption of target gas molecules [8, 41]. Moreover, the continuity of the response and recovery curve suggests that Pd:SnO2/PANI/P3HB has good repeatability and stability [17].
The linear dependence and detection limit of the nanocomposite sensor was investigated. Figure 4(a) depicts the sensor response as a function of ethanol concentrations in log scale for Pd:SnO2/PANI/P3HB, and the result is compared with a Pd:SnO2 sensor (figure 4(b)). It can be observed that the both sensors exhibit linear dependence when response versus concentration is plotted in log-log scale. However, the R2 values indicate that the Pd:SnO2/PANI/P3HB sensor exhibits a better response correlation compared with the Pd:SnO2 sensor. An extrapolation of the graph gives an estimated value of the detection limits [42], which are >20.4 ppb and >231 ppb for Pd:SnO2/PANI/P3HB nanocomposite fibers, and Pd:SnO2nanorods, respectively. This result demonstrates that the Pd:SnO2/PANI/P3HB nanocomposite fiber sensor lowers the detection limit on exposure to ethanol gas, and is capable of detecting low concentrations of ethanol gas at a relatively low temperature. In order to investigate the factors contributing to the performance of the Pd:SnO2/PANI/P3HB nanocomposite fiber sensor, a number of analyses were performed.

Figure 4. Linear dependence of sensor response and concentration (dilogaritm curve) (a) Pd:SnO2/PANI/P3HB and (b) Pd:SnO2 sensors at operating temperatures of 80 °C and 450 °C, respectively.
Download figure:
Standard image High-resolution image3.3. Characterization of gas sensing material
The morphology of electrospun Pd:SnO2/PANI/P3HB nanocomposite fibers was observed under SEM, and the results are shown in figure 5. The presence of a web-like dense network of continuous microfibers can clearly be seen. The interconnected void volumes and high surface-to-volume ratios originating from the small size of the fibers increases the surface area of the material. It has been postulated that voids and small sized fibers partly contributes to the performance of the sensor. These characteristics may accelerate the diffusion of ethanol gas molecules into and out of the structure, and subsequently provide a fine pathway for electron transfer during the gas sensing process [43, 44]. Meanwhile, the presence of some agglomerates in between and on the surface of fibers can clearly be observed, as shown in the inset of figure 5. The EDX spectrum suggests that the aggregation is Pd:SnO2.
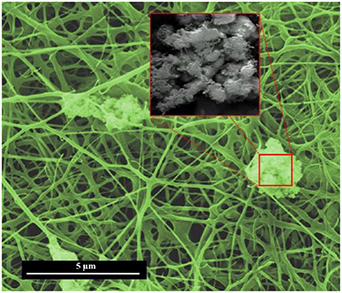
Figure 5. FESEM micrograph of electrospun Pd:SnO2/PANI/P3HB nanocomposite (inset: Pd:SnO2 agglomerates).
Download figure:
Standard image High-resolution imageFigure 6 shows the XRD patterns obtained for Pd:SnO2, PANI, and Pd:SnO2/PANI/P3HB nanocomposite fibers, respectively. The XRD pattern of the Pd:SnO2/PANI/P3HB fibers is similar to that of Pd:SnO2 nanorods, where the 2θ values of the diffraction peaks are well-indexed as tetragonal rutile SnO2 (ICSD 092552). Interestingly, the broad diffraction peak of PANI at the 2θ range of 20° to 30° is not present in the nanocomposite sample, suggesting that the incorporation of PANI does not alter the crystalline structure of the nanocomposite [34]. It is worth noting that the intensity of diffraction peaks for Pd:SnO2/PANI/P3HB nanocomposite is lower than that of Pd:SnO2 nanorods. This is due to the non-crystalline (amorphous) characteristics of PANI and P3HB polymers, which reduces the mass-volume percentage of Pd:SnO2 and subsequently weakens the diffraction peaks of SnO2 in the nanocomposite samples [45].
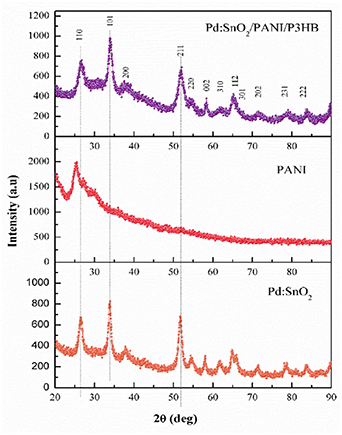
Figure 6. XRD patterns of Pd:SnO2, PANI, and Pd:SnO2/PANI/P3HB nanocomposite fibers.
Download figure:
Standard image High-resolution imageFigure 7 shows the FTIR spectra of P3HB, PANI, and the Pd:SnO2/PANI/P3HB nanocomposite. A comparison between P3HB and PANI and the Pd:SnO2/PANI/P3HB nanocomposite, reveals the presence of characteristic peaks for PANI, and P3HB, as well as SnO2. Referring to the FTIR spectrum for the Pd:SnO2/PANI/P3HB nanocomposite, the peaks at 1560 cm−1, 1473 cm−1 and 796 cm−1 originate from the functional group of PANI, while the peaks at 3456 cm−1, 1670 cm−1, and 1129 cm−1 are attributed to functional groups in P3HB. On the other hand, the characteristic peak of SnO2 was identified at a lower wavenumber (612 cm−1) [46]. As the shifts in the characteristic peaks of PANI (C=N and C-N) and P3HB (C=O) in the nanocomposite are only marginal, it can be deduced that the intermolecular interactions between the two polymers in the nanocomposite are negligible. For instance, the n-π interaction of unshared electrons in the carbonyl group in P3HB, and the π electrons in the aromatic ring of PANI are not observed in the nanocomposite sample [47]. Therefore, in this study, P3HB acts as a host polymer and does not take part in the gas sensing reaction [43].

Figure 7. FTIR spectra of P3HB, PANI, and Pd:SnO2/PANI/P3HB nanocomposite fibers.
Download figure:
Standard image High-resolution imageAn XPS analysis was conducted to determine the chemical composition of the surface of the as-synthesized nanocomposite. Figure 8 presents the high resolution XPS spectra of N1s and Sn3d of PANI and Pd:SnO2/PANI/P3HB, respectively. Table 1 summarizes the binding energies obtained from the XPS analysis. Referring to figures 8(a) and (b), the N1s core level spectra of PANI and the Pd:SnO2/PANI/P3HB nanocomposite can be fitted into four peaks using a Gaussian/Lorentzian function. The peak at lowest binding energy (400.9 eV) corresponds to the imine nitrogen (=N-) species, while the peak at 401.8 eV is attributed to the amine NH- [48]. Two additional peaks at higher binding energies (402.6 eV and 403.4 eV) are associated with nitrogen species with delocalized radical cations (-NH+•) and the positive charged imine cation (-NH+-), respectively [49, 50].
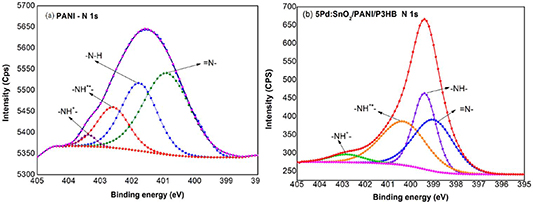
Figure 8. High resolution XPS spectra of N1s (Al Kα x-ray source, 1486.6 eV of photons).
Download figure:
Standard image High-resolution imageTable 1. Binding energies obtained from XPS analysis. All data was corrected by referencing the spectra to the standard peak of C1s at 284.6 eV.
| Peaks | PANI Binding energy, eV | Pd:SnO2/PANI/P3HB Binding energy, eV | Δ BE (BEnanocomposite−BE PANI), eV |
|---|---|---|---|
| N1s=N- Area % -NH- Area % -NH+• Area % -NH+- Area % | 400.9 49.15 401.8 31.64 402.6 16.90 403.4 2.30 | 398.4 28.96 399.4 33.96 400.3 32.84 402.8 4.27 | −2.5 −2.4 −2.3 −0.6 |
| Peaks | Pd:SnO2 Binding energy, eV | Pd:SnO2/PANI/P3HB Binding energy, eV | Δ BE (BEnanocomposite−BE 5Pd:SnO2), eV |
| Sn 3d3/2 (Sn4+) Area % (Sn2+) Area | 494.6 25.85 494.3 15.43 | 495.9 – – – | 1.3 – – – |
| Sn 3d5/2 (Sn4+) Area % (Sn2+) Area % | 486.2 36.75 485.9 20.78 | 487.5 – – – | 1.3 – – – |
As compared to PANI, all of the N1s species in the nanocomposite shift to lower binding energies (table 1). It was anticipated that electrons would transfer from Pd:SnO2 to PANI at the interface [51]. The doping degree of PANI can be calculated from the ratio of area percentage of positively charged nitrogen species (N+) to total nitrogen (N). It is estimated that doping level of Pd:SnO2/PANI/P3HB nanocomposite is higher (0.4) than PANI (0.2), confirming the conductivity of PANI improved in the nanocomposite [42].
Figures 9(a) and (b) depict the high resolution XPS spectra of Sn3d for Pd:SnO2 nanorods and Pd:SnO2/PANI/P3HB nanocomposite fibers. For the Pd doped SnO2 sample, the dominant species were identified as Sn4+ 3d5/2 and Sn2+ 3d3/2 at 486.2 eV and 494.6 eV, respectively. Meanwhile, two small peaks occurring at 485.9 eV and 494.3 eV correspond to Sn2+ 3d5/2 and Sn2+ 3d3/2, respectively. Interestingly, only tetravalent Sn species, with a spin-orbit doublet of Sn4+ 3d5/2 and Sn4+ 3d3/2, having binding energies of 487.5 eV and 495.9 eV, respectively,are found in the Pd:SnO2/PANI/P3HB nanocomposite, as shown in figure 9(b). Moreover, the difference in binding energy between the Sn4+ 3d5/2 and Sn4+ 3d3/2 core levels is 8.4 eV, which further confirms a normal oxidation valence state of Sn4+ [42]. In addition, the binding energy of Sn4+ in the nanocomposite exhibits a positive shift of 1.3 eV comparedto those of Sn4+ in the Pd:SnO2 nanorod sample, indicating electron transfers from SnO2 to PANI.
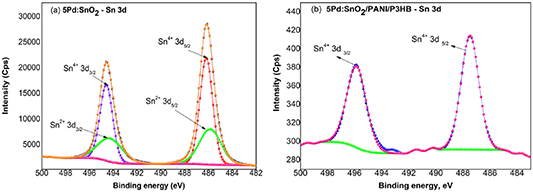
Figure 9. High resolution XPS spectra Sn 3d (Al Kα x-ray source, 1486.6 eV of photons).
Download figure:
Standard image High-resolution imageBased on the obtained XPS result, it can be deduced that the increase in surface electron density of N atoms in the PANI sample confirms the transfer of electrons from SnO2 to PANI at the interface of Pd dopedSnO2 and PANI in the nanocomposite material [1].
3.4. The formation of Pd:SnO2/PANI/P3HB nanocomposite
In this study, the Pd:SnO2/PANI/P3HB nanocomposite was synthesized by employing three main synthesis steps: the hydrothermal method, in-situ polymerization, and the electrospinning technique.
Based on the experimental results obtained, a possible mechanism for the formation of the nanocomposite is proposed [52–54].
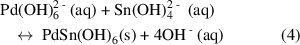
Prior to the hydrothermal treatment, the tin precursor, SnCl4.5H2O and the dopant precursor, PdCl2 were dissolved in a 1:1 (v/v) ethanol and distilled water solvent mixture, which eventually produced Sn4+ ions and Pd2+ ions. As the strong alkaline solution (6 M NaOH) was slowly introduced into the reaction solution, complex ions of  and
and  were formed due to a reaction with the excess amount of OH- , as expressed in equations (1) and (2).


Simultaneously, the  complex ions also reacted with the dopant ions, forming PdSn(OH)6 (equation (3)), where the solution turned into grey slurry.

Under high pressure and temperature in the hydrothermal reaction chamber, the formation of PdSn(OH)6 nuclei accelerated, reaching a critical concentration (equation (4)) where SnO2 nuclei formed spontaneously through dehydration [53] (equation (5)). The newly-formed nuclei go on to grow into nanorods.
In the second step, the Pd:SnO2/PANI nanocomposite was synthesized using the in-situ polymerization method, where the as-synthesized Pd:SnO2 nanorods powder sample is introduced during the polymerization process. The formation of the Pd:SnO2/PANI nanocomposite can be explained by a simple mechanism as follows: during the polymerization process, cation radicals of aniline are produced in the homogeneous reaction solution. These radicals combine to form a polymer chain [45]. Hydrochloric acid was used to dope the nitrogen atom in polyaniline molecules. This phenomenon was confirmed by the positive charged imine (-NH+-) peak in the XPS data. The positive charge on the nitrogen delocalized in the PANI matrix, resulting in a p-type semiconductor [55]. With the presence of Pd:SnO2 nanorods (n-type semiconductor), the electronic properties of the PANI matrix could be modified. The interaction between the n-type Pd:SnO2 and the p-type PANI reates a p-n heterojunction. Subsequently, the electrons in Pd:SnO2 and the holes in PANI diffuse in opposite directions, leading to a thicker depletion layer and an increase in the overall resistivity of the nanocomposite matrix [45].
In the final step, the as-synthesized Pd:SnO2/PANI was blended together with P3HB to obtain a homogeneous viscous solution, in order to carry out the electrospinning process. At this stage, the nanocomposite transforms into fibers, which is another reason for the increase in initial resistance of the Pd:SnO2/PANI/P3HB nanocomposite. When carriers are transported along the sandwich channels (fibers) [56], they are scattered by the covalent bonds of the lattice of SnO2 and PANI, resulting in a decrease in mobility (compared with SnO2 nanorods alone) and an increase in R0.
3.5. Ethanol gas sensing mechanism
Several possible factors are postulated to explain the possible reasons behind the gas sensing performance of the electrospun Pd:SnO2/PANI/P3HB nanocomposite sensor. One of the key factors strongly affecting sensing performance is morphology. The fibrous morphology of the nanocomposite possesses a large surface-to-volume ratio, accelerating the diffusion of ethanol gas molecules, and resulting in an improvement in sensing properties. Moreover, the presence of 1D Pd:SnO2 nanorods also plays an important role.
Secondly, the presence of the Pd dopant partly contributes to the ethanol sensing properties of the Pd:SnO2/PANI/P3HB nanocomposite. Thirdly, the enhancement of the protonation level of PANI in the Pd:SnO2/PANI/P3HB nanocomposite improves the interaction between ethanol molecules and the N+-H sites of PANI.
Finally, the decrease in the optimal operating temperature of the sensor to 80 °C may be explained in terms of the electron transfer from SnO2 to PANI, which forms a p-n heterojunction. In the nanocomposite, electrons in the SnO2 (n-type semiconductor) and holes in the PANI (p-type semiconductor) diffuse across the junction until balance is achieved, and a p-n heterojunction is formed at the interface. This p-n heterojunction between PANI and SnO2 in the Pd:SnO2/PANI/P3HB nanocomposite causes lower activation energy, attributed to the presence of the Pd dopant, facilitating easier adsorption of the ethanol gas molecules. Consequently, the sensor is responsive at a lower operating temperature [45].
Figure 10 depicts the ethanol gas sensing mechanism for the Pd:SnO2/PANI/P3HB nanocomposite. Before the sensor is exposed to ethanol gas, oxygen molecules in the atmosphere are adsorbed on the surface of the Pd doped SnO2 nanorods and trapped electrons from SnO2 to form oxygen ions (equations (6)–(9)). This phenomenon reduces conductivity,due to the formation of an electron depletion layer. On the other hand, the presence of the Pd dopant also plays an important role by producing more chemisorbed oxygen ions and contributing to the thickness of the depletion layer. It is presumed that the high baseline resistance of the nanocomposite is affected by the electron depletion layer around the Pd doped SnO2 nanorods, and the high level of polymerization of the PANI [57].


Figure 10. Schematic illustration of the ethanol gas sensing characteristics of Pd:SnO2/PANI/P3HB nanocomposite sensor. Reaction between ethanol gas and PANI is shown in the inset. (Adapted from Ref. [26, 42]).
Download figure:
Standard image High-resolution image
During the sensing reaction, the ethanol gas molecules adsorb at the available sites in the PANI and donate electrons to the conduction band of the SnO2 from LUMO level (lowest unoccupied molecular orbital) [58, 59]. The adsorbed ethanol molecules on the PANI may further react with chemisorbed oxygen ions at the surface of the Pd:SnO2 nanorods and transfer electrons. At the same time, ethanol gas molecules reactwith chemisorbed oxygen ions on Pd:SnO2 resulting in more free electrons, resulting in a subsequent increase in the conductivity of the sensor. It can be inferred that the combination of the electronic properties of p-type PANI and n-type Pd:SnO2 significantly improve the ethanol gas sensing properties of the nanocomposite.
4. Conclusions
In summary, a new SnO2 nanocomposite fiber sensor was successfully synthesised via the electrospinning technique, using SnO2 nanorod powder, polyaniline (PANI) and polyhydroxy-3-butyrate (P3HB), for the detection of ethanol gas. Three nanocomposite fiber samples, namely undoped SnO2/PANI/P3HB, Ni:SnO2/PANI/P3HB, and Pd:SnO2/PANI/P3HB, were synthesized and tested by exposure to 1000 ppm ethanol gas in N2. All the sensors exhibited sensing responses at operating temperatures as low as 80 °C. Of the three nanocomposite fibers sensors, Pd:SnO2/PANI/P3HB displayed the best sensing properties. Based on these results, it is concluded that the ethanol sensing properties of the Pd:SnO2/PANI/P3HB nanocomposite fiber sensor is mainly attributable to p-n heterojunction, the fiber geometry, and the 1D nanostructure of SnO2, as well as the presence of catalytic Pd. The development of nanocomposite fiber sensors in this study was primarily designed for the purpose of an improvement in ethanol sensing properties at a low operating temperature, in contrast to traditional SnO2, whichoperates at temperatures higher than 200 °C, as reported in other publications. These bio-nanocomposite fibers therefore potentially represent a breakthrough in biodegradable low temperature ethanol sensing applications.
Acknowledgments
This work was supported by the Fundamental Research Grant Scheme (203/PKIMIA/6711363) awarded by the Ministry of Higher Education (MOHE) Malaysia. The authors also wish to thank Ms. Shaik Ling Ang and Dr. Murugan Paramasivam from the School of Biological Sciences, USM for assisting in the electrospinning technique.