

Abstract
Motivated by the experimental synthesis of peanut-shaped carbon nanotubes (PSNTs) that combine the novel features of fullerene and carbon nanotubes (CNTs), we study the thermal conductivity of a PSNT (1dp08) and its response to different strains by using non-equilibrium molecular dynamics simulations and lattice dynamics together with density functional theory. We find that the thermal conductivity of the PSNT is reduced by more than 90% as compared to that of CNTs, and remains almost the same when different strains applied, exhibiting very different behaviors from that of CNTs, where the thermal conductivity decreases monotonically with the increase of strain. Through phonon mode calculations, we show that the reduced phonon group velocity, phonon lifetime and the vibrational mismatch are responsible for the low thermal conductivity of the PSNT, and the insensitive response of thermal conductivity to strain is due to the insensitivity of its phonon density of states and group velocity to strain. These features endow the PSNT with the potential applications in thermal devices, and add new features to one-dimensional carbon nanomaterials going beyond conventional CNTs.
Export citation and abstract BibTeX RIS
Introduction
Carbon allotropes have attracted a widespread attention in the last few decades. Due to the flexibility of its orbital hybridization, carbon can form various materials with their structures ranging from zero-dimension (0D) to three-dimension, exhibiting many fascinating properties, such as the extremely high Young's modulus of carbon nanotubes (CNTs) [1–3], the super-high carrier mobility in graphene [4–6], and the superhardness of diamond [7]. Among all these physical properties, the thermal conductivity is of particular interest because it can change in a wide range from 0.01 to 5000 W mK−1 or even higher [8]. For example, the thermal conductivity of fullerene nanofluid is 0.4 W mK−1 at room temperature [9], while that of some CNTs can reach 6600 W mK−1 [10]. Different from the high thermal conductivity of one-dimensional (1D) CNTs, another 1D carbon allotrope, named diamond nanothreads [11–13], exhibits low thermal conductivity of 55 W mK−1 [14]. Such a huge difference in the thermal conductivity of these carbon allotropes shows the possibility of tuning the thermal transport properties of carbon materials by changing dimensionality and morphology for different applications [15–19].
Fullerene C60 and its assembled thin films are well known carbon allotropes, from which other structures can be derived. For example, two fullerene C60 can form a peanut-shaped dimer proposed by Strout et al in 1993 [20], and synthesized by Onoe et al in 1999 [21], which has attracted a great deal of interest [22–31]. Further studies have shown that peanut-shaped dimers can be encapsulated in single-wall CNTs forming PSNTs [32, 33]. Later on Takashima et al [34]. found that a PSNT can be formed with its structural unit of P08 C120 isomer, called 1dp08, when pristine fullerene C60 films were irradiated by using electron beam with an incident intensity of 3 keV. PSNTs can be considered as a 1D assembly of fullerene C60 integrating the features of nanocage and nanotube, exhibiting the negative Gaussian curvature and the polarized charges [30]. These intriguing properties have stimulated many studies on PSNTs. For instance, the electronic and electron-transport properties and Peierls transition of PSNTs were studied by Onoe et al [35]. The electronic states of different PSNT models generated using Stone–Wales transformations were studied by Yusuke et al [31] The application of a metallic PSNT in capturing CO2 was explored by Zhao et al [36] However, no any studies on the thermal transport properties of PSNTs have been reported so far, which motivates us to carry out this study.
In this paper, we take one of these PSNTs, i.e. 1dp08 [34], as an example, to study its thermal conductivity and response to strain by using non-equilibrium molecular dynamics (NEMD) method combined with density functional theory (DFT). We further elucidate how the thermal conductivity of the PSNT is different from that of CNTs by choosing two CNTs with the chirality of (5, 5) and (9, 0), respectively, for comparison, because their diameters are close to that of the PSNT.
Computational methods
We use NEMDs method as implemented in the large-scale atomic/molecular massively parallel simulation molecular dynamics package to do the simulations with Tersoff potential for carbon proposed by Lindsay and Broido in 2010 [37]. This potential can well describe the thermal conductivity of many carbon-based materials, such as CNTs and graphene [38–40]. To have a fair comparison, we choose this potential to calculate the thermal conductivities of CNTs and PSNTs. The temperature is controlled by adding/subtracting heat at the heat reservoir/sink. Fixed walls are set at both ends of the structures. The thermal conductivities are obtained by using Fourier law:  where
where 
 and
and  are the thermal conductivity, heat flux and temperature gradient, respectively. In calculating the thermal conductivity using LAMMSP code, the simulation time step is set to 0.5 femtosecond (fs) and a large vacuum space of 100 Å is included along the transverse directions. The structures are first relaxed in NPT ensemble for 5 × 10⁶ steps, pressure in the length direction is set to be zero. Then, the structures are thermalized in NVT ensemble for 5 × 10⁶ steps at temperature of 300 K, and further thermalized in NVE ensemble for another 5 × 10⁶ steps until the system reaches its steady state. To get the steady temperature gradient, we first let the structures evolve for 1.0 × 10⁶ time steps, and then let them last for 1.9 × 10⁷ time steps.
For Young's modulus calculation, a large vacuum space of 100 Å is included along the transverse directions. The optimized Tersoff potential is used with a time step of 1 fs. Before the deformation simulation, the conjugate gradient method is used to do the energy minimization, and the structures are relaxed in NPT ensemble for 50 ps. The deformations along the axial direction are simulated at a strain rate of  s−1 at 300 K in NVE ensemble.
Energy band structure is calculated based on first principles calculations within the framework of DFT. The projector augmented gradient wave method [41] implemented in the Vienna Ab initio Simulation Package [42, 43] with the generalized gradient approximation [44] for the exchange-correlation functional formulated by Perdew–Burke–Ernzerhof is used. The energy cutoff is set to 500 eV, and the convergence criteria of total energy and force components are set to 0.0001 eV and 0.01 eV Å−1, respectively. A vacuum space of 15 Å is set perpendicular to the axial direction. A 11 × 1 × 1 Monkhorst–Pack K point mesh is adopted [45].
Spectral energy density analysis (SED) is used to analyze the relative contribution of phonons with different frequencies to the thermal conductivity [46–49], where the phonon normal modes can be written as
where  is the wave vector,
  represents the phonon branch,
  is the mass of jth atom,
  is the number of unit cells,
  is the velocity of jth atom located inside the lth unit cell (
 ), and
  is the eigenvector of phonon mode.
SED can be obtained by using the following equation:

In addition, the detailed expression of SED can be also written as

where  is the peak magnitude,
  is the frequency at the peak center, and
  is the half width at half-maximum. Phonon lifetime can be obtained by fitting the function
The mode dependent thermal conductivity can be derived from phonon Boltzmann transport equation under the relaxation time approximation [50, 51]

where  represent the thermal conductivity in the
  direction, phonon volumetric specific heat, and phonon group velocity, respectively.
  can be calculated by using
  where
where  is Boltzmann constant, and
  is system volume. By solving the dynamic matrices, we can get phonon dispersion curves. Group velocity can be calculated by
  where
where  and
and  denote eigenfrequency and wave vector, respectively.
Results and discussion
Geometry and band structure
The geometric structure of the PSNT, 1dp08, is plotted in figure 1(a). In NEMD simulations, the cross-sectional area is needed for calculating the heat flux. For the PSNT, the size of the cross sections is not equal to each other, as shown in figure 1(b). The average diameter is calculated to be 5.26 Å by using the maximum diameter (6.51 Å) and minimum diameter (4.01 Å). The physical diameter used in the calculations usually takes the value of the average diameter plus the van der Waals radius of two carbon atoms (3.40 Å). Therefore, the physical diameter of the PSNT is 8.66 Å. For comparison, calculations are also performed to (5, 5) and (9, 0) CNTs as their radial size is close to the average one of the PSNT. For (5, 5) CNT, the diameter is 6.58 Å, as shown in figure 1(c), while that of (9, 0) CNT is 7.10 Å. Therefore, the physical diameters for (5, 5) and (9, 0) CNTs used for our calculations are 9.98 and 10.50 Å, respectively.
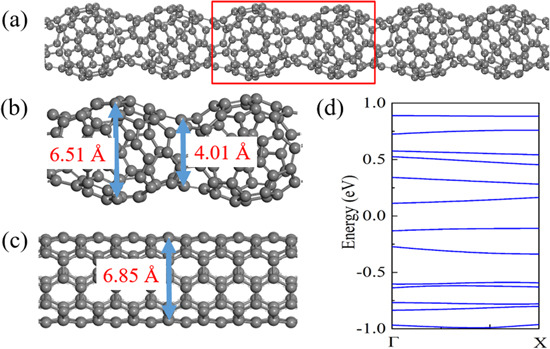
Figure 1. (a) Geometric structure of (a) the PSNT, 1dp08, (b) the structure unit of 1dp08, and (c) (5, 5) CNT. (d) Band structure of 1dp08.
Download figure:
Standard image High-resolution imageWe calculate the band structure of the PSNT. The unit cell contains 120 atoms and the results are plotted in figure 1(d). For the sake of clarity, we only plot the bands near the Fermi level with their energies in the range of −1.00 eV to 1.00 eV. The valence band maximum is −0.11 eV and the conduction band minimum (CBM) is 0.10 eV. One can see that the PSNT is a semiconductor with a band gap of 0.21 eV and (9, 0) CNT also exhibits a band gap of 0.07 eV, consistent with previous studies [52, 53]. Usually, in semiconductors, the lattice vibration makes dominant contribution to their heat transport. While (5, 5) CNT is metallic.
Thermal conductivity
To study the thermal conductivity of the PSNT and CNTs with different lengths at room temperature, we first calculate the temperature distributions along the heat flux direction of the PSNT and CNTs with the length of 50 nm. The results are plotted in figure 2(a), which shows that the temperature distribution has a linear relationship between the hot and cold ends, implying that the parameters that we set in the MD simulation is appropriate as the stable and linear temperature distribution is obtained. The nonlinear part at the hot and cold ends is caused by the edge effects, suggesting that the thermal transport is not fully diffusive. In order to avoid the edge effects, only the linear part is taken to calculate the temperature gradient. Following the same procedure, we also carry out the calculations for (5, 5) and (9, 0) CNTs, and plot the results in figure 2(a).
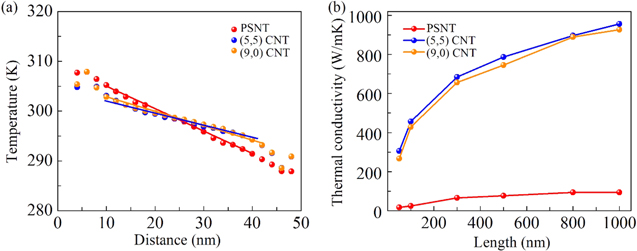
Figure 2. (a) Temperature profile, and (b) variation of the thermal conductivity with the size (length) for the PSNT, and (5, 5) and (9, 0) CNTs, respectively.
Download figure:
Standard image High-resolution imageWe then calculate the thermal conductivity. Usually, in NEMD simulation, finite-size effect happens when the size of a model is shorter than its phonon mean-free path [54, 55], consequently, its thermal conductivity is affected. Scattering occurring at the interfaces of the heat and cold ends account for such phenomenon. The thermal conductivity of the PSNT with length of 50, 100, 300, 500, 800 and 1000 nm is calculated to be 18.64, 23.96, 65.98, 75.98, 94.12 and 93.75 W mK−1, respectively, as seen in figure 2(b). The results show that the thermal conductivity of PSNT has reached a plateau of 94 W mK−1 with the length of 800 nm. For (5, 5) CNT, the thermal conductivities for the corresponding lengths are calculated to be 305.88, 457.14, 684.22, 786.68, 896.55 and 956.52 W mK−1, respectively. While for (9, 0) CNT, the corresponding values are 266.67, 428.62, 656.25, 745.72, 888.89 and 926.72 W mK−1, respectively. The results for CNTs are consistent with previous studies [56]. One can see that although the thermal conductivity for all the three systems increases with increasing the length due to the finite-size effect, that of the PSNT is much smaller than the corresponding values of CNTs. For instance, for the systems with length of 500 nm, the thermal conductivity of the PSNT is 75.98 W mK−1, which is only about one tenth of that of the CNTs.
It is interesting to note such a huge decrease in the thermal conductivity of PSNT compared with that of CNTs. This can be partially attributed to the fact that PSNT has negative curvature that can reduce the thermal conductivity by several orders of magnitude as found in other carbon structures [57]. In order to explore the reasons why the PSNT has such low thermal conductivity, as compared to the CNTs, we study the phonon properties. We first calculate the squared phonon group velocity and phonon lifetime for the PSNT, and the CNTs as well. The results are plotted in figures 3(a) and (b), respectively. Figure 3(a) shows that the square group velocities of the PSNT are much lower than those of the CNTs in the region from 10 to 50 THz, and most of the values are lower than 2000 m2 s−2. While almost half of the values of the CNTs are higher than 5000 m2 s−2. Figure 3(b) shows that the phonon lifetime of the PSNT is also much lower than that of the CNTs in most of the frequency region from 0 to 50 THz. For instance, the average phonon lifetime for the PSNT in low frequency region (0–5 THz), middle frequency region (5–30 THz) and high frequency region (30–50 THz) is 39.49, 3.11 and 0.96 picoseconds (ps), respectively. For (5, 5) CNT, the corresponding value is 51.61, 7.89 and 2.18 ps and for (9, 0) CNT, the corresponding value is 42.68, 8.08 and 4.56 ps, respectively. From the average lifetime in the different regions, one can see that the phonons with low and middle frequencies contribute more to the difference in thermal conductivity between the PSNT and CNTs. Especially in middle regions, the average phonon lifetime of the CNTs is about twice larger than that of the PSNT.
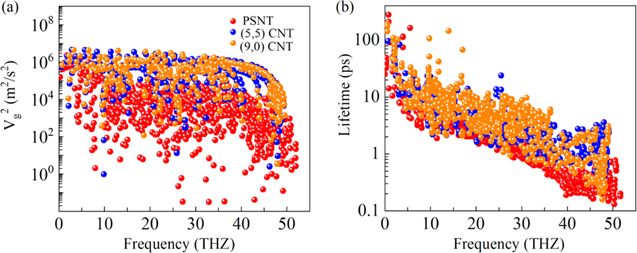
Figure 3. (a) Square group velocity, and (b) phonon lifetime versus frequency for the PSNT, (5, 5) and (9, 0) CNTs.
Download figure:
Standard image High-resolution imageWe next calculate the vibrational density of states (VDOS), which describes the frequency distribution of phonons by taking a Fourier transform on the atom velocity autocorrelation function [58, 59]. We choose two different regions for the PSNT and (9, 0) CNT, as shown in figure 4(a), to calculate their VDOS. The calculated results are plotted in figure 4(b). It is obvious that the VDOS of PSNT in the two regions are different from each other, especially, the peak of VDOS for region 1 has a right shift comparing to that of region 2 in the frequency range of 45–50 THz. However, the VDOS of the CNT in the two regions is nearly overlapped. We use the phonon population variation ratio to reflect the VDOS overlap by using the following equation [60, 61]:

where  and
and  represent VDOS of region 1 and region 2 in the structures. According to equation (5), the phonon population variation ratios of the two regions for the PSNT and (9, 0) CNT are calculated to be 0.04% and 0.01%, respectively, showing that the overlap of VDOS in the PSNT is less than that in the CNT, due to the more vibrational mismatch in the PSNT. Therefore, the heat transfer efficiency would be hindered more in the PSNT than that in the CNT because of the larger vibrational mismatch when heat flux travels across the two regions, thus resulting in the low thermal conductivity of the PSNT. Such phenomenon was also observed in other study [59].
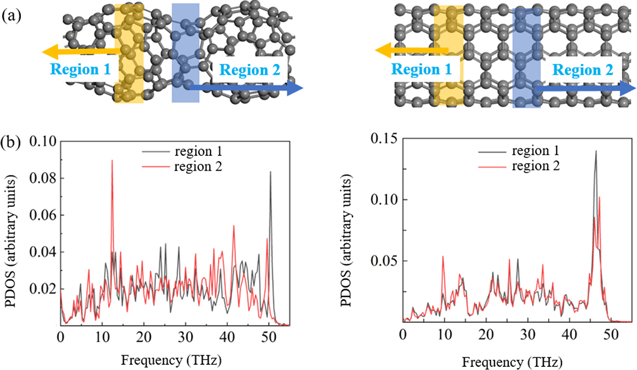
Figure 4. (a) Schematic diagrams of the two regions, and (b) VDOS for the PSNT and (9, 0) CNT.
Download figure:
Standard image High-resolution imageWe then calculate the Young's moduli to further understand the mechanism of the low thermal conductivity. Young's modulus is associated with the stiffness of atomic bonds in a material. Weaker interatomic bonding usually leads to smaller stiffness and Young's modulus. For materials with low Young's modulus, their interatomic bonding is often seen as 'soft bonding', which can result in low transport velocities of phonons, thus leading to a lower lattice thermal conductivity [62–65]. The stress–strain curves are shown in figure 5. The Young's moduli of the PSNT, (5, 5) and (9, 0) CNTs are calculated to be 0.56, 0.89 and 0.86 TPa, respectively, and the stress and strain remain linear relationship when strain is less than 10%. Note that the calculated Young's moduli for the CNTs are consistent with the previous results [66]. The smaller Young's modulus of the PSNT is one of the reasons accounting for the low thermal conductivity as compared with that of CNTs.

Figure 5. Stress–strain curves of PSNT, (5, 5) CNT and (9, 0) CNT.
Download figure:
Standard image High-resolution imageStrain-dependence of thermal conductivity
In practical applications, PSNTs cannot be in free state, and stress may exist due to the interactions with other parts in device. To see how sensitive of the thermal conductivity of the PSNT to strain, we study the thermal conductivity of the PSNT and CNTs when they are under uniaxial strains. We choose the length of 50 nm as an example to do the simulation. The strains are set as 1%, 3%, 5%, 7%, and 9%, their corresponding thermal conductivities of the PSNT are calculated to be 20.78, 21.40, 20.60, 19.78, and 17.40 W mK−1, respectively. Under strains, the thermal conductivities of (5, 5) CNT are 313.62, 308.92, 284.88 and 273.40 W mK−1, and corresponding values for (9, 0) CNT are 241.81, 231.91, 210.37 and 179.22 W mK−1, respectively. Obviously, very different from that of the CNTs, the thermal conductivity of the PSNT remains almost the same when under the different strains, insensitive to strain. For both (5, 5) and (9, 0) CNTs, the thermal conductivities decrease monotonously as strain increases. For clarity, these results are shown in figure 6(a).
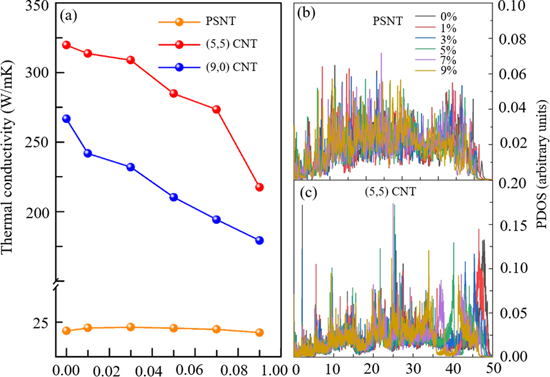
Figure 6. Thermal conductivity of (a) the PSNT, (5, 5) and (9, 0) CNT with the length of 50 nm versus strain. PDOS of (b) the PSNT and (c) (5, 5) CNT versus the frequency under different strains.
Download figure:
Standard image High-resolution imageTo understand the reasons why the PSNT and CNTs have different responses to strain, we first calculate the phonon density of states (DOS) for the PSNT, and (5, 5) CNT for comparison. The calculated results are plotted in figure 6(b) and (c), which show that the phonon redshift is unobvious for PSNT, different from the situation in the CNT. We then calculate the phonon dispersion for the two systems. For clarity, we only plot the results of phonon dispersion under strains of 0%, 5% and 9%, respectively in figure 7. For the PSNT, both the acoustic and optical branches do not have a decline trend in slope, suggesting that the phonon group velocity of the PSNT under different strains remains almost unchanged, leading to the similar thermal conductivities. The phonon dispersion curves of the CNT without any strain are highly dispersive for acoustic and optical branches, which is consistent with previous study [67]. The frequencies of optical branches decrease gradually when strain is applied, leading to the decrease of phonon group velocity, thus accordingly reducing its thermal conductivity. The change in acoustic branches is not significant.
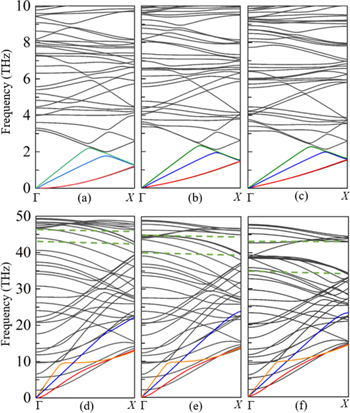
Figure 7. (a)–(c) Phonon dispersion of the PSNT under strain of 0.0%, 5% and 9%, respectively. (d)–(f) Phonon dispersion of (5, 5) CNT under strain of 0.0%, 5% and 9%, respectively.
Download figure:
Standard image High-resolution imageWe next calculate the phonon velocities of the PSNT and CNT under different strains. The results are plotted in figure 8. Figure 8(a) shows that the phonon group velocities of the PSNT under different strains are almost the same in the entire frequency region, leading to the insensitive response of the thermal conductivity to the strain. While from figure 8(b), one can see that the absolute value of phonon group velocities of the (5, 5) CNT decreases with the increase of strain. In the low frequency region (0–10 THz), the group velocities under strains of 0.0%, 1%, 3% and 5% are larger than 200 m s−1, while for the larger strains of 7% and 9%, the group velocities become lower than 200 m s−1. The phonon group velocity decreases as the strain increases. In the low frequency region, some phonon group velocities decrease as the strain increases, while the others exhibit opposite characteristic. This explains why the phonon branches do not have an obvious decline in their corresponding slopes. As shown in figure 6(a), the thermal conductivity decreases slightly when strain is below 3%, while the thermal conductivity decreases more sharply when strain is above 5%. One can see that the group velocities of (5, 5) CNT under strains of 0.0% and 1% are close to each other. While, the difference becomes larger when strain is above 5%, which is consistent with the trend of thermal conductivity.
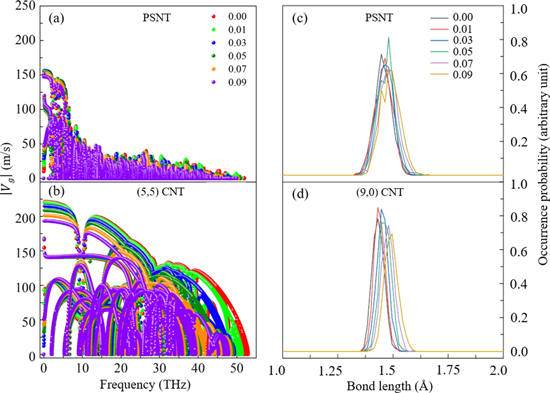
Figure 8. (a) and (b) Absolute values of phonon group velocities, and (c) and (d) occurrence probabilities under the different strains for the PSNT and CNT, respectively.
Download figure:
Standard image High-resolution imageThe response of thermal conductivity to strain can also be understood from the change of bond length. Previous studies showed that the thermal conductivity of CNT decreases with the increase of bond length induced by the applied tensile strain [68]. The deformation of a covalent bond includes the changes in bond length and bond angle. Here, we choose the bond length change for analysis. The bond length occurrence probabilities of the PSNT and (9, 0) CNT under different strains are plotted in figures 8(c) and (d), respectively, which show that the bond-length change to strain for the PSNT is less sensitive than that of (9, 0) CNT. The insensitivity of the bond-length change to strain in the PSNT is also one of the reasons that lead to the insensitivity of thermal conductivity to strain.
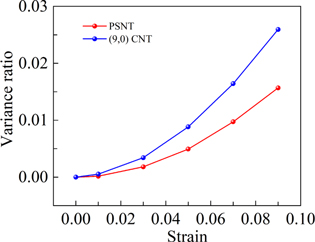
We further calculate the potential energies of the PSNT and (9, 0) CNT to examine their response to strain because the potential energy of a material is also related to its thermal conductivity. Figure 9 shows the relative variance ratio of potential energy for the PSNT and (9, 0) CNT versus strain. The variance ratio is defined as Es/E0, where Es and E0 are the total energies of a structure with and without strain, respectively. It is obvious that the potential energy of the PSNT is less sensitive to strain as compared to that of the CNT, indicating that the PSNT is less flexible for deformation. The flexibility can indirectly depict the degree of sensitivity of the thermal conductivity to strain.
Figure 9. Variance ratio of the potential energies of the PSNT and (9, 0) CNT versus strain.
Download figure:
Standard image High-resolution image
Conclusions
In this work, the thermal conductivity of a PSNT (1dp08) and its response to strain are studied for the first time by using molecular dynamics simulations combined with lattice dynamics and DFT. The thermal conductivities of the PSNTs with the length of 50, 100, 200, 300, and 500 nm are calculated to be 18.64, 23.96, 65.98 and 75.98 W mK−1, respectively, which are only about one tenth of those of the corresponding CNTs. A detailed phonon mode analysis reveals that the main reasons of the low thermal conductivity of the PSNT are the reduced phonon group velocity, reduced phonon lifetime and more vibrational mismatch, as compared with those of the CNTs. In addition, we have shown that the small Young's modulus, and the insensitive bond-length change and potential energy to strain of PSNT account for the insensitive response of its thermal conductivity to strain. These findings suggest that the unusual thermal transport properties of PSNT is induced by its unique geometry of peanut-shape distinguishing from that of CNTs. The low thermal conductivity of the PSNT and its insensitivity to strain add new features to 1D carbon family going beyond the conventional CNTs. This study provides an insightful understanding of the thermal transport properties of PSNTs that integrate the feature of cage and tube for potential technological applications.
Acknowledgments
This work is partially supported by grants from the National Key Research and Development Program of the Ministry of Science and Technology of China (Grant Nos. 2016YFE0127300 and 2017YFA 0205003), the National Natural Science Foundation of China (Grant Nos. 11974028 and 21773004), and is supported by the High Performance Computing Platform of Peking University, China. The authors thank the crew of the Center for Computational Materials Science, the Institute for Materials Research, Tohoku University (Japan), for their continuous support of the Hitachi SR16000 supercomputing facility. Y K is thankful to the support by AOARD for the grant of FA2386-18-1-4050.