

Abstract
The controlled manipulation and precise positioning of nanoparticles on surfaces is a critical requisite for studying interparticle interactions in various research fields including spintronics, plasmonics, and nanomagnetism. We present here a method where an atomic force microscope operating in vacuum is used to accurately rotate and displace CTAB-coated gold nanorods on silica surfaces. The method relies on operating an AFM in a bimodal way which includes both dynamic and contact modes. Moreover, the phase of the oscillating probe is used to monitor the nanoparticle trajectory, which amplitude variations are employed to evaluate the energy dissipation during manipulation. The nanoscale displacement modes involve nanorod in-plane rotation and sliding, but no rolling events. The transitions between these displacement modes depend on the angle between the scan axis direction and the nanorod long axis. The findings reveal the importance of mean tip-substrate distance and of oscillation amplitude of the tip. The role of substrate surface and of CTAB molecular bi-layer at nanorod surface is also discussed.
Export citation and abstract BibTeX RIS
1. Introduction
Current materials research very often involves the manipulation of matter on the nanometer and atomic scales. In this context, facilitating the exploration of the physical phenomena occurring during manipulation is of high relevance. Nanomanipulation studies have proliferated to a large extent over the last two decades due to the blossoming of scanning probe microscopy techniques. Thus, it is now feasible to precisely position nanometric or molecular objects on various surfaces. Recent achievements in this vast domain of nanomanipulation include atomic-scale functional systems [1], machines and motors [2, 3], chemical synthesis [4], or low friction [5].
In the last decade there has also been a substantial development in the field of nanoparticles. These are now easily available in a vast variety of flavors, with specific and often original properties, in fields as diverse as magnetism, catalysis, pharmaceutics, electronics, photonics or plasmonics. Whereas some of these properties do not require more than the particles being synthesized and stabilized (e.g. for catalysis, [6] pharmaceutics, [7] nonlinear optical processes, [8] imagery, [9]), it is sometimes mandatory to go further and organize the nanoparticles in 2D or 3D lattices for the desired effect to be obtained (e.g. for magnetism, [10, 11] plasmonics, [12–14] electronics, [15–17]) and for their successful exploitation in technological applications. Self-directed and templated organization of nanoparticles is a research field per se but still far from being mastered. As of today, the crux remains to predictively synthesize nanoparticles able to spontaneously self-organize [18–20] and/or to precisely direct or template their self-assembly by external forces. [21, 22], lithography and/or patterned surfaces [23, 24] in a given lattice with precise dimensions and symmetry. Having the possibility to alter organization on a smaller scale, to distinguish if the desired properties indeed are present, is therefore very useful [25]. In this respect, the use of an atomic force microscope (AFM) as a nanomanipulation tool [26, 27] opens outstanding possibilities in the fabrication and investigation of complex nanostructure architectures [28]. Due to its high precision and imaging resolution, an AFM can be employed to move, assemble and organize nanometer-scale particles on various surfaces, in both contact or vibrating (dynamic) operation modes [29–33]. To date, research in the field of nanomanipulation has provided various experimental procedures, all with the purpose of ensuring both high success rate and accuracy in displacement [34]. Some techniques even include external stimuli such as temperature, [35] electric fields, [36, 37] or the use of automatic manipulation sequences [38].
The choice of one or the other technique is mainly determined by the physical properties of the displaced nanoparticle, including its size and shape, supporting surface, and environmental conditions. Of particular interest, using an AFM as a nanomanipulator does not reduce to only displacing nanoparticles in order to build nanostructures, it also permits to investigate friction and wear phenomena emerging at the nanoparticle-substrate interface [39–44]. In this respect, with rare exceptions [29, 45, 46], a large majority of studies focused on ligand-free nanoparticles, and thus beneficiated of useful knowledge of atomic and nanoscale friction at solid–solid interfaces. When organic molecules are present at the interface, either adsorbed on the surface [27, 28], or bound to the nanoparticle [30, 31, 41] the situation can become more complicated as the molecules may act as glue or lubricant, and can be transferred to the tip. In this study, we present a manipulation procedure which allows a high-resolution displacement and rotation of individual nanorods (NRs) and discuss the beneficial role played by CTAB capping bilayer [47]. We show that the microscope feedback parameters and the tip-NR interaction type are essential parameters for the manipulation process. The oscillation amplitude adjustments in relation with AFM tip-nanorod interaction and the importance of the mean distance with respect to the surface are described. Other factors such as interfacial binding energy and tip energy dissipation are discussed in connection with the instantaneous amplitude and phase changes of the cantilevered tip. In addition, we demonstrate that changes of the phase sign can be used to establish the exact position where the interaction switches from repulsive to attractive, initiating the NR displacement because of the tip raster scan. Our findings bring unprecedented insights into the manipulation of NRs on surfaces, in particular by putting forward a dynamic-contact bimodal operation allowing a concomitant imaging and high-resolution manipulation.
2. Experimental details
The experiments were performed under high vacuum (10−6 Torr) and also at atmospheric pressure. The results did not reveal significant differences between both experimental conditions. Nevertheless, the main advantage of performing experiments at low pressures is a higher facility to displace the nanorods, which finally also translates in a longer preservation of a sharp tip apex. AFM probes were silicon cantilevers of stiffness of about 40 N m−1 presenting at the free end a pyramidal tip with an initial apex radius smaller than 10 nm. The first resonance mode presents a quality factor of about 660 in air and more the 5000 in high-vacuum. The substrates used for NRs deposition and manipulation were silicon wafers covered with a 200 nm thick oxide layer. NRs of about 120 nm in length, and 30 nm in diameter where employed and deposited on the wafer surface by spin-coating. After the deposition, the excess of organic ligands was removed by abundant rinsing with ethanol, deionized water, followed by N2 drying. This rinsing cycle has been repeated several times until large surface areas containing individual NRs were found by AFM imaging.
3. Results and discussion
In this section, we discuss the various aspects related to the nanomanipulation of individual NRs which have no close neighbors, nor have significant morphological defects, i.e. the isolated NRs marked in the image in figure 1(a), where the arrows and crosses indicate the trajectories and final positions respectively of five individual NRs (see also figure 4). The manipulation protocol of each NR starts in dynamic mode with the cantilever mechanically driven by a dither piezoelectric element. It is thus possible at this stage to acquire the topography of a desired area using the standard dynamic mode of the AFM, which involves keeping constant the oscillation amplitude of the cantilever (figure 1(b)). In order to switch to manipulation mode, both oscillation amplitude and reactivity of the feedback loop were gradually reduced until a threshold for NR displacement was reached. This threshold is reminiscent of peak static friction in tribology experiments with the marked difference that here, NR manipulation might include in-plane rotation and rolling around the center of mass of the NR.
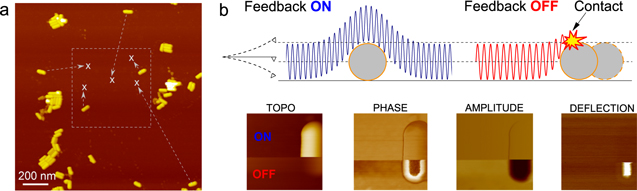
Figure 1. (a) Large-scale topographic image of gold NRs deposited on a silicon-oxide substrate. Arrows and crosses indicate the trajectories and final positions, respectively of five NRs that have been manipulated (for a post-manipulation image see figure 4). (b) Upper panel: schematic representing the manipulation procedure involving an oscillating nanoscale tip (not to scale) OFF. Lower panel: images acquired concomitantly while scanning an individual NR from top to bottom with respect to the image. The phase and deflection images demonstrate that the threshold for displacement has not been reached in this case, which is normal for the large amplitude used (see text). Amplitude image refers to as amplitude difference (A–A0) signal.
Download figure:
Standard image High-resolution imageA first finding is that the NR displacement occurs only after the tip remains in permanent contact with the NR, i.e. the oscillation amplitude reduces to zero (top right-hand side in figure 1(b)). To illustrate the role of the feedback parameters, we show the effect of reducing the feedback reactivity (OFF state), in the lower images of figure 1(b). To do so, the integral (IG) and proportional (PG) gain coefficients were respectively changed in the feedback loop. The variation of PG has only a limited effect on imaging and manipulation capacities (not shown). On the contrary, the IG coefficient, as expected, strongly impacts the tip-NR interaction strength. As can be seen, the topographic, phase, amplitude, and deflection images all present an abrupt transition when the feedback IG is reduced to zero. Moreover, while the topographic image might suggest that the NR moved, the phase, amplitude and deflection demonstrate, in fact, that no displacement occurred. We found that this is always the case if, before the cantilever tip reaches the NR, the oscillation amplitude set-point (A0) has been set to values larger than the NR height.
The oscillation amplitude set-point A0, i.e. the parameter that controls the time-averaged tip-sample distance represents the other adjustable parameter to initiate particle displacement. As a matter of fact, for a given constant driving frequency and amplitude, as well as normal IG value (i.e. non-zero), the tip approaches the surface when lower amplitude A0 is set. Thus, the time-averaged tip-sample distance can be made smaller than the NR height. As a result, when the tip scans over a NR and the IG value is set low, the instantaneous oscillation amplitude (A) reduces because of tip-NR interaction. The difference (A–A0), representing a measurement of tip-sample interaction (see amplitude image in figure 1(b)) can be recorded. Similarly, the phase and averaged deflection can also be acquired for further evaluation of the interaction intensity or energy dissipation. It is important to note that an issue generally resulting from turning off (or setting too low) the feedback loop gain is the loss of topographic information. Nevertheless, phase as well as amplitude imaging can be used for visualizing the displacement of the nanorod during manipulation. Figure 1(b) shows the four types of signals recorded for one nanorod: topography, phase shift, and amplitude difference, and deflection respectively. The measurements were realized under two different regimes, firstly (top of image) with feedback control ON and secondly (bottom) with an IG set to zero (feedback OFF). It can be seen that in the second case, the tip no longer follows the profile of the NR, resulting in a loss of the topographic signal. At this point, phase and signal amplitude can provide real-time visual information, which is useful for the manipulation. The real time visualization is important for a successful nanomanipulation, as first established in [28]. It is worth noting again that in the case presented in figure 1(b) there was no displacement of the NR, because of a large amplitude set-point (A0 = 380 mV).
3.1. Amplitude variation
The oscillation amplitude variation when IG is progressively decreased is shown figure 2, for an amplitude set-point A0 = 320 mV (also see figure S1, available online at stacks.iop.org/NANO/31/085302/mmedia). As mentioned before, with the feedback ON, the tip-sample distance is adjusted by the Z-piezo in order to maintain a constant A0. This forces the tip to follow the vertical profile of the encountered object, forming the topographic image. In this case, the signal in the amplitude image is absent and the NR is observed just as a fine contour at its periphery, as seen in the upper part of figure 2(a). A decrease of IG delays more and more the uplifting of the tip when scanning over the NR, thus inducing a larger interaction and hence amplitude decreases. For extreme IG values (near zero) the tip scans a straight parallel-to-surface-plane line, passing from constant amplitude mode to constant height mode. If the tip-substrate distance, which is proportional to A0, is initially set lower than the NR height, the transition from constant amplitude to constant height may determine a contact with the NR surface and a displacement, as discussed in detail below.
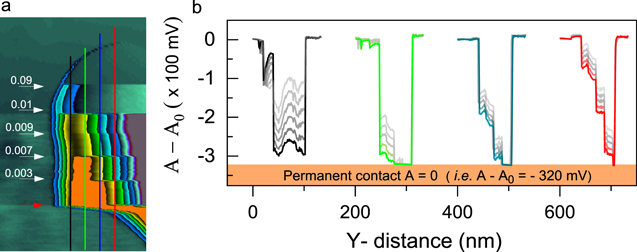
Figure 2. (a) Amplitude image (180 × 80 nm2) with contrast adjusted in order to highlight changes induced by IG reduction. Orange area shows the location where oscillation amplitude has vanished (A = 0). Parameters: A0 = 320 mV, initial IG = 0.9 at top part, fast scan direction from left to right. Arrows indicate the locations where IG value (white numbers) is changed. Red arrow shows the location where the NR starts displacing. Note that at the red arrow IG value was not changed. (b) Profiles along the vertical lines from (a). Dim curves are profiles taken few successive pixels before the vertical lines in (a), revealing the evolution of the signal. Note that the image captures the ascendant part of an NR when the tip 'climbs' on the NR. The orange zone from (b) marks the −320 mV threshold where the resonant amplitude vanishes.
Download figure:
Standard image High-resolution image3.2. Phase variation
The evolution of cantilever oscillation phase when changing the IG coefficient is shown in figure 3. The phase signal is given by the phase difference between the mechanical oscillation of the cantilever and the driving signal fed by the dither piezo. Figure 3(a) displays the phase image acquired simultaneously with the amplitude image from figure 2, allowing a direct comparison between them. The reference dither piezo phase was set in such a way that a positive signal in the phase image (bright contrast) corresponds to a repulsive interaction, whereas a negative phase signal (dark contrast) indicates an attractive one. For moderate reductions of IG, the phase in the upper part of the image in figure 3(a) shows a bright contrast (figure 3(b)). As expected, this is a consequence of tip-NR distance reduction inducing a repulsive interaction. Importantly, a further decrease of IG induces a change in the interaction sign, revealing a switching of the interaction to attractive regime exactly in the same area where A = 0 in figure 2(a) (orange zone). This finding is important and indicates that the tip now adheres to the NR while the X-scan continues.
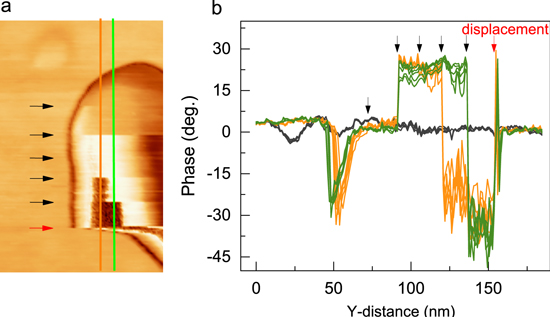
Figure 3. (a) Phase image (180 × 80 nm2) acquired simultaneously with amplitude image from figure 2. Black arrows indicate the positions where IG value was changed (also see figure 2 and figure S1). Note that the dark contrast area is very similar with the A = 0 (orange) area in figure 2. (b) Five profiles near the vertical lines from (a). Black curves correspond to profiles on the substrate. Red arrow shows the location where the NR starts displacing. Again, note that for red arrow the IG was not changed.
Download figure:
Standard image High-resolution imageTo further understand the role of tip-NR interaction which, strictly speaking, is mediated by the CTAB capping layer, let us discuss the importance of simultaneously looking at the amplitude and phase signals. At the cantilever resonant frequency, the amplitude is at its maximum value and any type of interaction decreases that value, regardless of the interaction sign. As seen before, the question of the sign is solved by looking at the phase signal. Nevertheless, the amplitude profiles (figure 2(b)), are also important for evaluating the exact oscillation damping for each IG value. Negative (A–A0) values mean smaller instantaneous oscillation amplitude A reflecting an increase of cantilever energy dissipation.
3.3. Contact zone and interaction type
The fact that A–A0 saturates at −320 mV (figure 2(b))—complete oscillation damping (A = 0)—indicates a strong localized interaction which is reproducible for all scan lines at the respective IG. While this suggests a tip-NR contact, it is not a definitive proof if one considers the narrow frequency bandwidth in which the amplitude is analyzed by the synchronous detection. However, a closer look at the amplitude variations (dim profiles in (figure 2(b))) shows a monotonous and progressive decrease of the amplitude as the tip passes over the NR, which proves a full linear behavior up to the contact, i.e. negligible bandwidth effects. Nonetheless, unambiguous demonstration of a tip-NR contact is provided by a sign reversal of the phase signal (figure 3(b)), which can only be explained by considering a change in interaction regime induced by the concurrence of tip-NR contact and X-scan. This adjoin effect also translates in an averaged cantilever deflection at the contact area as observed for instance in figure 1(b).
It is also of key importance to observe that the NR displacement is not immediate upon changing the IG value (lower back arrow) but that it only occurs after many scan lines towards NR termination. Note that such a displacement, as seen in figures 2 and 3, involves a reorientation of the NR, i.e. in-plane change of the NR long axis direction. This process is used each time a particular NR reorientation is needed. Nevertheless, if a full image area is subsequently acquired with such a low IG (0.003 in this case), the NR is fully displaced at the scanned area border, and its final orientation will be parallel with the slow scan axis (vertical orientation with respect to the image). This is a critical aspect when NRs have to be displaced for long distances on a precise, not necessary straight, pathway (see figure S2). Note that this manipulating protocol is different from the one used in [28] for smaller spherical nanoparticles, in the sense that we need to permanently settle the contact with a NR during the displacement, which can be explained by the larger size of our NRs, i.e. larger adhesion force. This difference is also at the origin of the fact that we need the additional phase and amplitude signals in order to index the NR displacement, while in [28] the remaining topography ghost signal has been sufficient because of the much smaller particle size.
The contact localization with respect to the NR height is also crucial for manipulation. We find that the contact (orange zone in figure 2(a)), corresponding to an attractive interaction (figure 3(a)), has to be around ¾ of the NR height. As stated before, this can be achieved by setting the initial A0 value. It is therefore instructive to evaluate the height of NRs under standard A0 imaging conditions. Here, the total height extracted from topographic images is around D = 40 ± 2 nm. This is in accordance with an estimate calculated by adding the mean NR diameter (30 nm) measured by electron microscopy to the thickness of the two CTAB bilayers covering the NR (2 × 5 nm). The contact zone in figures 2 and 3 starts at a height of 30 ± 4 nm above the substrate surface, value indeed larger than D/2 and smaller than D. In figure S1 we show the effect of IG for two A0 values: 380 and 320 mV, while scanning the same NR. For A0 = 380 mV the amplitude is about 31 nm (photodiode deflection sensitivity S = 82 nm V−1), which is already too high for manipulation (figure S1). Conversely, A0 = 320 mV—corresponding amplitude of 26 nm—is low enough to induce a tip-NR contact and an efficient NR displacement. Note however that these distances are a rough estimation of the mean tip-sample distance, which can be slightly different in reality, mainly because of the functional shape of tip-surface interaction potential. However, the maximum error is estimated to about ±5 nm. This nevertheless allows us to conclude that for an efficient manipulation the contact zone should be in the upper half of the NR, and not too close to the top side. As seen for instance in figure S1, when the contact is localized too close to the top part of the NR (380 mV case), the NR is not displaced; likely because of a weaker lateral force induced by the lateral X-scan.
Knowing the photodiode deflection sensitivity (obtained from independent measurements) and the cantilever force constant, allows the conversion of the (A–A0) signal into energy dissipation. Considering the short characteristic time scale at which phonons can dissipate energy at the NR-substrate interface, it is expected that before contact, the entire energy transferred from tip to NR at each oscillation, is dissipated before the NR is impacted again. This means that the NR does not move unless the transferred energy per oscillation exceeds the energy barrier for static friction. Moreover, as schematically depicted in figure 1(b), and also seen experimentally in figures 2 and 3, the amplitude progressively damps above the NR reducing even more the chance to induce a displacement. Similar conclusions were reached by Aruliah et al [48], when calculating the threshold power needed to move uncoated adsorbed nanoparticles, and also by Paolicelli et al [31] in the case of functionalized gold nanoparticles. If an initial oscillation amplitude of A0 = 320 mV (≈26 nm) would be completely damped in a single oscillation period, the maximum normal peak force would be of F ≈ 286 nN (with k = 11 N m−1), and the dissipated energy ΔE ≈ 7.4 × 10⁻¹⁵ J. Normalizing this value by a rough estimation of NR-substrate interface area (≈3 × 10³ nm2 within a JKR model) results in Δξmax = 2 × 10⁻¹⁸ J nm−2, which, interestingly, is two order of magnitudes higher than the surface energy of CTAB molecules (2 × 10⁻²⁰ J nm−2) [49]. It is also important to notice that the surface energy for CTAB is one order of magnitude lower than for SiO2 surface which is about 1 × 10⁻¹⁹ J nm−2 [50, 51]. This highlights the role played by the CTAB in facilitating the manipulation. However, Δξmax accounts for energy dissipation in the normal direction, being therefore only partially important for lateral displacement, as also found by Ritter et al [52]. Even more important, as seen in figure 2(b), the oscillation amplitude just before the displacement threshold is only of a few mV, reducing significantly the energy transfer. This drop of transferred energy, combined with a rather weak normal to lateral force coupling, explains why the NR remains immobile until the tipenters into contact. Then, indeed, static forces can be far larger but unfortunately hardly quantifiable in the present manipulation configuration where scan angles and contact localization vary incessantly.
3.4. Spatial resolution of displacement
The spatial resolution capability of the manipulation method can be estimated from phase or amplitude images recorded whilst performing the manipulation of individual NRs. As an example, figure 4 shows phase profiles along the fast scan axis after the displacement threshold has been reached. The profiles are extracted from the image shown in figure 3 (area below the red arrow). The profiles correspond to the last 24 nm horizontal scan, being hence evenly spaced by a vertical pixel size. The minimum value of the phase signal (around −40°) for each profile corresponds to the edge of the NR, and corresponds to the dark contrast in figure 3. The separation between the minima is about 1 nm, which is an estimation of the lateral spatial resolution in the manipulation. The reproducibility of this spatial resolution value is high as can be deduced from the consecutive eleven profiles plotted in figure 4. Although these displacement events involve rotations of the NR, movements of the center of mass of the NR are also expected. Indeed, the spatial resolution demonstrated in figure 4 is representative of the manipulation process, as a subsequent scan of the same area will align the NR at the edge of the imaged area, i.e parallel to the slow scan axis (Y-axis), as discussed in detail hereafter and also in Supplementary Information. Again, this indicates that the resolution in NR positioning is indeed high of the order of 1 nm, which is in fact close to the resolution achieved in imaging.
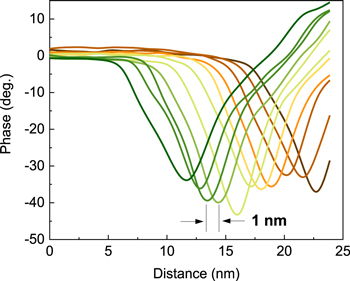
Figure 4. Successive phase profiles along the horizontal scan axis demonstrating the high spatial resolution of NR manipulation. The minima correspond to the edge of the NR, which progressively moves to the right after each scan line. The profiles are extracted from the lower part of the phase image displayed in figure 3.
Download figure:
Standard image High-resolution imageThe fact that individual NRs can be rotated in the surface plane enables the possibility of positioning the NRs in various angular configurations one with respect to the other. As an example, figure 5 shows several configurations for the same NRs, obtained by subsequent manipulations of the NR from left-hand side. In order to reveal the angular resolution of our manipulation method, the long axis of this NR is labeled with a green line, whereas for the sake of comparison a reference vertical line passing though the center of the NR is shown by a red line. The numbers represent the angle between the two lines in each image. Angular differences as low as 1° can be observed, demonstrating the angular precision of the manipulation procedure. Note that to obtain the final L-shape structure, the second NR was also rotated and displaced as indicated by the white arrows.

Figure 5. Height images acquired after different manipulation sequences of the NRs. Green lines show the long axis of the NR from left-hand side. Red lines are vertical lines traced through the center of the NR. The angles indicate the orientation of the NR axis with respect to the vertical axis, in each image. White arrows show the manipulations of the second NR.
Download figure:
Standard image High-resolution image3.5. Absence of rolling motion
Figure 6 shows phase images of two nanorods before and after manipulations. The white arrows indicate the manipulation trajectories while the red ones show some minute defects at the nanorod surface (mostly seen in phase images). The fact that these defects are not changing their positions it is a clear indication that the nanorods only slide during the manipulation, and that rolling is not involved. This conclusion holds for both linear translations as well as for rotations. Figure S3 is another example, where the same conclusion can be drawn, although a far larger manipulation distance is concerned. Rolling versus sliding motion of a NP being pushed by an AFM tip has been modeled by Evstigneev et al [53]. Hence, our observations are consistent with their conclusion, namely that rolling motion requires a corrugated surface, whereas our surface is smooth and moreover lubricated by CTAB molecules. Also note that our tip radius (RT ∼ 20 nm) is comparable to or potentially larger than the NR radius (RP ∼ 15 nm). Rolling of the nanorods is therefore not favorable energetically.
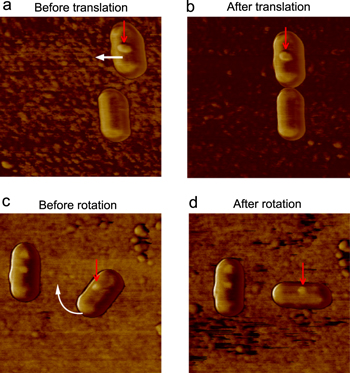
Figure 6. Phase images acquired with standard parameters for imaging, demonstrating no rolling effects. The defects marked by red arrows are always imaged at the top of the nanorod. The white arrows in (a) and (c) show the manipulation of the respective NR, in order to obtain the configuration from (b) and (d).
Download figure:
Standard image High-resolution image3.6. Example of high-resolution manipulation
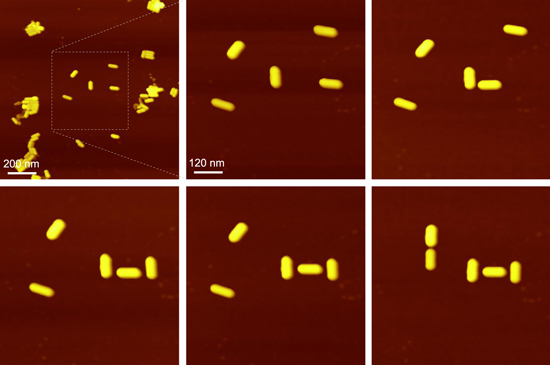
An example of manipulation on several NRs is shown in figure 7 (also see figure S4). In addition to the amplitude and IG parameters discussed previously, a full control of distance and pathways of an NR was obtained by adjusting the size of scanning area and orientation of fast scan direction with respect to the long NR axis. As already mentioned, a perpendicular fast scan direction (X-horizontal image axis) with respect to the NR long axis prevents the NR rotation. This is crucial for precise displacements and small-angle orientation, as exemplified in figures 7(b)–(f). For long distance manipulations the tip is positioned in such a way that the NR appears at the border of the scanning area. This is done by setting an X-offset to scanning area and an appropriate scan angle (also see figure S2). The displacement of the NR in a particular direction is then obtained by increasing the X-offset with an increment lower than the diameter of the NR. This increment is important for high-resolution manipulation being in our case defined by the X and Y-piezo displacement resolution which is in the sub-nanometer range. In this way, we found, as discussed above, that displacements of the order of 1 nm, and rotations as fine as 1° can be performed on individual NRs. This, along with the fact that NRs can also be manipulated in a controlled way on long distances represent a important advantage for further construction of planar complex nano-particulate architectures.
Figure 7. (a) Topographic images of Au nanorods after an initial manipulation (see figure 1(a)). The positions of NRs within the square correspond to the x markers in (figure 1(a)). (b)–(f) Images acquired after nanometer scale rotations and displacements of individual NRs, demonstrating a high resolution in nanomanipulation.
Download figure:
Standard image High-resolution image
4. Conclusion
In conclusion, we presented an AFM manipulation technique allowing the manipulation of NRs on surfaces with a high degree of resolution. The technique is based on precise adjustments of AFM-probe oscillation amplitude and on subsequent alterations of electronic feedback loop controlling the tip-NR distance up to contact. The manipulation protocol was established by carefully controlling the oscillation amplitude, feedback loop gains, scan angle, and scan direction. Altering these parameters allows monitoring the amplitude and phase variations which helps predicting and controlling the displacement pathways with high precision. These findings provide a fresh insight into single nanoparticle manipulation on surfaces and likely confer a new thrust in the study of interparticle interactions. In a broader picture, the precise manipulation of nanoscale object is becoming ubiquitous since it allows to fabricate structures unfeasible by other means and to characterize their physical properties at the same scale. Improving the ease and precision of such a technique therefore seems of interest in many research fields.
We thank C B Murray and X Ye for providing us the initial nanorods solutions and N Beyer for technical assistance. This work is supported by ANR METABIP (12 BS10 003 01), ANR OH-RISQUE SMARAGD (14 OHRI 0008 01), EOARD (FA8655-13-1-3001) and partially by ANR-11-LABX-0058-NIE within the Investissement d'Avenir program ANR-10-IDEX-0002-02.