

Abstract
Three-dimensional (3D) ordered construction of nanoparticles (NPs) has attracted much attention in wide applications, however, techniques with respect to cost effective nanofabrication of well defined functional architectures is still lacking. To address this specific issue, a bio-interface confinement approach is proposed that precisely replicates the complex cellular structural features of microbes and integrates silver NP (SNP) building blocks into their 3D framework in a precise, low cost and mass production way. Herein, the SNPs with nanospheres and nanosheets structure were synthesized by way of electroless deposition using Spirulina as template. Results showed that SNPs were orderly assembled along the cellular structure, and the spatially confinement of cellular texture induced the transformation of SNPs from sphere to flake morphology during their continuous growth. The silver assembly not only shows good antibacterial activity, but also exhibits excellent surface enhanced Raman scattering (SERS) performance with the enhancement factor as high as 5.95 × 10⁸ and good recuperability towards Rhodamine 6G. The fascinating SERS performance can be ascribed to the combined action of nanosheets morphology of SNPs, hierarchical nanostructure of the cellular structure, and the small interparticle spacing. This strategy provides an effective strategy for controllable and ordered 3D assembly of NPs by using the cellular texture.
Export citation and abstract BibTeX RIS
1. Introduction
Noble metal nanoparticles (NPs) have received considerable attention because of their unique physicochemical properties and wide application prospect in biotechnology, optoelectronics, sensing and catalysis [1, 2], etc. Among the noble metal NPs, silver NPs (SNPs) exhibit unique optical, electrical, and antibacterial properties that are significant interest in applications including yet not limited to surface enhanced Raman scattering (SERS) [3], electronics [4], and antibacterial [5]. Employing the SNPs as building blocks to assemble desired architecture is of special relevance for practical applications, and displays a major thrust in SNPs research [5–8]. Specially, the unique properties of SNPs are closely related to their size, shape, and density, etc. For instance, SNPs with sub-10 nm size and highly dispersion exhibit excellent antibacterial activity, whereas, large size up to dozens of nanometers of SNPs or their aggregates with sub-10 nm interparticle spacing between them contribute to their high SERS activity [9–11]. In addition, the high density of active sites or hot spots created by SNPs are also the key factors for improving the antibacterial activity or the signal uniformity of SERS, respectively. Moreover, compared to one-dimensional (1D) and planar structures, three-dimensional (3D) construction offers the advantage of more active sites or hot spots, as well as high operability and recuperability in practical utilization [12–14]. Therefore, synthesis and organization of SNPs into 3D controlled geometries on the nanoscale furnish massive opportunities for tuning their properties and enhancing the performances.
However, techniques limitations with respect to flexible and cost effective nanofabrication of well defined functional architectures still exist because a method of combining all the major factors mentioned above is still lacking [10, 15, 16]. Although the top-down approaches based on lithography can yield high controllability in the fabrication of nanostructures, high-resolution is stalled by the limitations of the technical complexity, high cost, and time-consuming. Though different template substrates (i.e. block copolymer [17, 18] chemically or topologically patterned surfaces [14, 16]) have showed great potential to solve this problem, yet the indispensable preparations of these template substrate are cumbersome and time-consuming [19].
By contrast, the biotemplate-based nanofabrication technology (e.g. bio-macromolecule [20, 21], microorganism [22], plant [23], insect [24], etc) can circumvent the complex equipment and laborious procedures for constructing the template [25–27]. Among the biological systems, microorganism template (i.e. Virus [28, 29], Diatom [30], Bacteria [4, 31]) offers the advantage of natural micro dimensions, regular shape and low cost mass production [32]. A large number of them have been utilized to conduct the deposition and assembly of NPs into functional materials [28, 33–36]. However, most related works were mainly focus on the utilization of the template surface, either to fabricate the 1D NPs assemblies (e.g. Virus-assisted noble metal nanoclusters, nanowires [28, 29, 34, 35], nano array and nanostructures [33]), or the surface topography oriented 3D assembly (e.g. Diatom-derived 3D nanostructures [30] and Bacteria-template 3D hollow structures [37–39]). In contrast to the morphology utilization, the natural hierarchical structure of inner cellular space is superior for the high precision, multi-level (micro/nano), and multi-dimensional fabrication [40]. In order to integrate SNP building block into their 3D framework with tunable properties in a precise, low cost and mass production way, herein, a bio-interface confinement approach is proposed that precisely replicates the complex cellular structural features of microbe. Previously, we have demonstrated that the cell pretreatment by hydrochloric acid is responsible for the NPs entering into the cell [40]. However, the acid treatment process caused damage to the cellular structure, resulting in a disordered dispersion of metal NPs. In order to maintain the intracellular hierarchical structure, while enhance the cells' permeability, so as to explore the internal cell structure of microorganism for the ordered assembly of NPs, a suitable cell permeability processing is of great importance.
In this paper, we realize the ordered assembly of SNPs inside the Spirulina, and the morphology of the SNPs can be tuned from nanospheres to nanosheets under the spatially confinement of the cellular texture of Spirulina. A moderate freeze-thaw process was applied to the Spirulina template in advance. In contrast to the previous work [40], this process leads to the improvement of cell wall permeability without destroying the original integrity of cellular texture, which provide a precondition for the ordered assembly of NPs along the cellular texture. Then the catalyst seeds penetrated into the cell and adsorbed on the cellular texture, the consequent electroless deposition allowed the SNPs nucleate onto them and form spherical particles; with the deposition time incrementing, the SNPs further selectively grow along the (111) crystal surface into nanosheets under the spatially confinement of the cellular texture, resulting in the 3D assembly of silver nanosheets with extremely small interparticle spacing. The antibacterial and SERS properties of these SNPs assembly were also studied. Typically, the small silver spherical NPs show better antibacterial activity towards S. aureus, whereas the larger silver nanosheets exhibit remarkable SERS enhancement for Rhodamine 6G.
2. Materials and methods
2.1. Materials
Spirulina were offered by Kang Sheng Algae Co., Ltd Silver nitrate, sodium hydroxide, glucose, tartaric acid, palladium chloride, sodium hypophosphite monohydrate, and all other chemicals were purchased from Sinopharm Chemical Reagent Co., Ltd (China) and used without further purification. Staphylococcus aureus (S. aureus) were purchased from General Microbiological Culture Collection Center (Beijing, China).
2.2. Assembly of SNPs within the cells
The fresh Spirulina were treated with 2% glutaraldehyde at 4 °C for 6 h for the fixation of the cells and tissues. After been rinsed with pure water, the fixed Spirulina were treated by a freeze-thaw process (−50 °C to room temperature) to improve the cell permeability, then they were activated by the colloidal palladium (the detailed activation process can be found in table S1, supporting information is available online at stacks.iop.org/NANO/30/495704/mmedia). The above procedure endows the templates with catalytic activity for the following silver deposition. Then, the electroless deposition process was used to synthesize the SNPs. The detailed compositions of reducing agent and silver-ammonia salt solution can be found in the table S2. In brief, the wet activated Spirulina (1 g) were dispersed in the reducing agent solution (100 ml) first, and then the silver-ammonia salt solution (100 ml) was added dropwise, during which the samples were filtered at the reaction time of 15, 30, 60 min, and then washed and stored in ultrapure water.
2.3. Characterization
The fixed original Spirulina and the as-prepared samples were dehydrated with graded ethanol. Then a scanning electron microscope (SEM, Hitachi SU-8010) operated at 10 kV was applied to observe their morphology, and element mapping was performed to analyze the main elements. Some dehydrated samples were embedded in Epon 812, and then were sectioned using a leicaultra microtome; after stained with uranyl acetate for 1 min, the sections were picked up on the 200 mesh copper grid. The morphological feature of Spirulina-templated silver assembly was observed by the transmission electron microscopy (TEM, JEM-1400) and high-resolution TEM (HRTEM, JEM-2100F). The gap distribution of the SNPs was determined from 100 particles and viewed from TEM images. The content of SNPs in the assembly were measured by inductively coupled plasma optical emission spectrometry (iCAP-6300) after the assembly were dissolved in 10% HNO3.
2.4. SERS performance
The Raman measurements were performed on a laser confocal Raman spectrometer (Horiba Co., HR-800), using a laser beam with an excitation wavelength of 633 nm. The incident power was 1.7 mW, and the laser spot area was ∼1 μm in diameter. The data acquisition time was 10 s for one accumulation. Before the test, the samples dispersed in ultrapure water were filtered and collected by the needle cartridge filter (0.22 μm, 10 mm), and then dried. For the SERS measurement, different concentrations ranging from 1 × 10⁻⁸ to 1 × 10⁻¹⁶ M of 20 μl R6G solutions were dropped onto the as-prepared discs with an area of 78.5 mm2, and then dried under ambient conditions before tests. For recycling usage, the as-used substrates were soaked in 100 ml of ethanol solution several times to eliminate R6G residuals and dried in air for next cycling SERS test.
2.5. Antibacterial test
To examine the antibacterial activity of the samples, the common pathogenic bacterium S. aureus was used as the model bacterial. Luria-Bertani medium was used for the growth of S. aureus. The bacteria-inoculated solutions were incubated in a shaking incubator at 37 °C. After an overnight culture, the concentration of the bacteria suspension reached between 1 × 10⁵ and 1 × 10⁶ CFU ml−1. For the inhibition zone test, 200 μl bacterial suspension was spread over the surface of the agar plate to form a uniform bacterial film. 3 mg silver assembly was spread into circular discs (10 mm) using the needle cartridge filter (0.22 μm, 10 mm), and spherical SNPs (3 mg) were dropped on the filter paper (10 mm), and then they were placed on the S. aureus-cultured agar plates. The agar plate was then incubated in a static condition for 24 h at 37 °C. After incubation, the diameters of the inhibition zones were measured.
The minimum inhibitory concentrations (MIC) of silver assembly were studied using tube turbidity method. The releasing of silver ions from silver assembly and spherical SNPs were measured by ICP analysis. In brief, different amount of silver assembly and spherical SNPs were immersed in 6 ml sterile nutrient broth, respectively, and inoculated with 60 μl freshly grown S. aureus, and then incubated at 37 °C and 200 rpm. The ultraviolet–visible (UV–vis) spectra of the bacterial cultures were performed on a Hitachi U-4100 spectrophotometer at 600 nm for 28 h at defined time intervals. The growth of S. aureus in the culture medium with Spirulina was used as the negative control. The data were recorded by measuring the average value of at least four independent measurements. For the growing colonies, the growing bacteria were collected to perform 20-fold serial dilutions in 1 ml of PBS. 200 μl of each dilution were spread over the surface of the agar plate for 24 h incubation.
3. Results and discussion
3.1. Preparation and characterization of silver assembly
The assembly process of the silver nanosheets spatially confined by the cellular structure of Spirulina is shown in figure 1. The intracellular ultrastructure of Spirulina generally consists of nucleoid, layered thylakoid, polyhedral carboxysome, etc (figure S1, figure 1(a)). These highly ordered cellular texture can serve as the supporting base for the assembly of NPs. Since the cell wall of the Spirulina is relatively compact (as shown in figures S2(a) and S3(a)), a moderate freeze-thawing treatment was applied to increase their permeability before the activation process. As shown in figures S2(b) and S3(b), cracks appeared on the outer wall of the freeze-thawed Spirulina, which offered the flow channel for the palladium 'seeds' penetrating into the cellular body. As expected, the texture of cellular bodies, such as nucleoid, layered thylakoid, polygonal carboxysome were well retained after permeability treatment, as shown in figures 2(a1)–(a4). Owing to the organic-inorganic interaction, the entered palladium seeds were orderly arranged by these cellular textures (figure 1(b)), which would further serve as catalytic sites for the silver deposition (figure 1(c)). Finally, the SNPs would in situ grow into nanosheets under the spatially confinement of the cellular texture (figure 1(d)). The as-prepared silver assembly inherited the internal body structure of Spirulina, and exhibited excellent surface enhanced Raman scattering (SERS) performance towards Rhodamine 6G (figure 1(e)).

Figure 1. Schematic illustration of the assembly process of silver nanosheets spatially confined by the cellular texture of Spirulina, and their SERS test. (a) The cellular structure of Spirulina, (b) the freeze-thaw treatment and followed by the activation with palladium seeds, (c) silver nucleation and growing along the texture of cellular bodies, (d) the silver NPs grow from nanospheres into nanosheets under the spatially confinement of cellular structure, and (e) SERS activity test of Rhodamine 6G.
Download figure:
Standard image High-resolution image
Figure 2. Cross sectional TEM images of (a1)–(a4) Spirulina, (b1)–(b4) SA-15, (c1)–(c4) SA-30, and (d1)–(d4) SA-60. The insets in (a1)–(a4) modeling the ultrastructure of overall cell interior, nucleoid, carboxysome, and thylakoid, respectively. The insets in (b2), (b4), (c2), (d2) show the assembly schemes of silver NPs confined by the observed ultrastructures. The golden dots represent the silver NPs. The inset in (d4) shows a single silver nanosheet in the SA-60.
Download figure:
Standard image High-resolution imageThe cross sectional TEM images confirmed the cellular texture derived assembly of SNPs. The as-prepared silver assembly under different reaction time were denoted as SA-X, X represents the reaction time (min). As shown in figures 2(b1)–(b4), the synthesized NPs were uniformly dispersed within the cellular space (figure 2(b1)). Notably, under the strong organic-inorganic interaction of biomolecule towards the SNPs, the NPs were tightly attached to the cellular texture, forming the organism-metal hybrids with regular morphology. Typically, the SNPs were assembled into reticular structure under the confinement of nucleoid (figure 2(b2)), whereas, they were organized into parallel NPs alignment by the thylakoids (figures 2(b3), (b4)). The density of SNPs can be controlled by adjusting the concentration of the colloidal palladium, which was shown in figure S4, lower concentration of the colloidal palladium solution lead to the sparse SNPs. The optimal concentration of the colloidal palladium was 2 mM, which result in a dense, yet well-dispersed SNPs. These results confirm the site-selective nucleation of SNPs under the catalysis of palladium seeds.
With the reaction proceeds, the ordered assembly of SNPs along the cellular texture became increasingly apparent (figures 2(c1)–(c4)). Due to the large contrast between the cellular body and the SNPs, the cellular texture was unable to be imaged in the TEM images, however, they can be distinguished by the assembling patterning of SNPs. As shown in figure 2(c2), the silver assembly with polyhedron morphology suggest the confinement of the carboxysome. Along the thylakoids, the SNPs were assembled into denser parallel queues (figure 2(c3)). Because the cutting direction is random relative to the thylakoids, queues of SNPs show various widths in the plane view. It can be inferred that, from the view of perpendicular to the lamella of the thylakoids, the queues of SNPs were linear, otherwise, the assembly of SNPs shows stripe-like patterns with different widths, as shown in figure 2(c4). Moreover, it can be concluded that the SNPs were organized into the lamellar sheet-like assembly in the cell space under the confinement of thylakoids. The results prove that the employed procedure succeeds in the replication of the cellular inner structure by the SNPs.
Increasing the reaction time resulted in growing the size of the SNPs, and the interparticle spacing was thus reduced accordingly with the continuous growth of SNPs (figure 2(d1)). As expected, the NPs were still orderly assembled by the cellular texture, such as thylakoids-derived silver nanolayers, as shown in figures 2(d2), (d3). Notably, the enlarged image show that the SNPs have nanosheets morphology (figure 2(d4), and the corresponding inset image). The results confirm that the cellular texture not only provides a supporting base for the ordered assembly of NPs, but also confines the growth of SNPs.
Under the guidance of the cellular texture, the morphology of SNPs transformed from nanospheres to nanosheets with the deposition time incrementing. In addition, the average gap length between the adjacent SNPs in figure 2(d4) was measured to be around 3.4 nm (figure S5). Assembling of NPs with uniform sub-10 nm gaps has been difficult by using conventional methods [41]. Benefit from the layered nanostructures of the thylakoid, the obtained conformal silver nanolayers with small particle spacing offer opportunity for exhibiting strong electromagnetic coupling, which may contribute to the enhanced electronic and optical properties [42, 43]. The content of SNPs in the process of silver assembly were studied by ICP analysis, and the loading efficiency is calculated to be 8.4, 23.7, and 50.3 wt% for SA-15, SA-30, and SA-60 assembly, respectively.
In order to further explore the growth mechanism and the crystallinity of SNPs, HRTEM were conducted. As shown in figures 3(a), (b), the lattice fringe of a single spherical NP in the SA-15 with a twin plane can be clearly distinguished, and the lattices spacing were measured to be 0.19 nm and 0.23 nm for the palladium and the silver, respectively. The corresponding fast Fourier transform (FFT) reflected the (200) crystalline plane of the palladium, as well as (111), (200), (220), and (311) crystalline planes of the face-centered cubic structure of silver (figure 3(c)). As for the SA-30, the NP showed shuttle shape, and the edge of NP showed high transparency compared to the middle part (figure 3(d)), indicating its sheet-like morphology. The lattice spacing is measured to be 0.23 nm, corresponding to the (111) crystalline plane (figures 3(e), (f). Figure 3(g) shows a typical HRTEM image of nanosheet grown in the SA-60. The partial enlarged image at the edge of the nanosheet shows the lattice spacing of 2.5 Å (figure 3(h), which corresponds to Bragg diffraction from 1/3 (422) lattice planes. The corresponding fast Fourier transformation (FFT) reveals two sets of 6-fold symmetric spots, and are well arranged in a hexagonal pattern (figure 3(i)). From the measurements of spot spacings, we identify the spots as (220) and 1/3 (422) Bragg reflections.
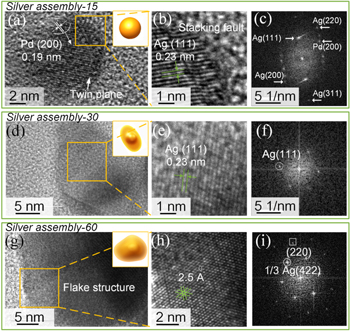
Figure 3. (a), (d), (g) The HRTEM images of the silver NPs in the SA-X, X is 15, 30, and 60 min, respectively. (b), (e), (h) The magnified images of the outlined yellow square in panel (a), (d), (g), respectively. (c), (f), (i) The fast Fourier transform pattern from the single NP in panel (a), and the nanosheet structure in panel (e), (h), respectively.
Download figure:
Standard image High-resolution imageIt should be noted that the 1/3 (422) reflection is forbidden in typical fcc structure, but has been observed in electron diffraction patterns of sheet-like silver nanocrystals [44, 45]. The 1/3 (422) forbidden reflections at the edge of the silver nanosheet can be ascribed to the (111) stacking faults lying parallel to the (111) surface. It is worth noting that the Ag (111) diffracted spot displays stronger intensity, indicating 111-oriented silver crystals are predominant in the silver assembly. Biomolecule composed of different functional groups have been reported to have different binding affinities with silver surface [45–47]. For example, Li et al demonstrated that the silver nanoplates with different morphologies can be controllably synthesized by using different binding affinities of DNA bases with silver crystal faces [45]. It is known that the cellular structure is composed of biomolecules, such as protein, which is rich in abundant functional groups. Thus, it can be concluded that the functional groups at the interface of SNP and cellular structure played a role in the selective deposition of silver atom on the (111) crystal orientation. In addition, the stacking fault across the (111) plane was found running along the growth direction (figure 3(b)), which presumably induced by the spatially confinement of cellular texture. Therefore, due to the crystal mismatch of twined particles (as shown in figure 3(a)) and selective binding of functional groups with silver crystal faces, silver atoms prefer to deposit on the (111) crystal orientation, forming the nanosheets structure. These results confirm that the transformation mechanism of silver sphere to silver nanosheets is ascribed to the synergistic effect of stacking faults of twined particles, and the organic-inorganic interaction with biomolecule toward the silver surface.
3.2. SERS detection of R6G Dye
The silver assembly with rational size, shape, and aggregation were reported to have excellent SERS enhancement effects [16, 48, 49]. Herein, a series SERS experiment were carried out by using the rhodamine 6G (R6G) as the probing molecule to evaluate the SERS performance of the as-prepared samples (figure 4). As shown in figure 4(a), 20 μl R6G solutions dropped on the silver assembly, forming an area of 78.5 mm2. Raman intensity of R6G on SA-15 substrate was weak (figure S6). In contrast, the distinguishable characteristic peaks of R6G were clearly identified for the SA-30 deposited with R6G at 10−8 M concentration, as shown in table S3. The Raman signal can be influenced by the morphology and aggregated states of SNPs, both of which decide the molecule's surface orientation [50, 51]. Therefore, some peaks (e.g. 611, 1310, 1363, 1508 and 1649 cm−1) were obvious while others are weak (figure 4(b)). The SERS signal intensities decrease accordingly with the decreasing concentration of R6G. It still displayed the main characteristic Raman peaks over 611 cm−1 under a lower concentration of 10−10. With further decreasing the concentration to 10−11, the SERS sensitivity of the silver-assembly-30 turned out to have no obvious or identified peaks.
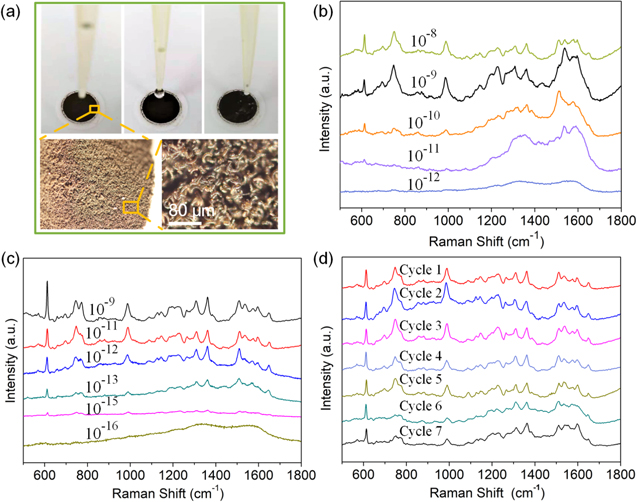
Figure 4. (a) Photographs of silver assembly dropped with 20 μl R6G solutions, and their optical micrograph with different magnification. SERS spectra of R6G solutions of (b) 10−8–10−12 M on SA-30 substrates, (c) 10−9–10−16 M on SA-60 substrates, and (d) cycling performance test on the SA-60 substrates using 10−11 M.
Download figure:
Standard image High-resolution imageAs expected, the Raman signals on the SA-60 were more than 104 times stronger than those on the SA-30 (figure 4(c)). The enhanced signals of R6G, which were clearly evident in all spectra, even at 10−15 concentration, but no signal was observed at 10−16 M concentration. These results indicated that the insufficient coupling of localized surface plasmon resonances, either from the lower load of silver aggregates or the larger particle spacing within SA-30, deteriorated the ability of the detect limit.
To evaluate the SERS signal uniformity and recyclability of the SA-60, the as-utilized substrates were reused many times via the simple washing and filtration process. As shown in figure 4(d), the Raman intensity of representative peaks of R6G after seven cycles at a low concentration of 10−11 was similar to that of the initial one. The average relative standard deviation of the intensities of the peaks 611 cm−1 is 8.2%, suggesting the good recuperability of the SA-60 as a SERS substrate. The peak at 611 cm−1 was consistent at all recyclable tests and exhibits the highest signal sensitivity, is selected as the reference peak for the enhanced factor (EFs) calculation (figure S7, supporting information). The EF of the SA-60 is calculated to be around 5.95 × 10⁸ based on the Raman intensity of 10−11 M R6G solution, which was higher than (or comparable with) that of the previous EF recorded from the 3D SERS substrates (the detailed comparison is shown in table S4). To prove the advantage of the silver assembly in the SERS application, the Raman intensity of 4-aminothiophenol (4-ATP) was also studied, as shown in figure S8. The detailed calculation for the EF is the same as the R6G, and the EF of the SA-60 is calculated to be around 2.306 × 10⁴, which is comparable to the recent research [52]. This result indicate the silver assembly was very efficient SERS-active substrate.
The great SERS enhancement effect could be ascribed to the following reasons: (i) the abundance of sub-10 nm nanogaps between adjacent SNPs can produce sufficient 'hot spots' by the local optical coupling for the local field enhancement of Raman signals (figure S9), which have a predominant influence on SERS signals; (ii) benefit from the hierarchical nanostructure of the cellular structure, the silver assembly provides large surface area that is favorable for molecules adsorption [53]; (iii) the nanosheets structure of SNPs were demonstrated to exhibit an enormous electromagnetic enhancement at the sharp corners and the junction between two adjacent SNPs [45, 54]. In addition, the signal uniformity over the silver assembly can be ascribed to the high density of hot spots within a detection volume, which offers a better chance for the molecules being placed near the hot spots [13].
3.3. Antibacterial property of silver assembly
The antibacterial activity of SNPs is closely related to their size and shape. Therefore, the antibacterial activities of the SA-X, and the spherical SNPs were studied toward S. aureus through the zone of inhibition test. Two negative controls were also tested: pure filter paper (10 mm in diameter) and original Spirulina template (1 mg). It can be seen that no inhibition zone is found in the filter paper and the Spirulina template (figures S10(a), (b)). The obvious inhibition zones with diameter of 2 cm and 1.8 cm are observed for the SA-30 and SA-60, respectively (figures S10(c), (d)), indicating that the antibacterial activity is attributed to the SNPs embedded in the template, but not ascribed to the Spirulina or the filter paper. The higher antibacterial activity of the SA-30 may ascribe to their smaller particle size, which have larger surface energy. In contrast, the SA-15 and the SNPs have no obvious inhibition zones (figures S10(e), (f)), indicating their limited bacteriostatic action compared to the SA-30 and SA-60. It is known that the Ag+ ions released by SNPs are supposed to be the definitive bacterial toxicant. The lower loading density of SNPs in the SA-15 probably leads to the insufficient release amount of Ag+ ions. For the SNPs, the low surface energy of larger SNPs may lead to its low antibacterial activity.
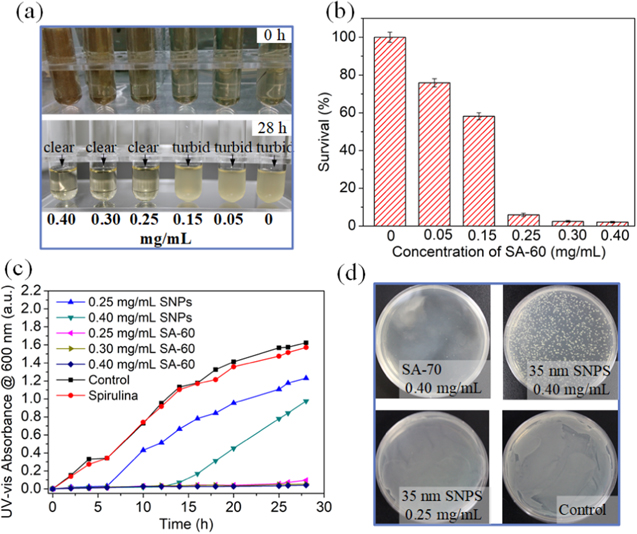
The antibacterial activities were also studied using the turbidity assay. As shown in figure S11, both the tube cultures with and without Spirulina appear turbid after 28 h incubation, indicating that the Spirulina template shows no antibacterial activity. In the presence of higher than 0.25 mg ml−1 SA-60, the tube cultures appear pellucid after 28 h incubation (figure 5(a)). The S. aureus survival rate are 76%, 58%, 5.6%, 2.4%, and 2.1%, for the SA-60 of 0.05, 0.15, 0.25, 0.30, and 0.40 mg ml−1, respectively (figure 5(b)). The bacterial growth curve of S. aureus with Spirulina shows an obvious increase with the progression at 600 nm, which is comparable to the control samples (figure 5(c)), further demonstrating that the Spirulina cannot inhibit bacterial growth.
Figure 5. (a) Photograph of tube cell cultures with various concentrations of SA-60 before and after 28 h incubation. To visually observe the turbidity of the solution, the samples were filtered from the mixture after 28 h incubation. (b) The bacterial survival rate using SA-60 with different concentrations (0.05–0.40 mg ml−1). (c) The bacterial growth curves of S. aureus with Spirulina, as well as different concentration of SA-60 and SNPs. (d) The growing colonies of S. aureus after 24 h incubation with SA-60 and SNPs, respectively.
Download figure:
Standard image High-resolution image
As shown in figure 5(c) and figure S12, the minimal inhibitory concentration (MIC) of the SA-30 and SA-60 against S. aureus was 0.15 mg ml−1 and 0.30 mg ml−1, respectively. In contrast, the lag phase of S. aureus for the 0.25 mg ml−1 and 0.40 mg ml−1 SNPs are 6 h and 12 h, respectively. The growing colonies of S. aureus further confirm that the SA-60 has better antibacterial activity than the SNPs (figure 5(d)). The SNPs are bacteriostatic because their surface oxidized to release Ag+ ions [55]. Bacterial membranes uptake the free Ag+ ions, which disrupts the replication of DNA and ATP production, generating reactive oxygen species that directly destroy the bacterial membrane integrity. The morphology of SNPs is indirect effecter that influence the Ag+ ion release. It is reported that the (111) plane of nanosheets possess better antibacterial activity than other crystal faces [45]. Therefore, the better antibacterial activity of SA-60 can be ascribed to the faster release of Ag+ ion promoted by the nanosheets structure with (111) plane dominated. The release amounts of Ag+ ions from 0.3 mg SA-60 and 0.4 mg SNPs were analyzed by ICP analysis, as shown in figure S13. The SA-60 possesses a higher Ag+ release rate, as well as a longer release duration of 140 h. After 84 h, no significant release of Ag+ can be detected for the SNPs. The total amounts of Ag+ secreted from 0.3 mg SA-60 and 0.4 mg SNPs are 20.52 and 7.27 μg, respectively. The percentages of SNPs that are converted into Ag+ can be calculated based on the release profiles and the total amount of the SNPs. 14.5% and 2% metal silver are released into the PBS solutions in the form of Ag+ for the SA-60 and the SNPs, respectively. The release efficiency of the SA-60 is higher than the previously reported Ag-based antibacterial agent [56–58].
It should be noted that one advantage of this strategy relies on the fact that the silver assembly allows for a slow release of Ag ions, which is essential for controlling the release amount and antibacterial time, and thus reducing adverse impact of silver ions to environment. In addition, our antibacterial material can be easily filtered from the solution medium owing to its micron scale, which is also beneficial to avoiding the adverse effects of the SNPs on the environment. Furthermore, since the SA-60 exhibits both excellent SERS performance and antibacterial activity, the as-prepared silver assembly possess good adaptability, and can be also extended to applications such as food safety and biotechnology.
4. Conclusions
We have demonstrated a spatial confinement strategy using the Spirulina as template to achieve the 3D assembly of the silver nanosheets. Owing to the organic interaction of biomolecule, metal catalyst seed can be site-selectively binding to the inherent cellular texture, such as nucleoid and layered thylakoid of Spirulina. By optimizing the reaction conditions, the spherical SNPs with homogeneous distribution were synthesized along the cellular texture. Taking advantage of the spatial confinement of cellular texture, we can further tune the growth of spherical SNPs into nanosheets morphology. The assembly of SNPs with rational shape and size are of immense interest in wide application because of their intriguing properties. Here we demonstrated that the silver assembly with nanosheets structure exhibits excellent SERS performance towards Rhodamine 6G, which can be attributed to the small interparticle spacing, as well as the flake edge of SNPs. Such a site-selective nucleation and spatial confined growth method is demonstrated as an effective methods for the assembly of metal NPs with controllable size and morphology, which will also accelerate understanding and exploitation of interface interaction with biomolecule towards metal species, so as to inspire more rational design to fabricate bio-inspired functional nanostructures shaped in confined cellular space of microorganisms for different purposes, such as bio-manufacturing and material science.
Acknowledgments
This work was supported by the National Natural Science Foundation of China (Grant No. 51775022) and the Fundamental Research Funds for the Central Universities.