
Abstract
In ferromagnetic (FM) metal/organic semiconductor (OSC) heterostructures charge transfer can occur which leads to induction of magnetism in the non-magnetic OSC. This phenomenon has been described by the change in the density of states in the OSC which leads to a finite magnetic moment at the OSC interface and it is called the 'spinterface'. One of the main motivations in this field of organic spintronics is how to control the magnetic moment in the spinterface. In this regard, there are several open questions such as (i) which combination of FM and OSC can lead to more moment at the spinterface? (ii) Is the thickness of OSC also important? (iii) How does the spinterface moment vary with the FM thickness? (iv) Does the crystalline quality of the FM matter? (v) What is the effect of spinterface on magnetization reversal, domain structure and anisotropy? In this context, we have tried to answer the last four issues in this paper by studying Fe/C60 bilayers of variable Fe thickness deposited on Si substrates. We find that both the induced moment and thickness of the spinterface vary proportionally with the Fe thickness. Such behavior is explained in terms of the growth quality of the Fe layer on the native oxide of the Si (100) substrate. The magnetization reversal, domain structure and anisotropy of these bilayer samples were studied and compared with their respective reference samples without the C60 layer. It is observed that the formation of spinterface leads to a reduction in uniaxial anisotropy in Fe/C60 on Si (100) in comparison to their reference samples.
Export citation and abstract BibTeX RIS

Original content from this work may be used under the terms of the Creative Commons Attribution 3.0 licence. Any further distribution of this work must maintain attribution to the author(s) and the title of the work, journal citation and DOI.
1. Introduction
Organic spintronics has been a transpiring field for the last decade due to its potential applications in quantum computation to biomedical imaging [1–3]. Organic compounds are promising in hybrid metallic multilayers because of the low spin–orbit coupling and hyperfine interaction associated to them [1, 2]. This leads to long spin dephasing time (>1 μS) and spin dependent transport length (∼110 nm) which are preferable for the spintronic devices [4, 5]. Interface plays a crucial role in such devices e.g. controlling the spin polarization in magnetic field sensors [6], generating spin-filtering effects in nonmagnetic electrodes [7], modifying magnetization reversal of the parent ferromagnetic thin film [8], altering the anisotropy symmetry [9], inducing exchange bias property [10], or giving rise to a room temperature ferromagnetism in nonmagnetic elements [11]. Charge transfer between ferromagnets (FM) and organic semiconductors (OSC) has been reported earlier where the unpaired electrons from the d orbital of the FMs are transferred to the π orbital of the OSCs [8, 12, 13]. An induction of 1.2 μB moment per cage of C60 and reduction of 21% moment in the Co layer at the interface was reported for Co/C60 multilayers by polarized neutron reflectivity (PNR) measurement. An antiferromagnetic coupling between the interfacial layers of cobalt and C60 was observed from the x-ray magnetic circular dichroism measurements [12]. A similar hybrid interface was observed between Fe and C60 with an induced moment of μS = −0.21 and −0.27 μB per molecule for C60 prepared on Fe (001) substrate and on Fe/W (001) substrate, respectively [13, 14]. Recently, we have observed that about 2 nm of C60 close to the interface between the C60 layer and epitaxial Fe layer on MgO (001) substrate exhibits moment ∼1.5–3 μB per cage of C60 [8]. As mentioned above, the reason behind the charge transfer between the FM and the OSC layer is the d(FM)–π(OSC) orbital hybridization at the interface. This leads to a change in the intrinsic properties of both the layers because of the modification of their density of states. When the OSC molecules are brought in contact with the FM layer, depending on the geometry of the OSC molecule the density of states of the OSC is modified by either broadening of energy levels or shifting the energy position [15]. Further, this hybridization affects the anisotropy symmetry also. For example it has been shown that the anisotropy can be tuned from in-plane to out-of-plane by varying the thickness of the C60 layer on the Co ultrathin film [9]. Spin dependent hybridization has been observed between the Co layer and OSC layer through Cu layer via interlayer exchange coupling [16]. However, the effect of FM and OSC layer thickness on the induced moment in the OSC and the magnetization reversal mechanism are not much explored.
In this paper, the magnetization reversal mechanism with real time domain images are studied by varying the thicknesses of Fe and C60 layers in bilayer heterostructures using magneto optic Kerr effect based microscopy. The change in anisotropy due to the presence of the C60 spinterfce was evaluated using a ferromagnetic resonance (FMR) measurement. Further, by using a PNR measurement, the induced moment in the C60 layer was quantified for variable thickness of the Fe layer.
2. Experimental details
Fe/C60 bilayer thin films of different thicknesses were prepared in a multi-deposition high vacuum chamber manufactured by Mantis Deposition Ltd., UK. The Fe and C60 layers were prepared in situ at room temperature using DC magnetron sputtering and thermal evaporation, respectively. The samples were grown on commercially available Si (100) substrates with a layer of native oxide (SiO2). The base pressure of the system was better than 3 × 10⁻⁸ mbar. The deposition pressure for Fe and C60 were 5 × 10⁻³ mbar and ∼1 × 10⁻⁷ mbar, respectively. The rate of depositions of Fe and C60 layers were 0.2 and 0.12 Å s−1, respectively. Due to the in-built geometry of our deposition system, the Fe plume was at 30° angle w.r.t. the substrate normal whereas the C60 was deposited normal to the substrate [8, 17, 18]. To study the thickness dependence of the ferromagnetic layer on the interface between Fe and C60, three different thicknesses of Fe and C60 were chosen. In order to give a more understanding of the effect of thickness of the organic layer on the spinterface, sample 1* has been prepared by keeping the Fe thickness same but by changing the C60 layer thickness. To compare the change in magnetic property due to the presence of Fe/C60 interface, three reference samples of Fe single layer of similar thicknesses were prepared. To prevent from the oxidation of Fe and damage of C60, a capping layer of Ta was deposited in situ in all samples using DC magnetron sputtering. The details of the samples are shown in table 1.
Table 1. Details of the prepared samples.
| Sample name | Sample structure |
|---|---|
| Sample 1 | Si (100)/SiO2(native oxide)/Fe (18 nm)/C60 (40 nm)/Ta (3 nm) |
| Sample 2 | Si (100)/SiO2(native oxide)/Fe (7.5 nm)/C60 (15 nm)/Ta (3 nm) |
| Sample 3 | Si (100)/SiO2(native oxide)/Fe (3.5 nm)/C60 (10 nm)/Ta (3 nm) |
| Sample 1* | Si (100)/SiO2(native oxide)/Fe (18 nm)/C60 (7 nm) |
| Reference samples | |
| Sample 1A | Si (100)/SiO2(native oxide)/Fe (18 nm)/Ta (3 nm) |
| Sample 2A | Si (100)/SiO2(native oxide)/Fe (7.5 nm)/Ta (3 nm) |
| Sample 3A | Si (100)/SiO2(native oxide)/Fe (3.5 nm)/Ta (3 nm) |
To obtain the growth of the exact layer structure of the samples cross-sectional transmission electron microscopy (XTEM) measurements has been performed on sample 1 using a high-resolution transmission electron microscope (HRTEM) (FEI, Tecnai G2 F30, S-Twin microscope, operating at 300 kV and equipped with a GATAN Orius CCD camera). The compositional analysis has also been performed by scanning transmission electron microscopy-energy dispersive x-ray spectroscopy (STEM–EDX) attachment on the Tecnai G2 F30. Energy filtered TEM (EFTEM) images were acquired using a post-column Gatan Imaging Filter (Quantum SE, model 963). The hysteresis loops and the corresponding domain images were measured simultaneously using magneto optic Kerr effect (MOKE) based microscopy manufactured by Evico magnetics GmbH, Germany [19]. All the measurements in MOKE microscopy were performed in longitudinal mode at room temperature within a field range of ±20 mT. The angle dependent hysteresis loops were measured by varying ϕ i.e. the angle between applied field direction and the easy axis. PNR at room temperature was performed on the bilayer samples (samples 1–3) at the MARIA reflectometer [20, 21] at MLZ, Garching, Germany. The wavelength (λ) of the neutrons in the PNR measurements was 6.5 Å. The non-spin flip (NSF) scattering cross sections R++ (up–up) and R−− (down–down) were measured. The first and second signs in the scattering cross section correspond to the polarization of the incident and the reflected neutrons, respectively. All the PNR measurements were performed by applying the magnetic field along the easy axis of each sample at saturation, near remanence and coercivity. To evaluate the magnetic moment in single layer Fe reference samples (samples 1A–3A), M-H loops were measured at room temperature within ±500 mT using superconducting quantum interference device (SQUID) magnetometry manufactured by Quantum Design, USA. The FMR measurements were performed by Phase FMR spectrometer manufactured by NanOsc AB, Sweden [22]. The FMR measurements were performed at a fixed frequency of 12 GHz on sample 1 and 1A to quantify the change in the anisotropy. Due to low thickness and strained growth of Fe on SiO2/Si (100) substrate, the FMR data measured for samples 2, 2A, 3 and 3A were very noisy. Therefore, any interpretation was not possible using FMR data of these four samples.
3. Results and discussion
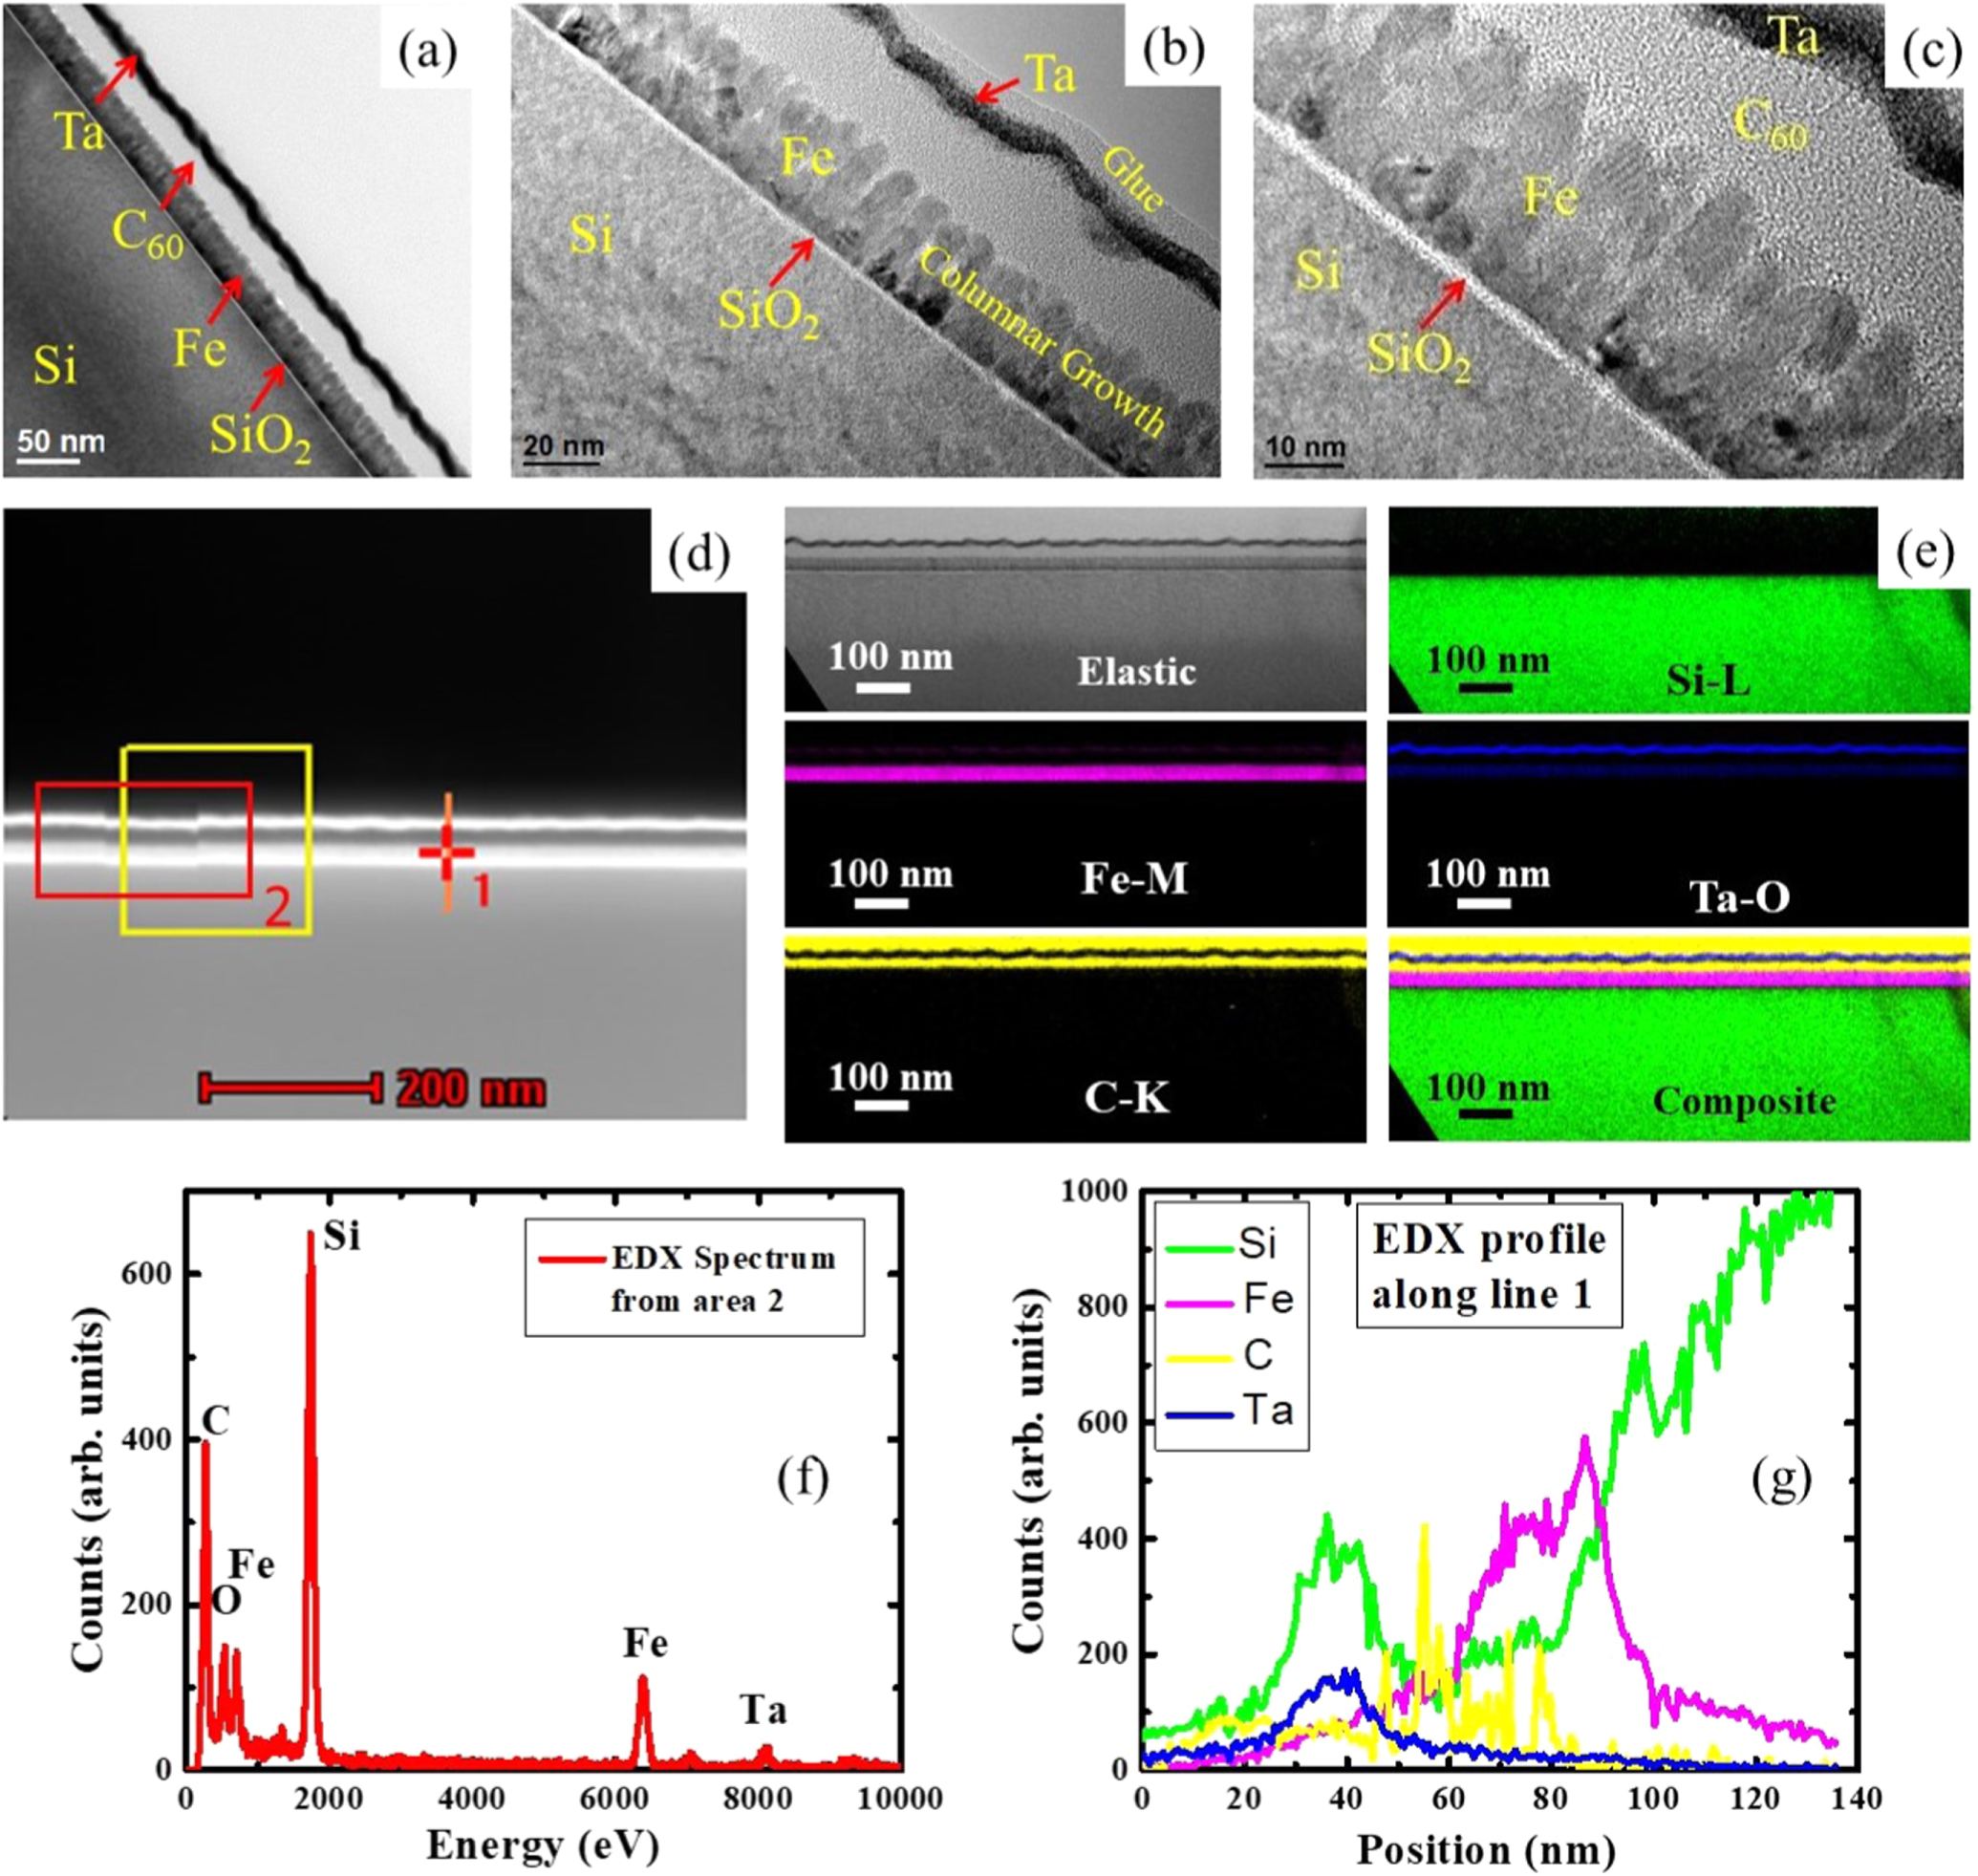
The layer structure of sample 1 has been studied using XTEM measurement. Figures 1(a)–(c) depict the cross-sectional view of the sample 1 in different length scales. Each layer of the sample has been identified and marked in the images. It can be seen from the high-resolution TEM images (figures 1(b) and (c)) that next to the native oxide (SiO2) layer Fe grows in columnar structure. The columnar growth of Fe can be explained from the oblique angular deposition of the Fe [23, 24]. The Fe grows in polycrystalline structure due to the lattice mismatch between Fe and SiO2. Different orientations of growth of Fe can be observed from the high-resolution figure 1(c). Further, STEM-EDX elemental line scan has been performed (along line 1 as shown in figure 1(d)) for each elements of different characteristic energy. EDX line profile shown in figure 1(g) confirms the layer structure of sample 1 where Ta, C and Fe peaks have been observed successively from the top surface. EDX spectrum from area 2 in figure 1(d) confirm the presence of all the different elements in the sample. The elemental mapping using EFTEM is shown in figure 1(e) where the positions of different colors represent the positions of respective layers in the sample. Energy filtered images were acquired using Si-L and Ag-N edges and also using a contrast aperture to reduce chromatic aberrations. Chemical maps from Si L (99 eV), Fe M (54 eV), Ta O (36 eV) and C K (284 eV) edges were obtained by jump ratio method acquiring two images (one post-edge and one pre-edge), respectively, to extract the background, with an energy slit of 8 eV for Si, 4 eV for Fe and Ta, and 10 eV for C, respectively. The elastic (zero loss) and composite images are shown in figure 1(e). It should be noted that the glue used in the sample preparation of cross-sectional TEM measurement contains C. Therefore, signal for C has been detected on top the Ta layer also.

Figure 1. (a) Cross-sectional transmission electron microscopy (TEM) image of sample 1. (b), (c) High-resolution TEM image where the columnar polycrystalline growth of Fe can be observed. (d) shows different regions of the sample where the STEM-EDX has been performed for spectrum collecting and line scan. (e) Elemental map for individual layers measured using EFTEM at different energy edges. (f) EDX spectrum showing the presence of different elements of sample 1. (g) EDX line profile to obtain the layer structure of the sample.
Download figure:
Standard image High-resolution imageThe layer specific magnetic moments and interfacial magnetic properties were studied using PNR technique in specular reflectivity mode for all the bilayer samples. The incident polarized neutrons interact with the magnetic spins of the sample and flip their sign according to the sign of the interacting spin. The intensity of the reflected neutrons (both up and down) was measured as a function of the component of the momentum transfer (QZ) which is perpendicular to the sample surface. The relation between QZ and the incidence/reflected angle is  where θ is the angle of incidence/reflection and λ is the neutron wavelength. It is possible to acquire layer specific magnetic information of a multilayer sample by selecting a suitable scan range of QZ as it is a variable conjugate to the depth d from the surface of the film [25].
figure 2(a) shows the PNR data (open circles) and the corresponding fits (solid lines) for sample 1 measured at room temperature at the positive saturation state (μ0H = 100 mT) of the sample. The reflectivity for the non-spin flip (NSF) scattering cross section (i.e. R++ and R−−) was recorded where the red and blue open circles represent the data measured for the up–up and down–down channels, respectively (figure 2(a)). The fitting was performed using GenX software [26] which is based on the Parratt formalism [27]. The fits reveal the presence of interdiffusion in between all the layers of sample 1. The schematic sample structure obtained from the fitting is depicted in figure 2(b) where the thicknesses are mentioned beside the respective layers. From the PNR data analysis the magnetic moment of the Fe layer in sample 1 is obtained to be 1.56 ± 0.06 μB/atom. For the sake of comparison the M-H loop for the reference sample 1A was measured using SQUID magnetometer (figure S1 of the supplementary information is available online at stacks.iop.org/NANO/30/435705/mmedia) and the magnetic moment is calculated to be 1.98 ± 0.05 μB/atom. Therefore, a loss of ∼21% of magnetic moment is observed for sample 1 with respect to its reference sample 1A. An interdiffusion layer of 2.00 ± 0.05 nm is observed between the Fe and C60 layer. Next to this mixed layer, 1.80 ± 0.06 nm of pure C60 layer exhibits a magnetic moment of 1.90 ± 0.45 μB/cage of C60. The interdiffusion layer shows a magnetic moment of 2.4 ± 0.6 μB per unit where 1 unit consists of one Fe atom and one C60 cage. The moment in the interdiffusion layer is higher as it contains moment from both the Fe and magnetic C60. The reason behind the loss of moment in Fe and induction of moment in C60 cage can be ascribed to the hybridization of d and π orbitals between the Fe and C, respectively. Due to the electronic configuration of C atoms the C60 cages have affinity for electrons and on the other hand Fe can donate extra unpaired electron from its d orbital. Due to this π–d hybridization, the density of states of the C60 get modified which leads to ferromagnetism in fullerene [15]. However, the thickness of charge/spin transfer from Fe layer to C60 layer is limited to 1.80 ± 0.06 nm. Next to the magnetic C60 layer, remaining 33.90 ± 0.03 nm of C60 layer does not exhibit any signature of ferromagnetism. This sample was also measured near remanence (∼2 mT) to elucidate the magnetization direction of the layers near zero field (figure S2(a) in supplementary information). It has been observed from the best fit that 80% of the Fe layer spins point in negative direction whereas the magnetic C60 layer shows positive moment. This indicates that the Fe and magnetic C60 layers are anti-parallel to each other near remanence. This result is in good agreement with our recent report on Fe/C60 bilayer grown on MgO (001) substrate [8]. In the latter case, Fe layer was grown epitaxially on MgO (001) substrate and C60 exhibits ∼2.95 μB/cage of moment [8]. However, due to the polycrystalline growth of Fe on native oxide based Si (100) substrate, the induced moment in C60 is less in this case. Therefore, it seems that the crystalline quality of the ferromagnetic layer probably has consequences on the strength of the induced moment in the C60 layer. In order to understand the effect of thickness of the organic layer on the spinterface, PNR measurement has been performed on sample 1*. The fitted data and the sample structure obtained from the PNR fit is shown in figure S3 (supplementary information). It has been observed that the thickness of non-magnetic C60 does not contribute to the spinterface properties.

Figure 2. (a) Polarized neutron reflectivity data and the corresponding fits for sample 1. The red and blue open circles represent the data measured for the up–up and down–down channels, respectively. The solid lines correspond to their respective fits. The measurement was performed at the saturation state at room temperature. (b) A schematic representation of the sample structure obtained by fitting the PNR data shown in (a). The numbers written in brackets beside each layer correspond to the fitted thickness of the respective layer.
Download figure:
Standard image High-resolution imageTo study the effect of this magnetic C60 layer on the magnetization reversal of the Fe layer, angle dependent hysteresis loops with simultaneous domain imaging were performed on samples 1 and 1A using MOKE microscopy in longitudinal mode at room temperature. Figure 3(a) shows the hysteresis loops measured along ϕ = 0° (easy axis), 45° and 90° for sample 1A. It can be observed from the coercivity variation of the hysteresis loops shown in figure 3(a) that sample 1A exhibits uniaxial anisotropy. Due to the geometry of our deposition chamber, Fe plume was at an angle of 30° with respect to the substrate normal. Due to the oblique angle of deposition, uniaxial anisotropy is induced in the system [17, 18, 23, 24, 28–30]. It has been discussed in previous reports that the grains of the material form chain like structure along the perpendicular to the in-plane projection of the plume direction. Along this direction, an elongation in the grain structure is expected which in turn induces a uniaxial anisotropy in the system [17, 18, 23, 24, 28–30]. The origin of the oblique angle of deposition induced uniaxial anisotropy is the long range dipolar interaction between the grains [17, 23, 24]. The domain images shown in figures 3(b)–(g) correspond to the domain states observed along the easy axis at points 1–6, respectively, for sample 1A. Large stripe domains are observed in this sample. It is noted that Fe exhibits polycrystalline growth on Si (100) substrate with native oxide layer due to the large lattice mismatch between the lattice constant of bcc Fe (0.278 nm) and hcp SiO2 (a = 0.491 nm; c = 0.54 nm). This induces strain in the Fe layers which may add dispersion in the oblique angle deposition induced uniaxial anisotropy direction. Stripe domains are usually observed in perpendicularly magnetized films as a net result of competition between the anisotropy and demagnetization energy [31]. However, in-plane magnetized films can also exhibit stripe domains due to the effect of strain arising due to the inhomogeneity leading to a dispersion in uniaxial anisotropy [32]. It has also been reported that stripe domains are observed for obliquely grown materials due to their columnar growth (figure 1(b)) [32]. Figure 3(h) shows the hysteresis loops for sample 1 measured along ϕ = 0°, 45° and 90°. Sample 1 also exhibits uniaxial anisotropy. However, the difference of the coercivity between easy and hard axis is less for the Fe/C60 bilayer sample in comparison to its corresponding reference sample 1A. This indicates reduction in the strength of the uniaxial anisotropy in sample 1. Due to the amorphous growth of C60 on polycrystalline Fe, misalignment is probable between neighboring grains which increases the dispersion in the anisotropy. This leads to decrease in the size of the stripe domains (figures 3(i)–(n)). As the dispersion in the net anisotropy increases in sample 1 the formation of the stripe domains become denser in comparison to the reference sample 1A [32].

Figure 3. Hysteresis loops measured using magneto optic Kerr effect based microscopy in longitudinal mode by varying the angle (ϕ) between the applied field and the easy axis at room temperature for samples (a) 1A and (h) 1, respectively. The images shown in (b)–(g) correspond to the domain states observed in sample 1A along the easy axis (red curve with solid circles) at the field points 1–6, respectively. Similarly, the images shown in (i)–(n) correspond to the domain states observed in sample 1 along the easy axis (red curve with solid circles) at the field points 7–12, respectively. All the domain images are in same length scale shown in (b) and (i). The arrows shown in image (b) and (i) represent the direction of the applied field.
Download figure:
Standard image High-resolution imageTo quantify the change in anisotropy due to the presence of magnetic C60 interface, angle dependent FMR measurement has been performed on samples 1 and 1A at a fixed frequency of 12 GHz. The angle ϕ between the easy axis and the applied field direction have been varied with an increment of 10° in the full 360° sample rotation. The resonance field HR has been recorded for each angle and the anisotropy nature of the sample has been extracted by plotting HR as a function of ϕ (figure 4). The anisotropy constant of the samples can be derived by fitting these data in terms of the energies present in the system. The total magnetic free energy density of the system can be written as [33]:

where Kin is the in-plane uniaxial anisotropy constant and KU is the perpendicular contribution of the anisotropy. ϕ is the angle between the easy axis and the projection of the applied field direction in the sample plane. ϕM is the angle between the easy axis and the projection of magnetization in sample plane. θ and θM are the angles between the z-axis w.r.t. the applied field direction and the magnetization direction, respectively. However, our samples are in-plane magnetized and the external field is also applied in the sample plane. Therefore, θM and θ are considered to be 90°. To evaluate the strength of the anisotropies present in samples 1 and 1A, angle dependent HR was fitted using the following dispersion relation [33]

where, hin is the in-plane anisotropy representations and can be written as  (Kin is the in-plane uniaxial anisotropy constant). hU is the out-of-plane anisotropy representation and considered to be negligible as the samples are in-plane magnetized. The red solid lines in figure 4 show the fitted curves for the angle dependent HR data using equation (2) for both the samples. The anisotropy field hin is extracted to be 25 and 20 mT for samples 1A and 1, respectively. The value of saturation magnetization (MS) for both the samples was measured using SQUID magnetometer. The uniaxial anisotropy constant Kin is calculated to be 2.16 × 10⁴ and 1.05 × 10⁴ J m−3 for samples 1A and 1, respectively. Therefore, it can be concluded that the anisotropy decreases by ∼51% for sample 1 than that of its corresponding reference sample 1A. Hence, it is believed that the dispersion in the anisotropy in sample 1, due to the lattice mismatch between C60, Fe, SiO2, and Si (100) substrate, is the reason behind the decrease in net uniaxial anisotropy of the system.

Figure 4. Anisotropy symmetry plot and the fits for (a) sample 1A and (b) sample 1 measured using ferromagnetic resonance (FMR) technique by keeping the frequency fixed at 12 GHz. The black colored open circles and the red line correspond to the measured data and the fit to equation (2), respectively.
Download figure:
Standard image High-resolution imageTo understand the effect of the Fe layer thickness on the induced moment in the C60 layer, PNR measurements have been performed on samples 2 and 3. The PNR data and their corresponding fits at the saturation state for samples 2 and 3 are shown in figures 5(a) and 6(a), respectively. Sample 2 exhibits a spinterface of 1.50 ± 0.07 nm of C60 (figure 5(b)). The induced moment in C60 is extracted to be 1.52 ± 0.50 μB/cage. Therefore, sample 2 shows less induced moment than that of sample 1. The moment in Fe layer was calculated from SQUID and PNR measurement for samples 2A and 2, respectively. The Fe layer exhibits 1.77 ± 0.04 μB/atom (figure S1(b) in supplementary information) and 1.36 ± 0.08 μB/atom in samples 2A and 2, respectively. The loss in Fe moment is ∼23% for sample 2 in comparison to its corresponding reference sample 2A. The PNR data and its fit for sample 2 near the remanence state are shown in figure S2(b) in the supplementary information. Similar to the sample 1, the Fe and C60 layers exhibit anti-parallel coupling at the remanence state. The Fe layer is 87% reversed near the remanence whereas the C60 layer is still in the positive state. By fitting the saturation data for sample 3, it has been observed that only 1.37 ± 0.18 μB/cage of magnetic moment is induced in C60 at the interface. The thickness of the magnetic C60 is 1.10 ± 0.08 nm (figure 6(b)) which is the thickness of a monolayer of C60 [34]. This indicates that the induced moment in C60 decreases monotonically with the decrease in Fe thickness. However, the loss of Fe moment is highest in sample 3. The Fe moment in its reference sample 3A have been obtained to be 1.49 ± 0.08 μB/atom by SQUID magnetometry (shown in supplementary figure S1(c)). Whereas in sample 3 the moment in Fe is observed to be only 1.06 ± 0.02 μB/atom which corresponds ∼29% loss in the Fe moment. The growth of Fe on Si (100) substrate with native oxide is poor in the ultrathin limit as the roughness of the Fe layer becomes nearly in the order of its thickness. Also, the interdiffusion between the Fe and C60 layer is even more than the pure Fe layer thickness (figure 6(b)). Due to the presence of such disorder in the growth of the Fe, the moment decreases rapidly. The PNR data and fits near the remanence state for sample 3 is shown in figure S2(c) of the supplementary information. Here, the Fe layer shows 76% negative moment and the C60 layer is completely in its positive state. Therefore, it can be concluded that irrespective of the Fe layer thickness, the magnetic C60 and the Fe layer shows anti-parallel magnetization at the remanence state. It has been observed from the PNR fittings of samples 1–3 that both the moment and the thickness of the spinterface increases with increase in the Fe layer thickness. This can be explained in terms of the quality of growth of the Fe layer. The lattice constant of bcc Fe and hcp SiO2 is 0.278 and 0.491 nm, respectively. Due to this huge lattice mismatch, additional strain might be induced in the Fe layers. In ultrathin films the strain felt by the Fe is even more as they do not have sufficient thickness to relax the adatoms. It is expected that the growth of C60 will be also poor on such strained Fe surface. Therefore, the induced moment in C60 is less when grown on ultrathin Fe. But for thicker Fe samples the topmost Fe adatoms are much relaxed in comparison to the ones next to the Fe/SiO2 interface. Therefore, the induced moment in C60 increases with the increase in Fe layer thickness. Similarly, the thickness of the spinterface is greater for the samples having thicker Fe layers. The magnetization reversal mechanism, domain structure and anisotropy symmetry of samples 3 and 3A are shown in figure S4 in the supplementary section. Similar to the thicker samples, the domain structure becomes smaller for sample 3 due to the presence of spinterface. Also, the anisotropy decreases in sample 3 when compared to its reference sample 3A. This is in good agreement with our previously obtained behavior in the thicker sample 1.

Figure 5. (a) Polarized neutron reflectivity data for sample 2. The red and blue open circles represent the data measured for the up–up and down–down channels, respectively. The solid lines correspond to their respective fits. The measurement was performed at the saturation state at room temperature. (b) A schematic representation of the sample structure obtained by fitting the PNR data shown in (a). The numbers written in brackets beside each layers correspond to the fitted thickness of the respective layers.
Download figure:
Standard image High-resolution image
Figure 6. (a) Polarized neutron reflectivity (PNR) data for sample 3. The red and blue open circles represent the data measured for the up–up and down–down channels, respectively. The solid lines correspond to their respective fits. The measurement was performed at the saturation state at room temperature. (b) A schematic representation of the sample structure obtained by fitting the PNR data shown in (a). The numbers written in brackets beside each layers correspond to the fitted thickness of the respective layers.
Download figure:
Standard image High-resolution image
4. Conclusion
Fe/C60 bilayer samples have been prepared on a Si(100) substrate with native oxide by varying the thickness of the Fe layer. Formation of spinterface has been observed in all the samples due to the π–d hybridization between C and Fe atoms. The induced moment in C60 is highest for the thicker (tFe = 18 nm) sample. Due to the lattice mismatch between Fe and SiO2, the growth of Fe is polycrystalline in nature. Because of this growth induced strain in Fe, both the moment and thickness of the spinterface decreases with a decrease in the Fe layer thickness. The formation of spinterface leads to a decrease in uniaxial anisotropy in comparison to their reference samples without a C60 layer. Such studies may help in choosing the right parameters for fabricating TMR devices which have potential application in the organic spintronics.
Acknowledgments
The authors thank Department of Atomic Energy, and Department of Science and Technology-Science and Engineering Research Board (EMR/2016/007725), Govt. of India, for providing the financial support to carry out the experiments. The authors also thank the Department of Science and Technology, India (SR/NM/Z-07/2015) for the financial support for performing the neutron experiments and Jawaharlal Nehru Centre for Advanced Scientific Research (JNCASR) for managing the project.