

Abstract
Functional groups and grain boundaries of polycrystalline graphenes play important roles in their tribological behaviors but the mechanism is still elusive. Here, we have investigated the influences of hydroxyl groups, coverage, and grain size on the surface corrugation, friction, and motion behavior of polycrystalline graphene using molecular dynamics simulations. The results show that the corrugation of polycrystalline graphene increases with respect to an increase in grain size. The introduction of hydroxyl groups suppresses the corrugation. The friction between carbon nanotube (CNT) and polycrystalline graphene increases the formation of hydrogen bonds when the interfaces are grafted with hydroxyl groups. The highest amount of friction appears when the ratio of hydroxyl groups on CNT, and polycrystalline graphene, is about 15%–5%. This is due to the balance between the interface space and the formed hydrogen bonds. Furthermore, polycrystalline slides following the movement of CNT owing to high friction. In addition, the energy dissipation as a result of the vibration of the hydroxyl groups plays a more important role as the ratio of hydroxyl groups increases.
Export citation and abstract BibTeX RIS
1. Introduction
Since its discovery in 2004 [1], graphene has become one of the most important materials in many areas, due to its excellent electrical [2], mechanical [3], optical, and thermal properties [4, 5]. Friction between interfaces is an important issue to concern in graphene's various applications. As a result, extensive research has been performed in graphene's tribology behaviors. For example, Lee et al [6] revealed that multilayer graphene had a smaller amount of friction. Li et al [7], and Long et al [8], pointed out that winkles in graphene increase friction and anisotropic friction. Ma et al [9] and Gao et al [10] investigated the modulation of moiré superlattice on friction. Furthermore, Berman et al [11] reviewed many factors including environmental effects on atomic-scale friction of graphene and discussed the approaches for achieving superlubricity in two-dimensional materials. The effect of varying temperature on the friction of graphene was revealed [12]. Additionally, the influence of grafted groups including hydrogen, fluorine, oxide, and hydroxyl on friction, were also reported. Kwon et al [13] indicated that friction increased obviously after fluorination of graphene. Hydrogenation was also found to increase friction significantly owing to the enhancement of surface roughness [14]. Berman et al [15] and Wang et al [16] pointed out that atomic-scale friction of graphene oxides was high through AFM experiments and density functional theory calculations, respectively. Ko et al [17] compared the nanotribological properties of fluorinated, hydrogenated and oxidized graphene, and indicated that oxidized graphene presented the highest friction. Hydroxyl groups was also demonstrated to significantly increase atomic-scale friction [18]. Hydrogen bond played an important role in friction of graphene [19]. Other functional groups such as CH2 was also noticed by researchers owing to its effect in energy storage [20], which might inspire the study of the influence of other groups on friction. Overall, the factors that affect the friction of single crystal graphene have been extensively investigated, opposed to the polycrystal graphene.
As an important engineering material, graphene is usually in the form of polycrystalline due to the synthesis procedure. Chemical vapor deposition (CVD) has been widely used to synthesize graphene because of its incomparable scalability, flexibility, and transferability [21]. However, CVD mainly utilizes carbon atoms to precipitate, nucleate, and grow, in different regions on the surface of nickel (Ni), copper (Cu), or other substrates [22, 23]. As a result, grain boundaries are formed at the junctions of different regions. Polycrystalline graphene has gradually attracted many researchers' attention in recent years. High quality continuous monolayer polycrystalline graphene films, having millimeter-sized domain sizes, were synthesized [24]. Moreover, the electronic, thermal, and mechanical, properties of polycrystalline graphene have also been studied. For example, researchers' results showed that both electrical and thermal properties [25, 26] are largely affected by morphological features of grain size and composition. Park et al [27] further pointed out that the electrical performance of polycrystalline was not degraded by grain boundaries in the case of well-stitched CVD graphene. Additionally, the mechanical strength, including Young's modulus, and the fracture strength of polycrystalline graphene, were proven to be sensitive to grain boundary and grain size [28, 29].
The grain boundary effect on the friction of graphene is an important issue. However, the friction of polycrystalline graphene was only studied by few researchers, and the research was primarily focused on the effect of grains and moiré superlattice. For example, Zheng et al [30] pointed out that the interfacial confinement effectively suppressed the molecular-level deformation of polycrystalline graphene, and preserved the ultra-low-friction state—even when the surface was actively fluorinated or oxidized. Moreover, Kavalur et al [31] studied the tribological properties of the multigrain structure against a pristine graphene. The simulation results revealed that the misalignment angle and grain boundaries acted as a primary contributor of friction. Furthermore, chemical functionalization has proven to be a promising means of tailoring the unique properties of graphene. Li et al [32] investigated the influence of hydroxyl groups on friction of graphene. However, the reason caused this phenomenon was not explained clearly. Besides, the research about the effect of chemical functionalization on the friction of polycrystalline graphene has not been reported. The aforementioned factors motivate us to carry on such an investigation in this study. In this paper, we study the influence of hydroxyl groups and grain size on the friction behaviors on the surface of polycrystalline graphene. The mechanism of the effect on friction is explored by analyzing phonon density of states (PDOS) of the system [33]. Molecular dynamics (MD) simulations is used for this investigation, as MD is well established and an efficient tool for various investigations [34].
2. Simulation models and methods
The initial structures of polycrystalline graphene used in the simulation were generated through a random process following Shekhawat and Richie [35]. Using this algorithm, we first select a certain number of random locations n (n = 1, 2, 3, 4, 5, 6, 7, 8, 9, 10, 16, 25, 36) where carbon atoms are placed. These initial locations provide nucleation sites for grain growth. As a result, other carbon atoms are added to their adjacent lattice points. The lattices assigned to each nucleation site also have random orientations. When these grains merge, grain boundaries are naturally formed according to the criteria of coordination number and minimum atomic distance [32]. Finally, the stable polycrystalline graphene for simulation is obtained after annealing.
The annealing process is as follows. First, increase the temperature from 300 to 3000 K in 10 ps. After increasing the temperature, hold the temperature for relaxation for 50 ps. Afterward, the temperature of the system decreases to 300 K within 10 ps. Ultimately, after the relaxation for 10 ps, the crystal lattice reaches equilibrium. The polycrystalline structure generated by this algorithm is suitable for simulating the mechanical, electronic, and thermal, transport properties of polycrystalline graphene [32, 36]. The size of the polycrystalline graphene is about 10 × 10 nm2. When the number of grains (n) is smaller than 10, the even number is selected for study. When n > 10, the number m2 is selected, in which m is an integer. Because the average grain size is too small when n > 20, only the numbers of grains n = 1, 2, 4, 6, 8, 10 and 16 are chosen in this study. Their average grain size is 100.0, 50.0, 25.0, 16.67, 12.50, 10.0 and 6.25 nm2, respectively.
The simulation models are composed of single-walled carbon nanotubes (SWCNTs) (10, 10) and two layers of graphene substrate. The bottom layer of graphene substrate is fixed; while the upper layer is monocrystalline graphene, or polycrystalline graphene, depending on the simulation model. Hydroxyl groups are grafted on the surface of carbon nanotube (CNT), and polycrystalline graphene in some models. The simulation models are shown in figure 1. Figures 1(a)–(c) are models of SWCNT on graphene, SWCNT on polycrystalline graphene, and SWCNT grafted with hydroxyl groups on polycrystalline graphene covered with hydroxyl groups, respectively. Figures 1(b) and (c) show the cases in which the average grain size of polycrystalline graphene is 6.25 nm2. The simulations of the average grain size 100.0, 50.0, 25.0, 16.67, 12.5 and 10 nm2 are also carried out. The length of CNT is 10.14 nm and contain 1640 carbon atoms. The dimension of graphene is 9.87 nm and 10.14 nm along the x and y axis, respectively.
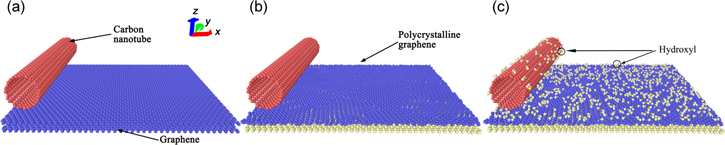
Figure 1. Simulation models: (a) SWCNT on graphene; (b) SWCNT on polycrystalline graphene; (c) carbon nanotube and polycrystalline graphene are both covered with hydroxyl groups on the surface.
Download figure:
Standard image High-resolution imageTo apply periodic boundary conditions in both x and y axes, the fixed bottom layer of graphene substrate is stretched 1.01% along the x axis, and the CNT and fixed bottom layer of graphene are compressed 0.014% along the y axis. Such a small pre-strain is trivial and the effect on the results may be neglected. The content of hydroxyl groups on CNT and graphene refers to the ratio of the number of hydroxyl groups to the number of carbon atoms on the CNT, and the number of carbon atoms on the upper graphene or polycrystalline graphene.
The REBO potential [37] is employed to describe the interactions among C atoms in the system. OPLS_AA force field [38] is used for the interaction between C–O–H, which exists at the interface when CNT and graphene are covered with hydroxyl groups. The parameters for C, H, and O atoms can be found in literature [39]. Van der Waals force between SWCNT and graphene and graphene layers are described by Classic 12-6 Lennard-Jones (L-J) potential [40]. Further, the hydrogen bond between interfaces is calculated by the DREIDING force field [41].
The canonical ensemble (NVT) is applied in simulations. The system temperature is controlled at 300 K through the generalized Langevin. The numerical integration Velocity-Verlet algorithm is employed with a time step of 0.001 ps. The MD simulations are carried out by the large-scale atomic/molecular massively parallel simulator [42]. The simulation process has three steps. First, the structure of the simulation system is optimized through energy minimization. Second, the relaxation is then conducted for 100 ps to assure that the system reaches equilibrium. Finally, a constant velocity along the x axis is applied to the CNT to make it move on the substrate.
3. Results and discussions
3.1. Influence of grain size and hydroxyl-coverage on surface corrugation
The upper polycrystalline graphene layer with average grain sizes of 100.0, 50.0, 25.0, 16.67, 12.50, 10.0 and 6.25 nm2 are studied. The velocity of CNT in the x direction is set 0.01 nm ps−1. Wrinkles appear in polycrystalline graphene because of grain boundary. If the roughness of the winkles is higher, the centroid of polycrystalline in the z direction, relative to the z-coordinate, tends to be larger. The z-coordinates of the centroid of polycrystalline graphene with different grains are shown in figure 2. The results show that the z-coordinates of the centroid of polycrystalline graphene become larger as the average grain size decreases, which implicates that the corrugation is more obvious when the average grain size reduces.

Figure 2. The z-coordinate of the centroid of polycrystalline graphene as a function of grain size. The inset is the curve of z-coordinate of the centroid during movement.
Download figure:
Standard image High-resolution imageAfter hydroxyl groups are introduced on interfaces, the corrugation of polycrystalline graphene is suppressed. Figures 3(c) and (d) show the corrugation of the polycrystalline with grain size 6.25 nm2. The corrugation becomes smaller when hydroxyl groups are between interfaces, as shown as figure 3(e). This phenomenon is more notable when the average grain size is small. Ma et al [43] pointed out that F atoms in fluorographene diminished the variation of the interlayer spacing, which implied less corrugation. Our results show that hydroxyl groups have a similar effect on the corrugation of polycrystalline graphene.
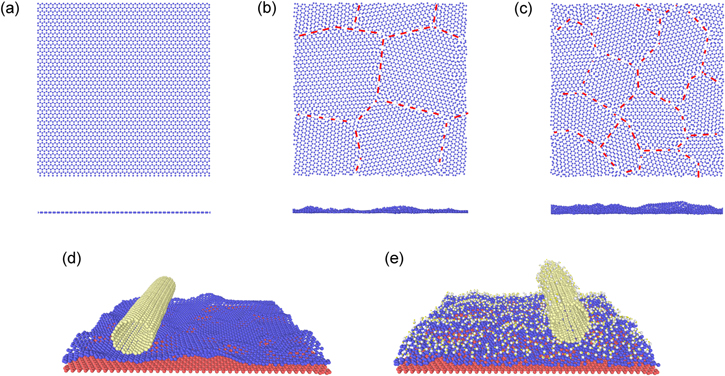
Figure 3. (a)–(c) Are the structure of graphene and the typical structures of polycrystalline graphene. The grain sizes of polycrystalline graphene are 25.0 and 6.25 nm2, respectively in (b) and (c). (d) The surface morphology of polycrystalline graphene having a grain size 6.25 nm2, in which there are no hydroxyl groups between interfaces; (e) carbon nanotube and polycrystalline are the same with (d), however the ratios of hydroxyl groups on carbon nanotube and polycrystalline graphene are 10% and 20%, respectively.
Download figure:
Standard image High-resolution image3.2. Influence of grain size and hydroxyl-coverage on tribology behavior
Typical friction curves of CNT on polycrystalline graphene are shown in figure 4(a). The fluctuation of lateral forces on CNT is much larger than that of graphene. When different velocities of CNT in the x direction are applied, the average friction forces between interfaces differ, as shown in figure 4(b). The results show that at the same speed, the average friction force between interfaces increases as the average grain size decreases. The reason is that the number of corrugations increase with the number of grain boundaries. Therefore, van der Waals force between CNT and graphene in the local region is remarkably enhanced, which leads to larger fluctuation of lateral force, and eventually results in the increase of the average friction force. At the same time, due to the randomness of the corrugation, the symmetry of the lateral force of CNT gradually disappears as the average grain size decreases. The average friction force between interfaces increases with velocity, which is consistent with previous studies [44, 45].
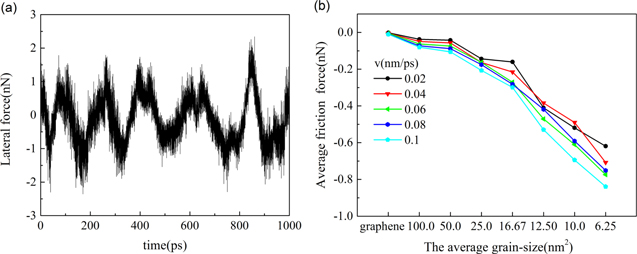
Figure 4. (a) Typical friction curves of carbon nanotube on polycrystalline graphene; (b) the average friction force between interfaces when different velocities are applied. The average grain size is 100.0, 50.0, 25.0, 16.67, 12.50, 10.0 and 6.25 nm2, respectively.
Download figure:
Standard image High-resolution imageAlthough the surface corrugation of polycrystalline graphene is smaller after grafting with hydroxyl groups, the friction between CNT and polycrystalline graphene is larger than that without hydroxyl groups. Regarding one simulation system having a polycrystalline graphene substrate, the fluctuation of lateral force increased gradually from −8 to 4 nN, as the ratio of hydroxyl groups on polycrystalline graphene increased. However, the average friction force does not have the same trend. The polycrystalline graphene having an average grain size of 12.5 nm2 is selected for detailed discussion as follows.
Considering the random distribution of hydroxyl groups will lead to a certain degree of randomness of the structure, the simulation is conducted five times for each model, which includes the models with polycrystalline graphene covered with 5% and 15% hydroxyl groups, as well as CNT covered with 0%, 5%, 10%, 15% and 20% hydroxyl groups. The average friction forces between interfaces are shown in figure 5(a). The results show that friction increases significantly after the interfaces are grafted with hydroxyl groups. Also, when the ratio of hydroxyl groups on polycrystalline graphene is 5%, the average friction force will increase first, then decrease. The highest friction appears when the ratio of hydroxyl groups on CNT is about 15%. However, when the ratio on polycrystalline graphene is 15%, the average friction force decreases first and then becomes a constant. The rapid increase in friction when interfaces are grafted with hydroxyl groups is attributed to the change of interface interaction. Figure 5(b) shows the number of hydrogen bonds between interfaces in the simulation illustrated in figure 5(a).
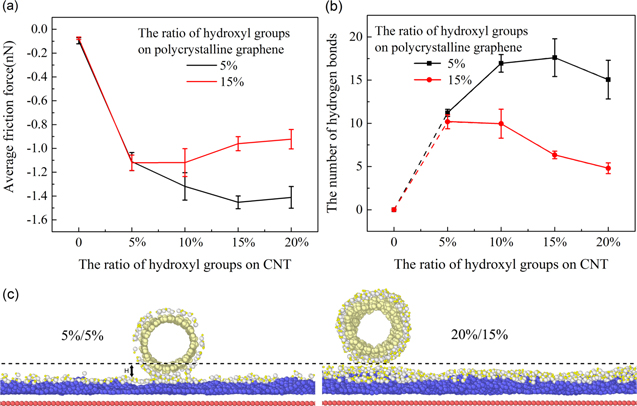
Figure 5. (a) The average friction force between carbon nanotube and polycrystalline graphene. When the interfaces are covered with hydroxyl groups, the ratio of hydroxyl groups of polycrystalline graphene and CNT is 5%, 15%, and 5%, 10%, 15%, 20%, respectively. The average grain size of grains of polycrystalline graphene is 12.5 nm2. (b) The number of hydrogen bonds with the ratio of hydroxyl groups. (c) The interface space when the ratio of hydroxyl groups on CNT and polycrystalline graphene is 5%/5%, 20%/15%.
Download figure:
Standard image High-resolution imageThere are hydrogen bonds in the interfaces due to the introduction of hydroxyl groups. The trend of the number of hydrogen bonds with the ratio of hydroxyl groups is consistent with friction, which implies that hydrogen bonds between interfaces are closely related with friction. However, friction is not related to the ratio of hydroxyl groups. In the previous study of friction of graphene [41], similar results were obtained. However, the reason that caused this phenomenon was not unearthed. The reason could be attributed to the change of the interface. Higher ratios of hydroxyl groups will result in more hydrogen bonds forming between interfaces. However, the interface space becomes larger as the ratio of hydroxyl groups increases, as shown as figure 5(c), which leads to weak van der Waals force between interfaces. The number and the strength of the hydrogen bonds decrease. The balance of interface space and the ratio of hydroxyl groups makes the highest friction appear when the ratio of hydroxyl groups on CNT and polycrystalline graphene is about 15%–5%. It is worth noting that the graphene is ultra-fine polycrystalline with grain size less than 100 nm2. In macroscopic where grain size is in micro scale, friction might be further reduced according to our conclusions. To which extend, however, need further investigations by suitable tools that are beyond MD simulation scale.
3.3. The influence of hydroxyl coverage on motion behavior
In cases where hydroxyl groups are not grafted between interfaces, the CNT continues to slide on graphene and polycrystalline graphene. The corrugation of polycrystalline graphene is slightly flattened when CNT passes by; however, the corrugation will recover after the CNT slips through. The centroid x-coordinate of polycrystalline graphene with different average grain sizes is shown in figure 6(a).
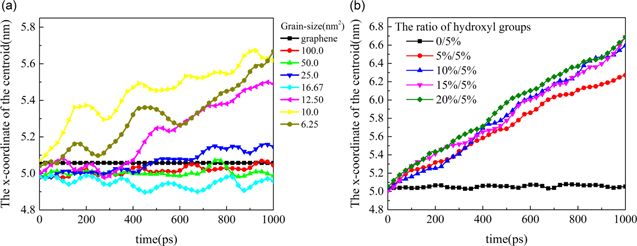
Figure 6. (a) The x-coordinate of the centroid of polycrystalline graphene. The average grain size is 100.0, 50.0, 25.0, 16.67, 12.50, 10.0 and 6.25 nm2, respectively. (b) The ratio of hydroxyl groups on polycrystalline graphene is 5%.
Download figure:
Standard image High-resolution imageAs shown in figure 6(a), polycrystalline graphene follows the movement of CNT. When the average grain size is small, such as the cases with average grain size 12.5, 10.0, 6.25 nm2, the motion of polycrystalline graphene is more perceptible. The reason for this phenomenon is that the friction between CNT and polycrystalline graphene is larger than that of between CNT and graphene, which leads to slight motion of the polycrystalline graphene. After hydroxyl groups are introduced, the friction between CNT and polycrystalline graphene increases evidently; therefore, polycrystalline moves a longer distance along the x direction, as shown as in figure 6(b). Similarly, the movement distance of polycrystalline graphene with hydroxyl groups of 5% on polycrystalline graphene is longer than that with a ratio of hydroxyl groups of 15%. The movement of CNT changes from sliding to rolling with slight sliding or continuous rolling after different ratios of hydroxyl groups are grafted on the interfaces. We observed a similar phenomenon and discussed it in previous results [15].
3.4. Energy dissipation
Energy dissipation is closely related to friction. In order to further investigate the origin of friction of polycrystalline graphene, the PDOS is analyzed. The PDOS of polycrystalline graphene with the average grain size is shown in figure 7. The PDOS has three peaks at frequency 12, 21 and 54 THz. The three peaks are consistent with the radial breathing mode (2RBM band), D band and G band Raman spectra, where D band is a reflection of defects and disorder and G band is related to the ordered degree. The peaks of 12 and 21 THz are mainly contributed from the out-of-plane acoustic phonons (ZA mode). There are two competing factors determine their amplitude. On one hand, when the grain size decrease, the in-plane sp2 bonding decreases. As a consequence, the restrictions from in-plane bonds reduce and the out-of-plane vibration increases. This explains the general trend that the 12 and 21 THz peaks increase gradually with the decrease of the average grain size from figures 7(a)–(e). The relationship between the peaks and grain size implies that the 5–7 ring defects and grain boundaries in polycrystalline graphene increase with a decreasing grain size. On the other side, when grain size decrease, the out-of-plane bending also increases (see figure 2). In our calculation, we only count the vibrations along the out-of-plane direction. Therefore, the ZA modes on these curved surfaces will be only partially counted. When the grain size become smaller, the curvature becomes prominent and the ZA mode contributions become less. As a compromise of these two competing factors, the maximum amplitude of the peaks of 12 and 21 THz appears at grain size about 12.5 nm2.
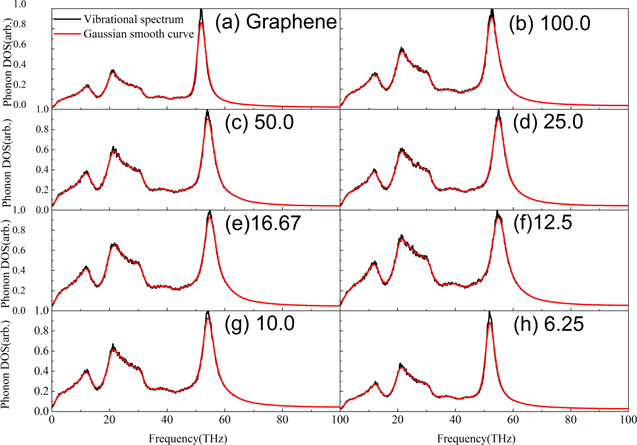
Figure 7. The PDOS of graphene and polycrystalline graphene. (a) Graphene; (b) the average grain size is 100.0 nm2; (c) 50.0 nm2; (d) 25.0 nm2; (e) 16.67 nm2; (f) 12.5 nm2; (g) 10.0 nm2; (h) 6.25 nm2.
Download figure:
Standard image High-resolution imageAfter hydroxyl groups are introduced to interfaces, the PDOS of polycrystalline graphene changes. Similar results are obtained for different grain size polycrystalline graphene. Here the case with average grain size 12.5 nm2 is discussed. The PDOS of polycrystalline graphene having different ratios of hydroxyl groups is shown in figure 8, in which the ratio of hydroxyl groups on CNT is fixed at 5%. There are six main peaks in the PDOS. Three peaks at 9, 18 and 54 THz are the corresponding peaks of polycrystalline graphene. The other three peaks at 37, 43 and 86 THz are related to the vibration of hydroxyl groups. As the ratio of hydroxyl groups increases, the peaks related to polycrystalline graphene are suppressed. As a result, the peak at 86 THz which is related to hydroxyl groups becomes stronger. The peak at 9 THz, which is the shoulder of 18 THz, disappears after the ratio of hydroxyl groups is larger than 5%/10%. Further, the peak at 54 THz, G band of graphene, disappears when the ratio is 5%/20%. Meanwhile, vibration peaks related to hydroxyl groups gradually become dominant after the ratio 5%/10%, which implies more energy is dissipated through the vibration of hydroxyl groups.
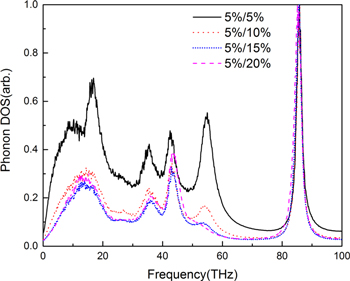
Figure 8. The phonon density states of polycrystalline. (a) The ratio of hydroxyl groups on CNT and polycrystalline graphene is 5%/5%; (b) 5%/10%; (c) 5%/15%; (d) 5%/20%.
Download figure:
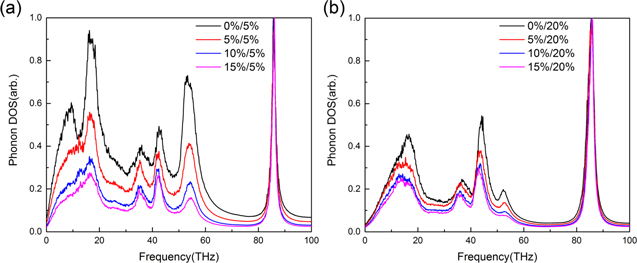
Standard image High-resolution imageFigure 9 shows the PDOS of the whole simulation system when different ratios of hydroxyl groups are grafted on interfaces. Comparing the highest level of curves in figures 9(a) and (b), the ratio of hydroxyl groups on polycrystalline graphene have a significant influence on energy dissipation. If the interfaces are both grafted with hydroxyl groups, comparing the cases, with the ratio of hydroxyl groups on polycrystalline graphene 5% (figure 9(a)) and 20% (figure 9(b)), the effect of the hydroxyl groups on polycrystalline is that it increases the amplitude and width of the peaks at 43 and 84 THz, while also suppressing the vibration at 18 and 54 THz. The effect of hydroxyl groups on CNT is that it lowers the amplitude of peaks that are smaller than 60 THz, as shown as in figure 9(b). When the ratio of hydroxyl groups is small, as shown as the case with the ratio 5%/5% in figure 9(a), the vibration of C atoms is dominant at the peaks at 18 and 54 THz. If the ratio of hydroxyl groups between interfaces is large (figure 9(a) or the cases in figure 9(b)), the PDOS is similar. The vibrations of C atoms are suppressed. Therefore, the energy mainly dissipates through the vibrations of hydroxyl groups.
Figure 9. The phonon density state of the simulation system. (a) The ratio of hydroxyl groups on CNT and polycrystalline graphene is 0%/5%, 5%/5%, 10%/5%, 15%/5%, respectively. (b) The ratio is 0%/20%, 5%/20%, 10%/20%, 15%/20%, respectively.
Download figure:
Standard image High-resolution image
4. Conclusions
We have systematically investigated the tribological behavior of polycrystalline graphene using MD simulations, with the focus on the influence of grain size and hydroxyl coverage on friction. The results show that the corrugation of polycrystalline graphene is more pronounced as the average grain size decreases, leading to higher friction. When hydroxyl groups are introduced between surfaces, the corrugation of polycrystalline graphene is suppressed. However, friction between CNT and polycrystalline graphene increases significantly due to the interface interaction changes from van der Waals forces only, to combined forces of hydrogen bond and van der Waals force. Friction is closely related to hydrogen bond between interfaces, not the ratio of hydroxyl groups. The highest friction appears when the ratio of hydroxyl groups on CNT and polycrystalline graphene is about 15%/5%. The reason for this is that the interface space becomes larger as the ratio of hydroxyl groups increases. The benefit from having a higher ratio of hydroxyl groups and the decrease due to larger interface space leads to the ultimate balance. Moreover, owing to higher friction, polycrystalline graphene slides along the direction that CNT moves. The analysis of PDOS shows that the vibration of C atoms is still dominant when the ratio of hydroxyl groups is low, for example 5%/5%. However, as the ratio goes up, more energy is dissipated through the vibration of hydroxyl groups. Hydroxyl groups gradually plays a more important role in energy dissipation when hydroxyl coverage increases.
Acknowledgments
This research was funded by National Natural Science Foundation of China (No. 51475039) and the Natural Science Foundation of Tianjin (No. 15JCQNJC04800).