

Abstract
We demonstrate surfactant- and template-free synthesis of superhydrophobic thin films by controlling surface morphology. The surface morphology evolution process was determined from time-dependent studies. The relationships between the water contact angle, sliding angle, water droplet size, and surface microstructures were investigated. It is found that structural parameters play an important role in determining the adhesion of a droplet on superhydrophobic surfaces and the liquid–solid adhesion can be effectively manipulated through tailoring the morphology or the size of the microstructures on the surface. We provide a theoretical explanation for the Cassie–Baxter state (water rolls) and the Wenzel state (sticky surface, water adheres) with droplet size on different microstructure surfaces. The new theoretical insight provided in this study matches well with experimental results.
Export citation and abstract BibTeX RIS
1. Introduction
Wettability is one of the most important characteristics of solid surfaces. Superhydrophobic surfaces have extreme wettability and have received much attention due to applications in self-cleaning [1, 2], anti-icing [3, 4], drag reduction [5], and oil–water separation [6]. Superhydrophobic surfaces are of two types: the Cassie–Baxter type or the Wenzel type. In a Cassie–Baxter surface water droplets often sit on the surface protrusions and easily roll across the surface. In a Wenzel surface, the water droplet penetrates the surface porosity and is pinned in place. Variation between Cassie–Baxter and Wenzel behavior is known but not completely understood [7]. In nature, the lotus leaf is a typical representative of the Cassie–Baxter superhydrophobic surface. Water droplets on these surfaces can roll away easily and remove dust particles, which gives rise to the self-cleaning phenomenon [8]. Highly adhesive superhydrophobic surfaces are demonstrated in nature by rose petals and gecko feet [9]. It is thought that the volume of water droplets may play an important role in whether a surface displays Wenzel or Cassie–Baxter type superhydrophobicity [10]. For example, on superhydrophobic materials used for rainproofing, it is found that not all water droplets roll effectively to clean the surface. Droplets below a particular size often stick even when vertical or upside down, showing a Wenzel type behavior [11]. It is necessary, therefore, to investigate the relationship between the size of different droplets, the sliding angle, the contact angle, and the microstructure of rough hydrophobic surfaces. At present, there are a lot of reports about the rolling and adhesion of water droplets [12–20]; however, a comprehensive understanding of the sliding properties of water droplets with different sizes, especially for small water droplets on superhydrophobic surfaces, has not yet been sufficiently achieved [21–24].
In this study, we fabricated superhydrophobic cobalt oxide (Co3O4) films with different topographies by combining both a simple solution-immersion process and self-assembly of stearic acid. By adjusting the reaction time, the microstructure of the Co3O4 films can be tailored from nanowire arrays to nanowire/microflower structures, and finally to microflowers. We also investigate the wetting of the Cassie–Baxter or Wenzel state for water droplets of varying volume and their relation with surface microstructures. The variation of the sliding angle with different droplet volumes was modeled semi-quantitatively and the results correlated well with the experiment. The results reported here provide an understanding of how surface roughness and water droplet size contribute to the transition in wetting behavior from the Cassie–Baxter to the Wenzel state.
2. Experiment
2.1. Preparation of superhydrophobic Co3O4 film
In a typical synthesis, 5 mmol of cobalt nitrate hexahydrate (Co(NO3)2 · 6H2O) and 15 mmol of urea (CO(NH2)2) were dissolved in 50 ml of distilled water to form a homogeneous solution. Then a piece of clean aluminum sheet (10 × 30 × 1 mm) was immersed in the reaction solution and maintained at 97 °C for a certain time. After that, the sample was taken out and rinsed with distilled water several times in order to remove the free particle debris and the residual reactant. The sample was annealed at 250 °C in air for 2 h leading to the formation of Co3O4 film with controlled morphology. Finally, the obtained sample was immersed in 0.015 mol l−1 of stearic acid in ethanol for 2 h, taken out, washed with ethanol, and dried at 85 °C for 1 h.
2.2. Characterization
The morphologies and structures of samples were characterized by x-ray diffraction (XRD, RIGAKU D/Max-2550 with Cu-Kα radiation), field emission scanning electron microscopy (JEOL JSM-6701F FESEM) and high-resolution transmission electron microscopy (HRTEM, JEOL JEM-2010F). X-ray photoelectron spectroscopy (XPS) data were acquired using a VGESCALAB210 x-ray photoelectron spectrometer. Water contact angle and sliding angle were measured using a KRÜSS DSA 100 apparatus. The average contact angle and sliding angle values were obtained by measuring the water droplets with volume of about 4–6 μl at at least five different positions, and images were captured with a digital camera (Canon).
3. Results and discussion
3.1. Structural characterization and growth of crystalline Co3O4 film
Cobalt oxide films were grown on an aluminum sheet by the reaction of cobalt nitrate and urea at 97 °C. The films evolved different microstructures depending on the synthesis time. Figures 1(a) and (b) show the FESEM images of the sample surface formed from the reaction of cobalt nitrate hexahydrate and urea after 13 h of reaction time. It can be seen that the surface is uniformly and densely covered with nanowires, which are joined together at the top to form arches. The detailed microstructures of the nanowires were further studied by TEM. As shown in figure 1(c), the branch is composed of 10−15 nm nanocrystals that are packed into a compact linear structure. The selected area electron diffraction (SAED) pattern is shown as an inset in figure 1(c), and indicates that the nanowires consist of multiple crystallites. The structure and phase of the sample after annealing at 250 °C for 2 h were determined by x-ray diffraction analysis (figure 1(d)). All the diffraction peaks are attributed to the spinel Co3O4 phase (JCPDS (JCPDS NO: 48-0083) card no. 42-1467) indicating that crystalline Co3O4 has been successfully formed after annealing. The cubic spinel phase of Co3O4 was found to have a lattice constant of a = 8.084 Å. This is also consistent with the standard XRD pattern for Co3O4 (JCPDS card no. 42-1467, a = 8.084 Å). No impurity peaks were detected by XRD, which showed that the cobalt oxide contained no easily measurable second crystalline phase.
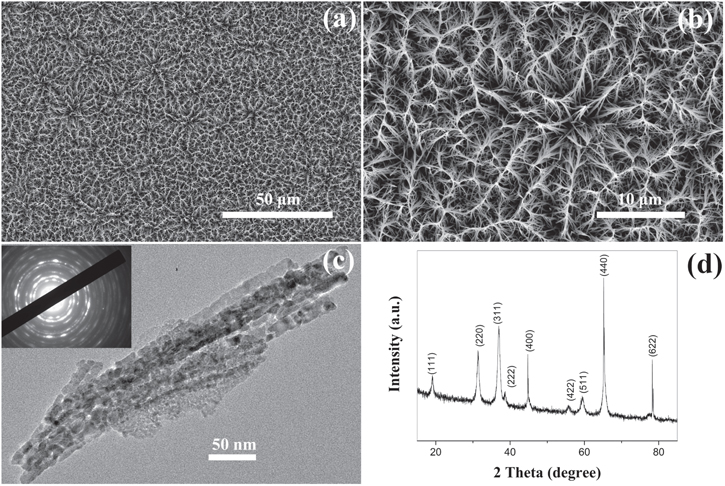
Figure 1. Characterization of the of the Co3O4 film with 13 h immersion process and after annealing at 250 °C for 2 h. (a), (b) SEM images; (c) TEM image; (d) XRD pattern. Inset in (c) is the corresponding SAED pattern.
Download figure:
Standard image High-resolution imageBy adjusting the reaction time, the morphology of the Co3O4 film was tailored to different microstructures, as shown in figure 2. When the immersion time reaches 15 h, a few nanosheets grow from the nanowire arrays and this is the genesis of the initial formation of the microflower, as shown in figures 2(a) and (b). A further increase in the immersion time leads to an increased surface area of the microflower structures and the microflowers coexist with nanowires on the surface, showing the microflower/nanowire array structures (figures 2(c), (d)). When the immersion time reaches 18 h, an increasing number of microflowers appear and the microflowers grow bigger and in very high density. The high-resolution SEM image (figure 2(f)) reveals that the obtained structure is composed of two parts. The upper part contains microflowers and the bottom is made up of oriented nanowire arrays. The microflowers are in fact hierarchical architectures consisting of nanosheets as building units which exhibit open structures with numerous nanosheets that extend outside and seem to become gradually compacted inside. Further increase in the reaction time to 20 h allowed numerous microflowers with diameters of 8–10 μm that completely covered the nanowire structure, as shown in figures 2(g), (h). Close observation reveals that the hierarchical microflowers contain dozens of nanopetals about 0.8–1.5 μm wide and 10–20 nm thick.

Figure 2. SEM images of the film with different reaction times. (a), (b) 15 h; (c), (d) 16 h; (e), (f) 18 h; (g), (h) 20 h.
Download figure:
Standard image High-resolution imageFrom the time-dependent morphology evolution processes, it is generally believed that the growth of the hierarchical architecture undergoes three stages: (i) formation and growth of nanowires; (ii) formation and growth of flower-like structures from nanowire arrays; and (iii) further growth of microflowers on top of the nanowire array films. The growth process is shown in figure 3, and the chemical reaction equations for the formation of cobalt oxide film are suggested as follows [25]:


Since no organic additives such as surfactants or templates existed in the reaction, the concentrations of Co2+ and OH− were likely to play the key roles. Therefore, it may be more convincing to explain the process by employing an oriented attachment crystal growth model. At the initial reaction stage, accompanying the  and OH− anions from hydrolysis of urea reacting with Co2+ cations, the initial crystal nucleus of cobalt carbonate hydroxide hydrate starts to come into being (supporting information figure S1 is available online at stacks.iop.org/NANO/29/485601/mmedia). As the freshly formed nano-nuclei are thermodynamically unstable due to their high surface energy, they tend to gather together to minimize the interfacial energy, and thus, the supersaturated nuclei aggregate together and form nanowire arrays. During subsequent stages, cobalt carbonate hydroxide hydrate nanowires grow further in length and width into nanosheets which coexist with the nanowires. With an increase in reaction time, more and more nanosheets appear, grow larger and form hierarchical microflower architectures by consuming core materials via an Ostwald ripening process. Finally, hierarchical microflowers consisting of nanosheets as building units almost completely cover the nanowire structures. After calcination at each stage, we found that the morphologies were unchanged, and the morphology evolution of cobalt carbonate hydroxide hydrate is shown in the supporting information (figures S2–S6). Hence, it is believed that the cobalt carbonate hydroxide hydrate film transforms into Co3O4 film and the microstructures to all intents and purposes remain the same as the topotactic process [26].

Figure 3. Schematic of the microstructure evolution process of Co3O4 film and SEM images corresponding to each growth stage. Parts (i), (ii), and (iii) represent the reaction time corresponding to 13 h, 18 h, and 20 h, respectively.
Download figure:
Standard image High-resolution imageIn order to further understand the composition and the wettability transition from superhydrophilicity to superhydrophobicity after chemical modification with stearic acid, XPS measurements were taken. Figure 4(a) gives the survey spectrum of the as-prepared Co3O4 film before and after chemical modification, and only elements Co, O (and adventitious C) were detected, indicating the surface purity of the product. Compared with that of before chemical modification with stearic acid, the C content increases due to the surface attached stearic acid (upper line). Figure 4(b) shows two peaks at 780.1 eV (Co2p3/2) and 795.0 (Co2p1/2) with a spin-orbit splitting of 14.9 eV, verifying the formation of Co3O4 [27]. The O1s spectrum (figure 4(c)) can be modeled to resolve into multiple components centered at binding energies of 530.5, 531.3, and 532.0 eV, which are ascribed to Co–O, C=O, and −OH species, respectively [28]. Figure 4(d) demonstrates C1s spectrum before and after being modified with stearic acid. Before surface modification, the carbon element comes from the contamination from the equipment. It is clear that the carbon component increases after coating with stearic acid (figure 4(d) upper red line), which indicates that very thin layers of stearic acid are attached to the surface of the Co3O4 film.

Figure 4. (a) XPS spectra for the obtained film surface before and after stearic acid modification. (b) The spectrum of Co2p. (c) The decomposed spectrum of O1s after stearic acid modification. (d) C1s spectrum before and after surface modification.
Download figure:
Standard image High-resolution image3.2. Morphology-dependent wetting behavior
This work shows a transition from a Wenzel to Cassie–Baxter surface with droplet volume. Surface microstructures trap air and play an important role in the contact angle and sliding angle values, which is helpful in the variation of the liquid/solid contact area. Herein, we investigate the influence of the surface microstructures and water droplet size with the contact angle and sliding angle values. Figure 5(a) shows the contact angle behavior of water droplets of various volumes on our surfaces with different morphology. A reduction in droplet volume from 10 μl to 1 μl leads to a change of contact angles on the same surface that do not vary within the inherent errors of the measurement. The size of a water droplet is shown not to be a key factor that affects the contact angle at the contact line. Hence, regardless of the size of the droplet, the contact angle should always be the same, and this result is consistent with those in the literature [26]. However, in our work, we found that for droplets of equal volume the sliding angle was markedly different and was dependent on the surface morphology. Figure 5(b) shows the droplet volume as a function of the sliding angle values on different microstructured surfaces. It is clear that the sliding angle values increase with a reduction of the water drop volume on surfaces with the same microstructure. On our nanowire array surface, the sliding angle value decreases from 20 ± 1° at a drop volume of 1 μl to 4 ± 1° at a drop volume of 10 μl. With increasing reaction time, the surface microstructure turns from a nanowire array to coexisting nanowire and microflowers, and finally to hierarchical microflowers. As shown in figures 5(a) and (b), for a water drop of 10 μl, the contact angle value will decrease from 164 ± 1° on the nanowire array surface (13 h reaction time) to 158 ± 1° on the microflower structure surface (18 h reaction time), whereas the corresponding sliding angle value will increase from 4 ± 1° to 15 ± 1°.
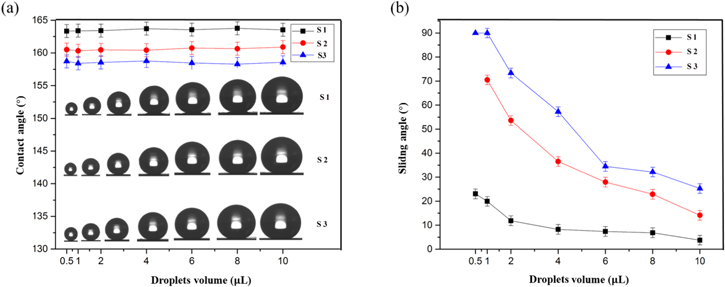
Figure 5. The relationship between contact angle (a) and sliding angle (b) values and droplet volume on different surfaces with reaction times of 13 h (S1), 16 h (S2), and 18 h (S3). The volume of droplets inset in (a) from left to right is 0.5, 1, 2, 4, 6, 8, 10 μl.
Download figure:
Standard image High-resolution imageThe adhesive force for different droplets on the obtained superhydrophobic surface with different microstructures was conducted to further investigate the variation of sliding angle. Adhesive action was assessed by a high-sensitivity microelectromechanical balance system. First, the superhydrophobic surface was placed on the plate of the balance system, microdroplets with different volumes were suspended on a metal ring, and the force of the balance system was initialized to zero. Then the surface was brought into contact with the microdroplet while maintaining the balance force at zero (step 1). The surface was moved at a rate of 0.05 mm s−1. When the surface left the microdroplet after contact, the balance force increased gradually and reached its maximum at the end of step 2. Finally, the balance force decreased immediately when the surface broke away from the microdroplet in step 3 to finish one cycle of the measurement. Figures 6(a)–(c) show force−distance curves on the superhydrophobic surfaces with reaction times of 13 h, 16 h, and 18 h. It can be seen that the adhesive force increases with the decrease of the droplet volume. The big droplet has a smaller adhesive force, and droplets with a bigger size have a smaller adhesive force. Thus, the smaller drop is more likely to be fixed on the surface. Therefore, the sliding angle will decrease with droplet volume increase. The surface roughness plays an important role in the sliding angle of a droplet with a fixed size. As shown in figure 6(d), the adhesive force of a droplet is lower on the nanowire surface than on the microflower structure surface, which leads to the droplet having a smaller sliding angle on the nanowire surface, and a bigger one on the microflower structure surface.
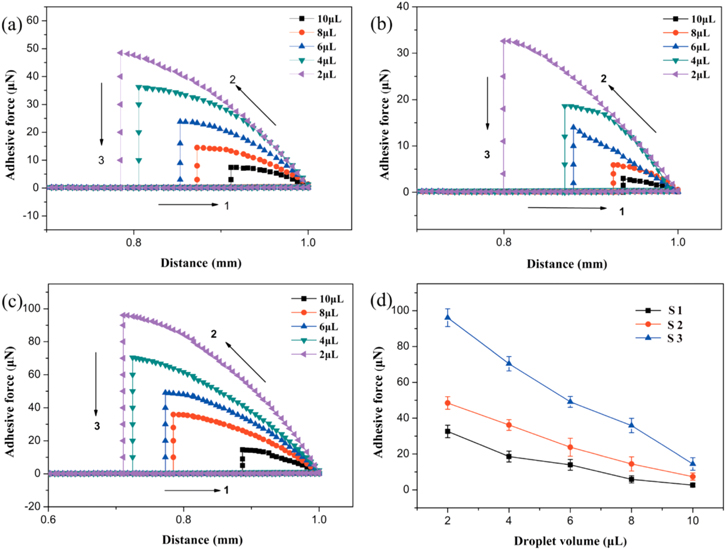
Figure 6. Force−distance curves on the superhydrophobic surfaces under reaction times of 13 h (a), 16 h (b), and 18 h (c). The relationship between the adhesive force and the droplet volume is shown in (d).
Download figure:
Standard image High-resolution image3.3. Theoretical insight into wetting behavior
The nanowire array structure surface is much rougher than that of the microflower structure surface, and typically the water contact angle has a higher value on a rougher surface, which can be verified with theory. The contact angle of a sessile droplet on a smooth solid surface is described by Young's equation:

where γSV, γSL and γLV are the surface free energies of solid–vapor, solid–liquid and liquid–vapor interfaces respectively. For a rough surface, the droplets' wetting behavior can be considered within two regimes. The Wenzel regime proposed an equation to describe homogeneous wetting, where droplets penetrate the surface roughness protrusions [29]:

Here  is the equilibrium contact angle and r is the surface roughness, which is defined as the product of actual solid surface area to the contact area. However, the equation describing the heterogeneous wetting is given by Cassie and Baxter [30]:

where f is the surface area fraction on the rough surface. So for hydrophobic surfaces whose  increasing its roughness will result in an increased contact angle.
Commonly, a surface with higher contact angle will also show a lower sliding angle.
Theoretically, Furmidge [31] reported his derived equation on the sliding angle:

where m is the mass of droplet, g is the gravitational constant,  is the SA, w is the width of the droplet, and θR and θA are the receding and advancing contact angle s of droplet. The right-hand side of the equation is dependent on the properties of the surface and inside the parentheses is the contact angle hysteresis.
The droplets during this experiment are smaller than 10 μl, which can be approximated as a spherical cap when stationary on the substrate, whose volume is given by

Then the contact radius

Here the width of the droplet is assumed as w = 2R. Thus, for substrates with the same surface condition, droplets above should show the relationship

The equation is similar to what Wolfram et al reported [32]

where k is a constant related to the interaction energy between a liquid and a solid surface. As they claimed that this empirical equation is only valid for smooth surfaces, Masashi Miwa and his co-workers investigated the relationship between contact angle and sliding angle on a rough surface, modifying equation (8) with several assumptions [23]:
Here θ and θ' are the contact angles of the rough and flat surfaces. Therefore, droplets on the same substrate would illustrate the relationship

For droplets with volume <10 μl and contact angle >150°, the contact radius R is of order 10−4 m, thus  then equation (10) can be simplified to

Following equation (6) the range of contact radius of the droplets used in our experiments is calculated to be  which is far larger than the scale of the microstructures shown in the SEM image (figure 2). Thus it is considered that the surface nanostructure transforms from nanowire arrays to microflowers as the immersion times increase, which slightly lowers the surface roughness and then leads to the reduction of the water contact angle.
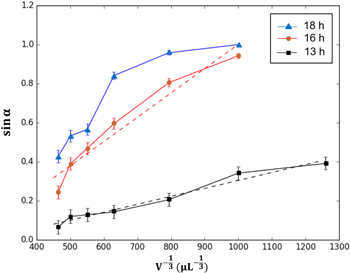
In line with equation (11), as m = ρV, the curves  are plotted, and as shown in figure 7, the curves with reaction times of 13 h and 16 h show an approximate linear tendency. For the immersion time of 18 h, where the curve is not that consistent with equation (11), it is considered that the wetting is partly in the Wenzel regime while the relationship of equation (11) is based on the Cassie–Baxter model. This also explains why, when the droplet volume is 0.5 μl, the sliding angle reaches 90° as the droplets stick to the surface.
Figure 7. Sine value of the sliding angle plotted against  ▲, ● and ■ represent actual data points, and the dotted lines equal the theoretical calculation.
Download figure:
Standard image High-resolution image
4. Conclusions
In conclusion, we have fabricated Co3O4 superhydrophobic films with controlled microstructures through a simple immersion chemistry approach. With increased reaction time, the microstructures can be tailored from nanowire arrays to three-dimensional hierarchical microflowers consisting of nanosheets as building units. Water droplets with different volumes have different contact angles and sliding angle values on the obtained films, and when compared with the microflower structure surface, the water contact angle on the nanowire array structure surface has a high value. The variation trend of the contact angle on the Co3O4 surface with an increasing reaction time is believed to be due to a reduction in surface roughness during the microstructure transformation, from high-roughness nanowire to low-roughness hierarchical microflower surface. Meanwhile, the experimental data of sliding angle with different droplet volumes compares well with the derived  relationship, except for very small droplets in the Wenzel wetting regime.
Acknowledgments
This project is supported by the National Natural Science Foundation of China (grant nos 51875173, 51505463) and the International Exchange Scheme—China NSFC/The Royal Society, UK (21711530209).