
Abstract
Self-organized gold chains on vicinal Si(111) surfaces represent prototype examples of quasi-one-dimensional objects that are stabilized by hybridization with Si surface states. Their plasmons contain important information about the unoccupied bandstructure close to the Fermi level. Using Si(775)–Au as an example, we report here the modifications of the plasmon dispersion by the simple atomic adatom species H and O. Using a combination of low energy electron diffraction and high-resolution electron energy loss spectroscopy, we study the interconnection between plasmonic excitation and the corresponding local surface structure. Both adsorbates do not destroy metallicity, but, similar to Si(553)–Au, atomic hydrogen enhances dimerization of the Au chains, which at small concentrations counteracts the disorder introduced by random adsorption. This effect, most likely caused by electron donation of H to the surface states, is missing in case of adsorbed oxygen, so that only the effect of disorder is observed. For both adsorbates increasing disorder as a function of adsorbate concentration finally results in plasmon localization and opening of a band gap.
Export citation and abstract BibTeX RIS

Original content from this work may be used under the terms of the Creative Commons Attribution 4.0 licence. Any further distribution of this work must maintain attribution to the author(s) and the title of the work, journal citation and DOI.
1. Introduction
Due to their outstanding fundamental characteristics, low-dimensional quantum matter on semiconductor surfaces has been a frequent subject of research over the last decades.
Strong correlations between crystal lattice and electron density generates, particularly for one-dimensional (1D) systems, unusual properties such as lattice instabilities [1], a power law energy dispersion [2], spin–charge separation and electronic correlation [3], as well as spin–orbit interaction [4].
Due to their inherent instability, the quasi-1D systems require stabilization by interactions in two (2D) and three dimensions (3D). As an example, the strategy to stabilize metallic atomic wires was to incorporate them into semiconductor surfaces [5, 6]. Since the interaction in higher dimensions also inevitably destroys part of their pure 1D characteristics [7], the experimental observation of specific 1D physics (i.e. Peierls instability, Tomonaga–Luttinger liquid excitation) becomes challenging and, in some cases, is still a matter of debate. On the other hand, these different interaction schemes bring the flexibility for tuning the physical properties. Modifications of these interactions have been realized, e.g., by the use of different surfaces (i.e. Si, Ge) and/or various metal adsorbates (Au, In, Pt etc) [5–9]. Moreover, introducing steps and the variation of step densities on vicinal surfaces has been demonstrated to be a powerful method to vary the lateral inter-chain interactions [5–7]. Furthermore, adsorbates allow tuning of the substrate–wire interaction and give an additional handle to their modifications [10, 11]. Strong electronic correlation in these low-dimensional systems accounts for long-range interactions that extend over whole mini-terraces so that the modification of one-dimensional metallicity in ultimate chains does not necessarily require the direct local interaction with adsorbate atoms [12]. A particularly interesting example is Si(553)–Au, in which surplus Au atoms as well as adsorbed atomic hydrogen, although adsorbed at random, even enhance and stabilize order over some range of concentrations [13].
The study of plasmonic excitations in low-dimensional systems opens attractive perspectives toward applications due to their high spatial confinement and quasi-linear dispersion [14]. However, in particular for the quasi-1D systems, a more systematic understanding of their fundamental properties related to bandstructure, electronic correlations, and electron–phonon interactions is required, since a variety of entangled phenomena appear, the systematics of which are not yet clarified [7, 15–17]. As an example, charge transfer by adsorbates results in the simplest case only in changes of band filling, but modifications of interactions with the environment also cause modifications of the bandstructure itself [7]. In this context, plasmon spectroscopy turned out to be quite valuable to probe the unoccupied bandstructure and to compare it with quantitative band structure calculations [7, 17–20]. Furthermore, propagating low-dimensional plasmons are highly sensitive to any kind of structural imperfections [12]. This makes the experimental investigation quite difficult and requires appropriate probing tools.
High index Si surfaces such as Si(hhk) (h, h, k = h ± 2n, n being a positive integer) have been popular templates for growth of highly anisotropic nanowires in the past [21, 22], since they combine high flexibility of step densities, and step orientations with high chemical stability. These surfaces consist of periodic arrays of flat (111)-oriented mini-terraces with steps along the [1 0] direction. With respect to the (111)-plane, they are tilted toward the [
 2] or the [11
 ] directions. These well-defined terraces and steps enable simultaneous anisotropic diffusion of adsorbate atoms along the terraces resulting in 1D-chain superstructures.
The Si(775) surface, in particular, has an inclination of 8.5° in the (11 ) direction away from the Si(111) plane. Deposition of 0.32 monolayers (ML) of Au onto this surface is assumed to form one strand of double atomic chains per terrace. These terraces are 21.3 Å wide and are separated by Si double-steps (height 3.14 Å) [6].
Two quasi-parabolic bands due to Au-modified surface states have been observed in photoemission on this surface [6]. While from these data it was unclear whether they actually cross the Fermi level, subsequent STS [23] as well as plasmon spectroscopy in combination with density functional calculations [17] proved that this surface is indeed metallic, but DFT showed that only one single metallic band crosses the Fermi level, in agreement with recent plasmon spectroscopy experiments [17]. This band is strongly hybridized with Si surface states. Contrary to the Si(553)–Au surface [24–26], no temperature-induced phase changes and/or any structural transition have been observed on this surface.
Here, we first address the fact that the model of a single dimerized double chain of Au per terrace [6] needs to be modified because it is incompatible with details of the LEED pattern found. Second, we study modifications of the plasmonic excitations by hydrogen and oxygen chemisorption on this surface. This study shows that despite their different chemistry and unique interaction mechanism with the surface, H2 and O2 affect the plasmon frequency in a similar way. Possible reasons and their similarity to related Au chain systems on stepped Si(hhk) are discussed.
2. Experimental details
The experiments were performed in an ultra-high vacuum (UHV) system (base pressure 5 × 10⁻¹¹ mbar) that hosts a high-resolution spot profile analysis low energy electron diffractometer (SPA-LEED) to investigate and control the sample quality and an electron energy loss spectrometer combined with an SPA-LEED deflection unit (EELS-LEED) [27, 28]. This instrument provides high resolution both in energy and in momentum. The typical operating conditions for these measurements were 20 meV energy resolution and 0.01 Å−1 resolution in k-space.
Si(775) samples (resistivity ρSi(775) ≈ 0.01 Ω cm, n-doped) were used for all measurements. Samples were cleaned in an ultrasonic bath with petroleum-benzene, acetone and isopropanol. In UHV, the samples were degassed for several hours at 600 °C, then flash-annealed to 1200 °C by DC heating with a current flow parallel the steps, followed by slow cooling to room temperature. Special care was taken to maintain the pressure below 2 × 10⁻¹⁰ mbar during the entire procedure.
A coverage of 0.32 ML of Au was deposited at 630 °C sample temperature at a deposition rate of ∼0.05 ML min−1 and shortly annealed to 850 °C after preparation. This procedure yielded a high-quality periodic array of nano-scale (111)-terraces with a separation of 21.3 Å (see below) that is well comparable with previous works [23, 25].
A quartz micro-balance located at the sample position was used to control the amount of gold. The concentration is given in ML with respect to the density of Si atoms in the bulk (111)-plane (1 ML = 7.84 × 10¹⁴ atoms cm−2) [27, 29]. Additionally, making use of the sensitivity of plasmon dispersion to long range ordering at low k∥ and to the electronic structure at high k∥, the surface coverage was further optimized [13].
Gas exposures were done via the background pressure. The background pressure of H2 or O2 during exposure was typically ≈2 × 10⁻⁸ mbar. Since adsorption of H2 had no measurable effect, a hot filament was used to generate atomic hydrogen. The flow of atomic hydrogen was estimated as ∼1 × 1013 cm−2 s−1 assuming a ∼50% cracking efficiency at the hot filament, which, however, covers only a small fraction of the total gas stream of hydrogen. The actual exposure is given as molecular hydrogen in the text.
After gas exposure, EEL spectra were recorded at constant coverage after the pressure has fallen below 2 × 10⁻¹⁰ mbar. All EELS measurements were carried at room temperature with an integration time of around ∼10 min per scan.
3. Results and discussion
3.1. Structural studies
3.1.1. Si(775)–Au
In order to get an overview of possible adsorption-induced structural changes, we first show in figure 1 LEED patterns before and after adsorption of H and O. As it turns out, these patterns also question the validity of the existing favored model of Si(775)–Au (see below). Starting with the clean surface (figure 1(a)), the equally separated round spots are characteristic of a regularly stepped surface. They form an oblique unit cell in reciprocal space, as depicted by the white rhomboid. Their separation in the [11 ] direction of 15.7% of the surface Brillouin zone corresponds to a step separation of
  = 21.3 Å (a⊥ = 3.32 Å is the Si lattice constant in the [11
 ] direction), whereas along the steps, i.e. in
 ![$\left[1\bar{1}0\right]$](https://content.cld.iop.org/journals/0953-8984/33/20/205001/revision3/cmabf37eieqn8.gif) direction, the spot separation is given by the (inverse) lattice constant of the close-packed rows of Si, 2π/3.84 Å−1. The ×2 streaks, also visible in this LEED image, appear only after deposition of Au, in agreement with previous studies [30, 31]. Their streak-like appearance indicates no correlation of the ×2 modulation between adjacent terraces.
direction, the spot separation is given by the (inverse) lattice constant of the close-packed rows of Si, 2π/3.84 Å−1. The ×2 streaks, also visible in this LEED image, appear only after deposition of Au, in agreement with previous studies [30, 31]. Their streak-like appearance indicates no correlation of the ×2 modulation between adjacent terraces.

Figure 1. SPA-LEED patterns of clean Si(775)–Au at an Au concentration of 0.32 ML (a) and the same surface after exposure to 10 L of H2 (b). (c) Si(775)–Au surface after exposure to 15 L of O2. The rhomboid of the reciprocal unit cell of the underlying stepped Si substrate (white) is marked in (a).
Download figure:
Standard image High-resolution imageMoreover, a quasi-periodic modulation of these streaks in the (11 ) direction with a periodicity three times larger than the separation of the diffraction spots along the step train is observed. Its visibility was found to be independent of the primary beam energy, and has been seen also in previous publications under different diffraction conditions [32, 33]. Moreover, we found that this periodicity is not sensitive to small changes in Au coverage [33].
This very basic finding indicates that the Au chains formed on this surface must consist of three sub-chains on each mini-terrace with comparable Au density and ×2 modulation, but this feature, not paid attention to in the past, is clearly not compatible with the formation of only a double Au chain on each terrace proposed earlier [23], which would not lead to this type of modulation. On the other hand, the (low) level of agreement between the double-chain model and the tunneling microscopy data in reference [23] clearly leaves room for models that fit to the requirements set by LEED.
It requires a distribution of Au atoms into three sub-units per terrace that have similar electron scattering properties. Such a three-subunit structure may indeed be fully compatible with the published STM data [23]. More structural details, however, cannot be derived from such LEED patterns, but the quantitative search for a new structural model via DFT total energy calculations is already in progress [34].
3.2. H- and O-induced changes
Hydrogenation, as well as oxidation, does not change the step periodicity and/or macroscopic surface morphology. However, both adsorbates modify intensities and halfwidths of the ×2 periodicity. Details of these modulations, seen in spot profiles and background intensities, are shown in figure 2. More quantitative evaluations of adsorption-induced changes of peak intensities and halfwidths measured along the Au chains are plotted in figure 3. For the evaluation of correlation lengths, i.e. the inverse halfwidths of the deconvolutions of Gaussian instrument functions (obtained from the integer order spots) and Lorentzians were used.

Figure 2. Spot profiles of ×2 streaks measured along the ![$\left[1\bar{1}0\right]$](https://content.cld.iop.org/journals/0953-8984/33/20/205001/revision3/cmabf37eieqn10.gif) direction for the clean system (black circles) as well as after hydrogen and oxygen exposures (a) and (b), respectively. (c) and (d) show the increase of the linear background during corresponding gas exposure. The linear backgrounds were extracted from the line scans measured as a function gas exposure in the (1
direction for the clean system (black circles) as well as after hydrogen and oxygen exposures (a) and (b), respectively. (c) and (d) show the increase of the linear background during corresponding gas exposure. The linear backgrounds were extracted from the line scans measured as a function gas exposure in the (1 0) direction through the central spike.
Download figure:
Standard image High-resolution image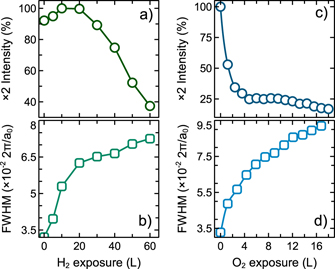
Figure 3. (a) and (b) Changes in ×2 streak intensities (a), and deconvoluted halfwidths (b) measured along the Au chains as a function of H2 exposure. (c) and (d) Same during oxygen adsorption.
Download figure:
Standard image High-resolution imageTurning first to the adsorption of atomic hydrogen by use of the cracker filament, we see that the ×2 streaks immediately start to broaden, as visible from figures 2(a) and 3(b), leading to an enhanced background intensity (figure 2(c)). This is a clear indication that atomic H adsorbs in a random fashion.
Nevertheless, the peak intensity of the ×2 spots increases significantly for exposures up to 20 L H2 (intensities integrated along ![$\left[1\bar{1}0\right]$](https://content.cld.iop.org/journals/0953-8984/33/20/205001/revision3/cmabf37eieqn12.gif) by roughly a factor of 3), thus overcompensating any intensity reductions by disorder introduced due to random adsorption (see figures 2(a) and 3(a)). This situation seems to be very similar to that in Si(553)–Au. In this system, the random adsorption of H has the effect of electron donation, which is directly coupled with the amplitude of dimerization of the Au chains [20, 34], which we also assume to be effective here. However, the influence of disorder was less pronounced in the Si(553)–Au system.
by roughly a factor of 3), thus overcompensating any intensity reductions by disorder introduced due to random adsorption (see figures 2(a) and 3(a)). This situation seems to be very similar to that in Si(553)–Au. In this system, the random adsorption of H has the effect of electron donation, which is directly coupled with the amplitude of dimerization of the Au chains [20, 34], which we also assume to be effective here. However, the influence of disorder was less pronounced in the Si(553)–Au system.
In contrast, oxygen as an electron acceptor does not show this effect. As seen from figure 3, the LEED intensities of the ×2 streaks drop sharply upon oxygen adsorption, and the FWHMs rise strongly and continuously as a function of oxygen exposure. Together with the rising background intensity (see figure 2(d)) this means that oxygen adsorption just destroys long-range order in this system but leaves the terrace structure unchanged. This behavior fits to the commonly observed trend in similar systems [10, 35].
3.3. Plasmonic excitations
By means of plasmon spectroscopy, we test adsorption-induced modifications of the unoccupied band structure close to the Fermi level, but also the scattering properties of plasmons. The latter turns out to be dominant in the results presented here.
The recorded momentum-resolved EEL spectra from the clean surface and after gas adsorption are shown in figure 4. With increasing k∥, a dispersive loss feature appears, which we identify with the plasmonic excitation of the Au-modified surface states. Since this plasmonic excitation shows dispersion solely along the atomic chains, i.e. parallel to steps, it can be viewed as quasi-one-dimensional.
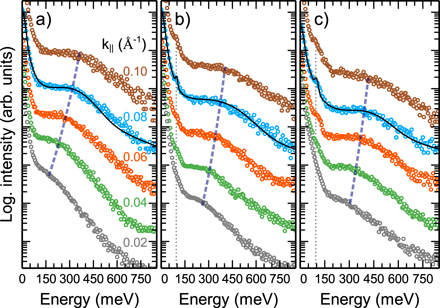
Figure 4. (a) Momentum-resolved EEL spectra of clean Si(775)–Au along the wire direction. The k∥ values determined from the scattering angle with respect to specular reflection are given as parameters at the curves. (b) After exposure to 20 L of H2. (c) After 4 L of O2. Spectra were normalized with respect to the elastic intensity and shifted for better visibility. Dashed lines estimate the corresponding plasmon dispersion. Exemplary fit lines are shown for k∥ = 0.08 Å−1. The dotted lines in (b) and (c) indicate the H (or O)-induced mode.
Download figure:
Standard image High-resolution imageA small non-dispersive peak at ∼100 meV emerges only after adsorption of either H or O. It can be assigned to Si–H and Si–OH (Si–O) modes in case H2 and O2 exposures, respectively [36–40]. This mode indicates the chemical interaction and bond formation between the adsorbates and Si surface atoms. Furthermore, tests of thermal desorption and the disappearance of these peaks at around 350 °C for hydrogen and above 850 °C for oxygen, together with the reappearance of the original plasmon loss spectrum, support that this loss signal can safely be attributed to H- and O-induced modes, respectively (see figure 5).
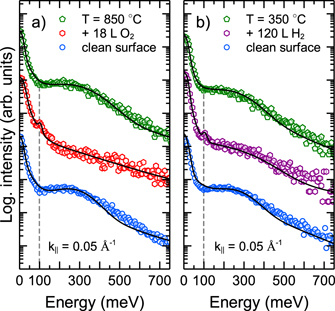
Figure 5. Sample spectra for the temperature-induced recovery of the oxidized (a) and hydrogenated (b) surfaces together with the corresponding fit lines. Dashed lines in both graphs show the non-dispersive H (O)-induced mode, which disappears after thermal desorption of the adsorbed species.
Download figure:
Standard image High-resolution imageIn order to obtain the plasmon dispersion, the loss spectra were fit by a set of Gaussian functions and an exponentially decaying Drude background. Details of this procedure are given in reference [41]. Sample fits are shown in figure 4. The plasmon dispersion of the clean Si(775)–Au system (see figures 6 and 7) reproduces very well that already published recently [17]. Its relation to the electronic bandstructure has been discussed there. We use this dispersion here mainly for comparison with the adsorption-induced modifications by atomic hydrogen (figure 6) and by oxygen (figure 7).
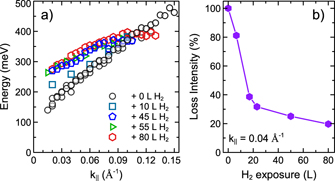
Figure 6. (a) Plasmon dispersion for the clean Si(775)-Au surface and upon hydrogenation with different amounts of H2 obtained from the peak maxima of loss peaks. (b) Changes of plasmon intensity as a function of hydrogen exposure measured at k|| = 0.04 Å−1.
Download figure:
Standard image High-resolution image
Figure 7. (a) Plasmon dispersions obtained for clean and oxidized surfaces, (b) the changes of plasmon loss intensity as a function of O2 exposure at k|| = 0.04 Å−1.
Download figure:
Standard image High-resolution image
While the plasmon dispersion curve of the clean system may still be extrapolated to energy zero at k∥ = 0, there is a strong increase of the dispersion curves at small k∥ upon adsorption of both adsorbates so that the extrapolation to k∥ = 0 yields finite energies. These extrapolated energies increase as a function of increasing exposure of both H and O until they saturate. This finding is coupled with a strong reduction of loss intensities (figures 6(b) and 7(b)), which also reduces the k-range of observable losses.
The second common feature of these figures is the leveling-off of dispersion for k∥ > 0.08 Å−1 in case of adsorbed H and for k∥ > 0.06 Å−1 with adsorbed O, in other words, plasmons tend to be localized by the adsorbates for wavelengths shorter than 10 nm.
In order to explain this behavior, several physical effects come into play: first, the nearly constant plasmon energy at and above k∥ = 0.08 Å−1 requires an adsorption-induced opening of a bandgap above 0.4 eV and does not depend on the exact concentration of either adsorbate. The almost identical value obtained both with H and O adsorption, however, seems to be fortuitous.
Although a similar mechanism—opening of a bandgap—cannot be fully excluded also close to k = 0 for both adsorbates, a more plausible reason for the observed increase of the extrapolated dispersion curve down to k = 0 is the strong influence of disorder introduced into the system by random adsorption of both atomic species, as deduced already from the analysis of the SPA-LEED experiments. Similar to other quasi-particles, plasmons are scattered by local deviations from the periodicity, which in our case are introduced by the chemisorbed gas atoms. They adsorb with a high preference not on the Au chains, but on nearby Si atoms, as concluded from model calculations on surfaces with quite similar structural motifs such as Si(557)–Au and Si(553)–Au. On these surfaces, the preferential adsorption for hydrogen and oxygen was shown to happen on the Si–HC chains [10, 12, 20], so that their influence is only indirect by adsorption-induced geometrical relaxations of Si and Au atoms in the vicinity of the adsorption site.
On the other hand, the scattering probability of plasmons depends on a wavelength, so that plasmons with shorter wavelengths are scattered with increasing probability. This phenomenon has been quantified, e.g., for 2D plasmons on graphene with atomic steps [42]. It leads to wavelength-dependent localization, which has indeed been observed for stepped Au(788) surfaces [43].
Based on this scenario, we come to the following description:
- (a)As a function of either H or O exposure, there is an increasing concentration of random scattering centers on the surface that reduce the maximum average propagation length for plasmons already close to k∥ = 0 and lead to enhanced backscattering. Thus standing plasmonic waves are formed with a maximum wavelength that scales with the average distance between defects. This maximum wavelength corresponds to finite k∥ and to a non-zero plasmon excitation energy that increases with defect density, as observed.
- (b)With larger k∥ > 0 (shorter wavelengths), the scattering probability increases so that the maximum possible wavelength is further reduced.
- (c)This evolution is limited by a bandgap opening, which phenomenologically is coupled to the increased localization so that no further dispersion is seen.
The strong reduction of the plasmon intensity upon gas adsorption is again a sign of increased scattering that also results in widening of the plasmon losses, as qualitatively seen in figure 4. Gas adsorption also leads to an increase of spectral background, similar to LEED (see above).
The strong reduction of the plasmon intensity upon gas adsorption is again a sign of increased scattering that also results in widening of the plasmon losses, as qualitatively seen in figure 4. Gas adsorption also leads to an increase of spectral background, similar to LEED (see above).
4. Conclusions
As our results show, the influence of adsorption of oxygen and atomic hydrogen on order and plasmonic properties on the atomic chain system Si(775)–Au bares similarities concerning disorder, mostly to the Si(557)–Au system, which has a very comparable step density, but a different local arrangement at the steps. Also there, a similar phenomenology—rehybridization, bandgap opening, changes in band order and adsorption induced disorder—was found and modeled in detail [10, 12], but the net effects are much more drastic for both adsorbates in the present case, presumably due to the different local structure. Although a similar origin of the observed phenomena can be concluded for the system investigated here, we cannot identify the relative contributions of the proposed mechanisms since an exact geometrical structure of the system investigated here is still not known.
Interestingly, atomic H acts as an electron donor also on the surface investigated here. This electron transfer is obviously coupled to the general dimerization of the Au chains, similar to Si(553)–Au [7, 20], so that the amplitude of dimerization increases and counteracts in part the disorder introduced by the adsorbate.
While the changes of plasmon dispersion can be rationalized by comparing to the previously investigated similar systems, adsorbate induced disordering seems to be more pronounced in the system investigated here, probably due to the higher reactivity of the surface at the step edges. While the macroscopic surface structure of Si(775)–Au surface is highly robust under hydrogen and oxygen exposure, the adsorbates mostly destroy the long-range Au superstructures.
Similar to other systems within this class of atomic Au wires on stepped Si surfaces, this system is governed by strong hybridization with the Si surface states and their modification so that no typical signatures of 1D physics were observed.
Acknowledgments
We gratefully acknowledge financial support by the Deutsche Forschungsgemeinschaft within the research unit FOR 1700 (Project Te386/10-2) and by the Niedersächsisches Ministerium für Wissenschaft und Kultur through the graduate school 'contacts in nanosystems'.
Data availability statement
The data that support the findings of this study are available upon reasonable request from the authors.