
Abstract
We realize an experimental facility for cooling and trapping strontium (Sr) atoms and measure the Landé g factor of 3D1 of 88Sr. Thanks to a novel repumping scheme with the 3P2 → 3S1 and 3P0 → 3D1 combination and the permanent magnets based self-assembled Zeeman slower, the peak atom number in the continuously repumped blue magneto-optical trap is enhanced by a factor of 15 with respect to the non-repumping case, and reaches ∼1 billion. Furthermore, using the resolved-sideband Zeeman spectroscopy, the Landé g factor of 3D1 is measured to be 0.4995(88) showing a good agreement with the theoretical value of 0.4988. The results will have an impact on various applications including atom laser, dipolar interactions, quantum information and precision measurements.
Export citation and abstract BibTeX RIS

Original content from this work may be used under the terms of the Creative Commons Attribution 4.0 licence. Any further distribution of this work must maintain attribution to the author(s) and the title of the work, journal citation and DOI.
1. Introduction
The growing importance of laser-cooled atomic strontium (Sr) is starting to emerge in diverse fields, where in particular large atom numbers and high density are required, such as precision metrology [1–9], continuous Bose–Einstein condensation [10, 11], quantum simulation [12–14] and prospects toward long range dipolar interactions [15–17]. The barrier to the realization of large atom numbers is considerable atom losses during the first cooling and trapping stage. The involved energy levels of Sr are shown in figure 1. When operated on the 1S0 → 1P1 cooling transition, atoms can decay to 3P1,2 states via 1D2. The 3P1 atoms will decay back to the ground state, and hence closing the cooling cycle, while the 3P2 state is essentially causing atoms to be lost from the magneto-optical trap (MOT) due to the 17 min lifetime of 3P2 [18]. Thus, we need repumping to tackle this issue. So far various repumping schemes for Sr have been demonstrated including single-laser repumping schemes addressing transitions to higher-lying states, such as 1D2 → 5s6p1P1 [19], 5s5p3P2 → 5snd3D2, 5p2 3P2 [8, 20–24], and the most common dual repumping scheme combining 3P0,2 → 3S1 at 679 nm and 707 nm, respectively [25, 26].

Figure 1. A simplified electronic level structure of 88Sr. The first and second cooling stages work on the 1S0 → 1P1 at 461 nm and 1S0 → 3P1 at 689 nm, respectively. The 707 nm and 679 nm transitions can be used for repumping. In our case we use 707 nm and 2.6 μm (3P0 → 3D1) for repumping. The branching ratios of 3S1 → 3P0,1,2 and 3D1 → 3P0,1,2 are 11.1%, 33.3%, 55.6%, 59.4%, 38.7% and 1.9%, respectively.
Download figure:
Standard image High-resolution imageIn this paper we explore a novel dual repumping scheme for Sr, where the combination of 3P0 → 3D1 at 2.6 μm and 3P2 → 3S1 at 707 nm is used. The repumping scheme together with a self-assembled Zeeman slower allows loading 1 billion atoms into a continuously repumped MOT at our oven temperature of 560 °C. Similar atom numbers have been reported in the past [27]. However, these measurements required relatively higher temperature of their oven. In addition, we measure the Landé g factor of the 3D1 state using the resolved-sideband Zeeman spectroscopy, and the result shows a good agreement with the theoretically calculated value. These results pave the way toward future applications using these short-IR lasers to explore more physics in Sr, such as long range dipolar interactions [16].
2. Experimental setup
We employ the standard six-beam MOT of alkaline earth atoms as the experimental setup for cooling Sr atoms, shown in figure 2. Two ion pumps of 25 L s−1 each placed close to the atomic source prevent the pressure around the oven from rising when in operation. A self-assembled Zeeman slower placed after the oven provides a high-flux atomic beam with a significant portion of atoms within the capture velocity of the MOT of 70 m s−1. The science chamber is a custom made spherical octagon made of titanium which has a side length of 35 mm and depth of 36 mm. The third ion pump with a pumping speed of 2.5 L s−1 is added near the science chamber to further improve the vacuum. We achieve a pressure of 1 × 10⁻¹¹ mbar inside our science chamber. A CCD camera (Andor Zyla 5.5) is used to detect fluorescence from MOT.
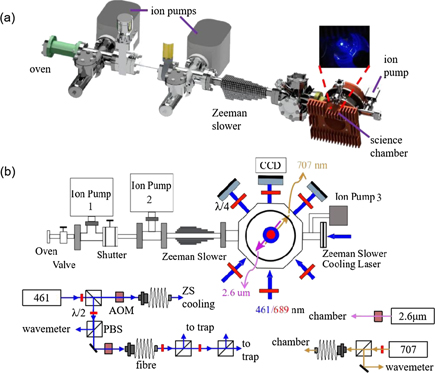
Figure 2. The experimental setup for cooling and trapping Sr atoms. (a) CAD drawing of the setup consisting of the self-assembled Zeeman slower and the science chamber. Inset: a typical image of a blue MOT consisting of 9.8 × 10⁸ atoms. (b) Schematic diagram of the experimental setup including the plan of cooling and trapping laser beams. Blue arrows represent 461 nm laser beams; the directions of 707 nm and 2.6 μm beams are pointed inward and outward, respectively; CCD, camera for taking images of atoms; λ/2, half-wave plate; AOM, acousto-optic modulator; PBS, polarization beam splitter; ZS, Zeeman slower.
Download figure:
Standard image High-resolution imageThe cooling and trapping light at 461 nm, generated by frequency doubling 922 nm light from a SolstiS Ti:sapphire laser and doubling unit from M squared lasers, has a total power of 550 mW at 461 nm. A small sample of the output is coupled to an optical fiber for frequency stabilization and monitoring with a wavemeter (WSU2 from highfinesse). The wavemeter has a resolution of 2 MHz and is calibrated with an SLR-780 rubidium reference laser. The main output of the 461 nm laser is divided into three branches: the Zeeman slower beam, the probe beam and the MOT beam. All the three beams are coupled to an optical system including acousto-optical modulators (AOMs), polarization beam splitters (PBSs), waveplates, fiber couplers, etc, delivering light to the experiment. The laser power can be precisely controlled by AOMs driven by a direct digital synthesizer (model EVAL-AD9959). The MOT beams are expanded to 1 cm in radius and the slower beam is focused to be 1.1 mm at the oven nozzle.
We employ 3P2 → 3S1 at 707 nm and 3P0 → 3D1 at 2.6 μm instead of 3P0 → 3S1 at 679 nm as repumpers. The two repump lasers of 707 nm and 2.6 μm are home-built with a power of 2.5 mW and 7 mW, respectively. The 707 nm laser is locked to the wavemeter while 2.6 μm laser is free running at this stage.
A Zeeman slower is required for the preparation of a high-flux source of cold Sr. Our Zeeman slower based on reference [28] is a permanent magnet Zeeman slower based on spherical NdFeB magnets. It is a longitudinal-field Zeeman slower and uses only σ+ or σ− polarized light. The slower is mechanically stable, quick to assemble, and does not need a mechanical holder. Atoms with the velocity between 200 m s−1 and 350 m s−1 can be slowed down by the slower and captured in the MOT. The most probable velocity of atomic beam is reduced from 400 m s−1 to 94 m s−1 by the slower, and the velocity width is narrowed from 370 m s−1 to 26 m s−1. The capture efficiency of the slower is 34%.
3. Novel repumping scheme
By heating the oven up to 560 °C, it effuses an atomic beam with a high flux of 2.8 × 10¹¹ s−1. Under the typical condition, the combined MOT beams at 461 nm have an intensity of 19 mW cm−2 (∼0.5Is), 1/e2 radius of 10 mm and a detuning of −40 MHz (1.25Γ). The magnetic field gradient is 55 G cm−1. The experimental loading processes of MOT operating on the 1S0 → 1P1 transition at 461 nm, which is known as blue MOT, in different cases are shown in figure 3. The atom number of 2 × 10⁶ is collected in the MOT without Zeeman slowing and repumping beams. In the case of only 707 nm repumper, the loading efficiency of MOT is around 3% limited by the atom loss through 3S1 → 3P0. When the slowing beam and 707 nm and 2.6 μm repumpers are turned on, the steady-state atom number is enhanced by a factor of 15 with respect to the non-repumping case, while the factor is around 11 in the case of 679 nm repumper replacing the 2.6 μm repumper, resulting in an enhancement ratio of 1.4 between them. Due to the uncertainty of atom number measurements, the above ratio could range from 1.3 to 1.5. The laser intensity of both 2.6 μm and 679 nm lasers is 20 mW cm−2 while in operation.

Figure 3. The dependence of atom number in a blue MOT on Zeeman slower beam and two repumping beams. The solid curves represent our model fits. All the dots with different colors represent the experimental data.
Download figure:
Standard image High-resolution imageTo examine the enhancement of steady-state MOT atom number induced by repumping lasers, we use timedependent trap loading equation

Here, N is atom number in an MOT, L (=3 × 10⁹ s−1) is MOT loading rate, Γ is one-body loss rate, β' = β/(2√2V), where β is two-body loss constant and V is an effective volume for two-body processes. The solution to this differential equation is

where Nss is the steady-state MOT atom number, γ represents the total loss rate and χ is relative contributions of the one- and two-body loss coefficients. They are given by


We use this model to fit our experimental data for three different repumping schemes as shown in figure 3. One- and two-body loss rates can be extracted from the fits. The case of 2.6 μm is fitted with the two-body fit with Γ = 2.54 ± 0.05 s−1 and β = 6.40 ± 0.34 × 10⁻¹² cm3 s−1. In the case of 679 nm scheme, Γ = 3.03 ± 0.05 s−1 and β = 8.89 ± 0.34 × 10⁻¹² cm3 s−1. The results indicate that the relatively smaller one-body loss rate in 2.6 μm case leads to an enhancement of the steady-state atom number, in comparison with 679 nm case.
Next, to find out the dependence of steady-state atom number on the intensities of repumpers, a set of rate equations is used. This has been applied in single-laser repumping schemes [23, 24, 29]. Here, we extend it to a dual repumping scheme, i.e. 707 nm and 2.6 μm repumpers in our case. There are eight states involved in our case which are labeled with numbers shown in figure 1. The rate equations of these states are given by
where Γij are transition rates from i to j. B, θ and α are pumping rates of the 461 nm, 707 nm and 2.6 μm transitions, respectively, which are proportional to their respective laser intensities. The intensity of 19 mW cm−2 for 461 nm laser results in B = 3.8 × 10⁷ s−1. The loss rate Γd is added to all the levels involved in repumping that are dark for the cooling light [30]. The value for which can be deduced from the fit to experimental data. All the transition rates and branching ratios of these states are summarized in table 1. By solving the equations, we obtain the dependence of steady-state atom number on the pumping rates α and θ. This is plotted in figure 4(a). The atom number increases as the pumping rates of 707 nm and 2.6 μm lasers increase. The blue area shows that the atom number is very low when the laser intensity of either 707 nm or 2.6 μm is small. The atom number is the same along the contour lines.
Table 1. Transition rates (Γ), branching ratios for relevant transitions of Sr. Data are referred from references [23, 30].
| Transition | Transition rate (×105 s−1) | Branching ratio (%) |
|---|---|---|
| 1P1 → 1S0 | 2000 | — |
| 1P1 → 1D2 | 0.039 | 0.002 |
| 1D2 → 3P2 | 0.0066 | 33.3 |
| 1D2 → 3P1 | 0.0134 | 66.7 |
| 3S1 → 3P2 | 400 | 55.6 |
| 3S1 → 3P1 | 260 | 33.3 |
| 3S1 → 3P0 | 87 | 11.1 |
| 3D1 → 3P2 | 0.088 | 1.9 |
| 3D1 → 3P1 | 1.8 | 38.7 |
| 3D1 → 3P0 | 2.8 | 59.4 |
| 3P1 → 1S0 | 0.47 | — |
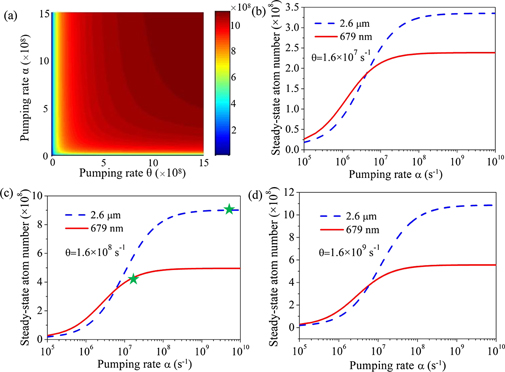
Figure 4. (a) The dependence of steady-state MOT atom number on pumping rates of α and θ. (b)–(d) show the steady state MOT atom number as a function of pumping rate of α for 2.6 μm (blue dashed curve) and 679 nm (red solid curve) cases when θ = 1.6 × 10⁷ s−1, θ = 1.6 × 10⁸ s−1, θ = 1.6 × 10⁹ s−1, respectively.
Download figure:
Standard image High-resolution imageWe apply the same rate equations to the 679 nm case to make a comparison with 2.6 μm case. The only difference in the 679 nm case is that there is no |6〉 involved. Thus the rate equations of |4〉, |5〉, |7〉 and |8〉 are revised as follows
The steady-state MOT atom numbers for the 2.6 μm (blue) and 679 nm (red) cases as a function of pumping rates α at different values of θ are plotted in figures 4(b)–(d). Other parameters are kept the same for both cases. The atom numbers in both cases increase and reach a saturation value as a function of α with θ being fixed. When 2.6 μm and 679 nm lasers are working at 20 mW cm−2, their corresponding pumping rates are 5.3 × 10⁹ s−1 and 1.8 × 10⁷ s−1. Utilizing the experimental parameters, we have simulated atom numbers for both cases. These are shown by stars in figure 4(c). The ratio between the two simulated atom numbers is calculated to be 2, which is in a reasonably good agreement with the averaged experimental ratio of 1.4. The reason for the discrepancy is due to the uncertainty of 4% in the atom number measurements.
4. Characterization of our MOT
We apply the dual repumping scheme of 707 nm and 2.6 μm transitions, together with the self-assembled Zeeman slower, to increase the atom number in a continuously repumped MOT. By optimizing magnetic field, laser powers, polarizabilities, detunings of MOT and slowing beams, at the oven temperature of 560 °C, 9.8 × 10⁸ atoms (1.4 × 1011 cm−3 for atom density) are collected in the continuously repumped MOT. This number is comparable to 8 × 10⁸ at 600 °C and 1.3 × 10⁹ at 630 °C, previously achieved in reference [27]. However, the oven temperature in our case is lower. We can enhance the atom number up to 1.5 × 10⁹ by heating the oven to 600 °C. Furthermore, the blue MOT temperature is measured using the time of fight (TOF) method [31]. The atoms are released from the trap and allowed to freely expand while they fall under gravity. The TOF images are taken by the CCD camera. The images at different TOF are shown in inset of figure 5. The measured temperature is 1.1(2) mK.

Figure 5. The radius of blue MOT as a function of time of flight. Inset: the images of atomic cloud at different time of flight.
Download figure:
Standard image High-resolution imageIn order to further characterize the setup, the lifetime of 3P2 magnetic trap is measured. The details are as follows. Firstly, atoms are continuously populated into 3P2 during the blue MOT process for 1.3 s loading time. Secondly, 461 nm laser is switched off but the magnetic field is held on for thold which can be varied. Finally, switch off magnetic field and switch on 707 nm, 461 nm probe laser and the CCD camera after thold. 3P2 magnetic trap atoms are detected by collecting the fluorescence. 2.6 μm repumping laser is kept on throughout. The corresponding sequence is shown in figure 6(a). The magnetic field gradient of 50 G cm−1 gives a magnetic trap depth of 38 mK. The measurements are shown with blue dots in figure 6(b). It indicates the lifetime of the magnetic trap to be 1.1 s, which is comparable to the reference [32].

Figure 6. (a) The magnetic-trap decay timing sequence. ZS: Zeeman slower; B: magnetic field gradient; CCD: charge coupled device camera. In the lifetime measurement, the atoms are continuously loaded into 3P2 for 1300 ms. (b) Lifetime measurement of 3P2 magnetic trap (blue solid circles). Fit is shown by the red curve. It indicates that the lifetime of the magnetic trap is 1.1 s.
Download figure:
Standard image High-resolution image5. 3D1 Landé g factor measurement
In alkaline-earth-like atoms, the g factors of 1S0 and 3P0,1,2 have been experimentally determined to estimate the Zeeman shift in optical clocks [33]. However, g factors of 3D states have not yet been measured. Here, we measure the Landé g factor of 3D1 using cold 88Sr atoms trapped in a blue MOT.
The resolved-sideband Zeeman spectroscopy is the key step for the g factor measurement. 88Sr atoms are continuously loaded into the blue MOT with the 2.6 μm and 707 nm repump lasers on throughout. A neutral density filter is inserted into the reflected MOT beam parallel to the anti-Helmhotz coil axis, and hence resulting an imbalance between the traveling-wave components. The cloud is pushed toward the reflected beam side due to the intensity imbalance. The 2.6 μm laser is frequency scanned to cover the splittings. Atoms excited to 3D1 by the resonant 2.6 μm laser will decay back to the 461 nm transition cooling cycle via 3P1 to the ground state. Through detecting the blue fluorescence with a photomultiplier tube, Zeeman spectroscopy of 3P0 → 3D1 is obtained while scanning 2.6 μm laser frequency. The procedure is repeated with different filters inserted in the same position. The experimental parameters of 2.6 μm laser are 80 μW power and 2.3 mm beam size. The scanning speed is set at 8 MHz s−1 and the magnetic field gradient in operation is 45 G cm−1.
Figure 7 shows the typical resolved-sideband Zeeman spectroscopy of 3P0 → 3D1. The three peaks correspond to m = 0 → m' = −1, 0, +1 from left to right. Here, a NE02A filter with OD = 0.2 is inserted which can produce 37% intensity difference. All the three peaks are fitted with a Lorentz function. They are broadened by three independent effects: (i) the intensity broadening, (ii) the linewidth of 2.6 μm laser and (iii) the Doppler broadening. The side peaks are additionally broadened by the magnetic field variation across the atomic cloud. The Doppler broadening is estimated to be 175 kHz at the temperature of 1.1 mK. The intensity broadening can be calculated as 4.4 MHz by the relationship  , where ΔvN is the natural linewidth of 3D1, Is is the saturated intensity for 3P0 → 3D1. The full width at half maximum (FWHM) of the three peaks are 18.3 MHz, 6.3 MHz and 14.7 MHz from left to right. The frequency shifts of the left and right side peaks relative to the central peak are 10.2 MHz and 10.8 MHz, respectively. The measured difference between the left and right peaks in FWHM and shift is mainly caused by the fitting uncertainty and the induced magnetic field variation by the atomic cloud within a laser scanning period.

Figure 7. A typical resolved-sideband Zeeman spectroscopy of 3P0 → 3D1. Experimental data (purple dots) are fitted with three independent Lorentz functions (colourful curves). The three peaks from left to right correspond to m = 0 → m' = −1, 0, +1 transitions. Inset: the Zeeman sublevels of 3D1.
Download figure:
Standard image High-resolution imageTo validate the experimental calibration of peak splittings and widths, we calculate them by the displacement (S) and atomic cloud radius (∆S/2) [34],

and

where ∆S and ∆W are the peak splitting and the FWHM difference between the central peak and side peaks. μB is the Bohr magneton, mJ = ±1 is the magnetic quantum number, and h is Planck's constant. For the case of the OD = 0.2 filter and the data shown in figure 7, S = 2.98 mm and ∆S/2 = 2.6 mm, which are transferred from the unit in pixel by 38 μm/pixel. According to equations (7) and (8), ∆S and ∆W are calculated as 9.4 MHz and 8.2 MHz, respectively, which are consistent with the experimental values of 10.5 MHz and 10.2 MHz. The slight increase of measured results is believed to arise from the experienced higher magnetic field by the atomic cloud in the experiment.
The Zeeman spectroscopy of 3P0 → 3D1 at different magnetic fields are detected to experimentally measure g value. In figure 8, we plot the Zeeman spectroscopy in three different field cases, i.e., no filter, NE01A filter and NE02A filter with intensity differences of 0%, 21% and 37%. As the intensity difference increases, the atomic cloud moves to the higher magnetic field region as shown in figure 8(a), and the mJ = ±1 levels are split more. Thus the two side peaks of Zeeman spectroscopy are more separated and broadened shown in figure 8(b). It is notable that all three peaks in the case of no filter are not completely overlapped, which is due to the spatial distribution of the cloud. Each case is repeated by 7 times. By the relation of g = ∆S h/(μBB), we can deduce the value of g factor as the seven dots shown in figure 9. The pink solid line means the mean value 0.4995 of these seven numbers, and the gray area represents 1 − σ confidence interval. The statistical error in g measurement is significantly contributed by the uncertainty in the magnetic field measurement caused by the inhomogeneity of quadruple magnetic field, imperfect optical path alignments and residual fields. The temperature of cold atoms does not contribute due to the negligible Doppler broadening compared with other types of broadening. The measuring precision of g factor could further be improved through optimizing the quadruple magnetic field and shielding the residual magnetic field.
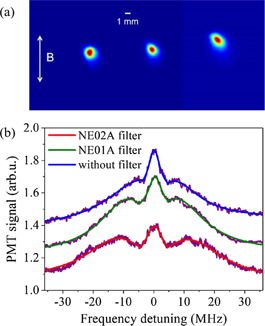
Figure 8. (a) The atomic clouds from left to right are located in the center of MOT (without filter), at a position of small magnetic field (with a NE01A filter) and higher magnetic field (with a NE02A filter), respectively. The cloud moves toward the reflected beam side along the magnetic field direction. (b) The Zeeman spectroscopy in the above three cases. Light dots represent experimental data and dark curves are fitted results for all three cases. The splitting of the Zeeman sublevels becomes larger and the amplitude of the signal is weaker as the magnetic field increases.
Download figure:
Standard image High-resolution image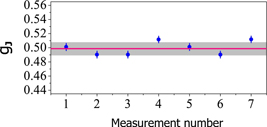
Figure 9. Summary of measurements of the Landé g factor of 3D1. The error bars show the uncertainty of the experiment. The solid line and the gray area represent the mean measured value and the 1 − σ confidence interval.
Download figure:
Standard image High-resolution image
To compare the measured g value with theoretically calculated one, we calculate it by the common Russel Saunders approximation [35, 36],
where L is the total orbital momentum quantum number, S is the total spin quantum number, J is the total electronic angular momentum quantum number. Here, gL = 1, gS = 2 × 1.001 1597 [37]. The value of gJ is calculated to be 0.4988 for 3D1 state of 88Sr, which is in good agreement with our mean measured value 0.4995.
6. Conclusion
In conclusion, we have presented an experimental setup for cooling and trapping of Sr atoms. The atom number trapped in the blue MOT can be enhanced up to a factor of 15 with the use of a self-assembled Zeeman slower based on permanent magnets and the dual repumping scheme, and the peak atom number in the continuously repumped MOT is approaching to 1 billion, yielding 1 × 1011 cm−3 for the atom density. The Zeeman slower is robust as well as quick to assemble. In the 3P2 magnetic trap, the lifetime is measured to be 1.1 s. Employing resolved-sideband Zeeman spectroscopy, the Landé g factor of 3D1 is measured to be 0.4995(88) showing a good agreement with the calculated value of 0.4988, which can be further improved by locking the 2.6 μm laser to a cavity. The results will have an impact on various applications including atom laser, dipolar interactions, quantum information and precision measurements.
Acknowledgments
Authors thank Alok Singh for productive discussions and Richard Barron for discussing the Zeeman slower. KB, YS, JJ and SZ acknowledge funding from the UK Quantum Technology Hub Sensors and Timing (grant EP/T001046/1). The authors are also grateful for receiving funding from the European Union's Horizon 2020 research and innovation programme under grant agreement No 820404 (iqClock project). MM acknowledges funding from the Defence Science and Technology Laboratory (Dstl). QU acknowledges funding from the Iraqi government.