

Abstract
We report the measurement of the absolute double differential cross sections (DDCS) of secondary electrons emitted due to the ionization of N2 molecule in collisions with fast electrons having energies between 3 and 5 keV. The emitted electrons with energies from 1–500 eV have been measured for different forward and backward emission angles. The measured DDCS have been compared with the state-of-the-art first Born approximation with correct boundary condition (CB1) model calculations as well as with the classical trajectory Monte Carlo (CTMC) method. From the measured DDCS, the single differential cross sections (SDCS) as a function of the emission energies have been computed and eventually the total ionization cross sections (TCS) have been derived. The TCS values are also compared with a semi-empirical calculation, namely, the CSP-ic (complex scattering potential-ionization contribution) model.
Export citation and abstract BibTeX RIS
1. Introduction
The interaction of a charged particle with an atom or molecule provides information about the fundamentals of dynamics involved in the few-body system being investigated. Depending on the energy and charge state of the projectile, different processes can occur between the two collision partners. The impact of electron on an atom or molecule, leading to single ionization of the target has been a subject of study over decades. Different mechanisms like ionization, excitation, elastic scattering, e–2e process etc [1] have been investigated over several years and many aspects of these processes are yet to be fully understood. The electron impact ionization of target atoms or molecules is not only important for understanding the collision dynamics but is also useful for other fields of research such as, mass spectrometry, plasma physics, astrophysics, stellar atmospheres and radiation chemistry etc [2–4]. Energetic electrons varying from few keV to hundreds of keV are present in the interplanetary medium. In the solar corona, different impulsive solar electron events are observed at energies between 2 and 15 keV. In the solar wind, the electrons have energy in the range from 20–200 keV [5]. In addition, the nitrogen molecule deserves a special care since it is one of the residual gas in the fusion reactors. In such devices although the aim is to produce clean plasma to achieve high fusion performance, the impurities, such as, nitrogen or other noble gases are required to protect the plasma facing components from extreme heat loads coming from the hot plasma. The typical energy of electrons in the fusion chamber vary around a few hundreds eV but the complete energy distribution of electrons is very broad ranging up to a few tens of keV. Thus an accurate knowledge of the ionization cross sections by a few keV electron impact is not only important for basic understanding of the collision mechanisms, but also for the wide scale applications in astrophysics and fusion research. In recent times, fast ion and electron impact ionization studies on biomolecules have gained immense importance due to it is applicability in cancer treatment using hadron therapy technique [6]. These studies demand a better understanding of the interaction mechanisms involving relatively smaller but multi-electron molecules, such as N2 or O2 etc.
Among the different aspects of electron impact ionization study, the determination of total ionization cross sections of atoms and small molecules have been investigated extensively both in the experimental and theoretical framework. The double differential cross section (DDCS) measurements of the electrons emitted from a target atom/molecule provide a detailed understanding of the collision dynamics. Such experimental investigations serve as a powerful tool for testing the accuracy of different theoretical models. Most of the work on electron impact ionization focuses on impact energies varying from threshold to several hundreds of eV, with limited data existing in the higher energy regime [7]. Particularly, the high energy (a few keV) electrons are ideally suited to explore the applicability of the fundamental atomic collision models which are based on the perturbative approach. Some of the earlier work deal with the resonances in e-scattering from the N2 at much lower energy, i.e., a few eV [8–14]. There are several theoretical and experimental studies on the e-impact ionization cross section [15–29]. However, the studies on the DDCS measurements for electron impact ionization [30–32] are very scarce. Besides providing information about the contribution of the valence shell electrons in the ionization process, the DDCS measurements also provide insight about the ionization from the inner shells of the target molecule. Such diatomic molecules are also well known candidates for studying the quantum mechanical aspects like Young type electron interference effect [33–35].
In this work, we have measured the e-DDCS for ionization of the N2 molecule in collisions with fast electrons having energies between 3 and 5 keV. The experimentally obtained electron-DDCS have been compared with the two different theoretical models, namely, the CB1 (first Born approximation with correct boundary conditions) and the CTMC calculations. The interpretation of the cross sections for a multielectronic target system is a challenging task for theoretical models. The CB1 approximation has been successfully employed to calculate the ionization cross sections for varieties of large molecules, such as, biomolecules and PAH molecules under the collisions of fast electrons or fast heavy-ions [36–42]. Furthermore, in order to assess the possible impact of different descriptions of the molecular wave functions on the ionization cross sections, here we have also carried out the ab initio calculations by using two different descriptions of the N2 molecule: the RHF/6-311G and CCSD/cc-pVTZ levels of theory. The main difficulty is caused by the many-body feature of the collision, involving the projectile, target nucleus and target electron(s). The CTMC method has been quite successful in dealing with the ionization process in ion-atom or ion-molecule collisions [43]. One of the advantages of the CTMC method is that the many-body interactions are exactly taken into account during the collisions on a classical level.
The structure of this paper is as following: in section 2 we have provided a brief outline of the experimental arrangement followed by a short note on the theoretical models in section 3. In section 4 we have dealt extensively with the experimental results and their comparison with the model calculations. Finally, the conclusion is added in section 5.
2. Experimental details
An electron gun capable of producing fast electrons with energies from 1–10 keV was mounted in a high vacuum chamber which was a 4-way-cross and maintained at a base vacuum of ∼1 × 10⁻⁸ mbar. A differential pumping assembly was installed after the electron gun chamber. This was followed by the main scattering chamber which was maintained at a base pressure of ∼5 × 10⁻⁸ mbar. The projectile electrons of energies 3, 4 and 5 keV were used in the present experiment. Two different sets of electrostatic lenses, deflectors and apertures were used to focus and collimate the electron beam. The projectile electrons collided with N2 gas in the scattering chamber. The scattering chamber was flooded with the target gas at an absolute pressure of 0.1 mTorr which was measured using a capacitance manometer. The differential pumping arrangement was used to maintain the pressure difference between the interaction chamber and the e-gun chamber. The secondary electrons emitted from the target gas were energy analyzed using a hemispherical electrostatic energy analyzer with an extended collimator at the entrance of the analyzer. The energy selected electrons were detected by a channel electron multiplier (CEM) mounted at the exit end of the spectrometer. Extreme cleanliness was maintained inside the scattering chamber in order to avoid any stray electric and magnetic field near the interaction region which would otherwise deflect the low energy electrons. The collection of the lowest energy electrons accurately is difficult since any fringe field could reduce the transmission of these electrons and hence the experimental uncertainties are large in this region. The Earth's magnetic field was reduced to about 10 mG near the interaction region by using suitable μ metal shielding inside the scattering chamber. Two layers of thin μ metal sheets were used for this purpose. In addition, a pre-acceleration voltage of 6 V was applied at the entrance and exit slits of the analyzer to enhance the collection efficiency of the low energy electrons. The resolution of the spectrometer was about 6%. The front of the CEM was raised to +100 V, since the detection efficiency of CEM remains constant (0.87 ± 10%) for electrons with energies between 100 and 600 eV (as known from the user manual of the CEM used [44]). The number of projectiles colliding with the target gas was obtained by measuring the beam current on a long Faraday cup which was electrically isolated from the main scattering chamber. The long Faraday cup was used to stop the flying away of the backscattered electrons from re-entering into the scattering chamber. A LabVIEW based data acquisition system was used for the entire data collection. The secondary electrons having energies from 1–500 eV were detected at 10 different angles between 30° and 145°. For every spectrum, the corresponding background spectrum was also collected in the absence of the gas which was subtracted from the electron spectrum obtained with the target gas. The statistical fluctuations varied from ∼2% for the lowest energy electrons in the forward angles to about 11% for the highest energy electrons in the backward angles. In addition, the errors are contributed from gas pressure fluctuations (∼5%), solid angle path length integral (∼10%), resolution of the spectrometer (∼10%) and detector efficiency (∼10%). The total uncertainties in each DDCS data was estimated to be about 18%–22%. Details about the analysis of the measured spectra is given in [45]. The experimental DDCS values are provided in a supplementary file (https://stacks.iop.org/JPB/53/235201/mmedia).
3. Theoretical models
3.1. CB1 model
The present ionization cross sections are calculated within the 1st Born approximation framework by using the partial-wave expansion formalism recently employed for describing the electron-induced ionization of isolated biomolecules [36–39]. In this approach, the incident/scattered electron is described by a plane wave whereas the ejected electron is modelled by a Coulomb wave associated to an effective target charge  where n refers to the principal quantum number of each atomic orbital component used in the molecular target description (see hereafter) and the active electron orbital energy
  is related to the ionization energies B of each occupied molecular orbital by = −B. Besides, it will be assumed that the passive (not ionized) electrons remain as frozen in their molecular orbitals during the collision, which permits us to reduce the electron target interaction potential to a one-active electron potential (see hereafter).
Under these conditions, the triply differential cross sections—hereafter denoted σ(3)(ΩS, Ωe, Ee)—differential in the direction of the scattered electron ΩS, differential in the direction of the ejected electron Ωe and differential in the ejected energy Ee may be written as

where N is the number of molecular orbitals used in the description of the target and with  expressed as a weighted sum of the atomic triply differential cross sections
  corresponding to the different components involved in the description of the N2 target (N1s
, N2s
, and N2p
orbitals), namely,
corresponding to the different components involved in the description of the N2 target (N1s
, N2s
, and N2p
orbitals), namely,

where the effective number of electrons ξj,i as well as the corresponding binding energy are calculated in the gas phase with the Gaussian 09 software (see Frisch et al [46]). In order to assess the possible impact of different descriptions of N2 molecular wave functions on the DDCS, ab initio calculations were carried out at both the RHF/6-311G and CCSD/cc-pVTZ levels of theory. The RHF/6-311G is a rather simple restricted Hartree–Fock description of the target with the medium accuracy Pople basis set 6-311G, while the CCSD/cc-pVTZ description is a more accurate coupled cluster calculation using both single and double substitutions from the Hartree–Fock determinant along with a much larger Dunning's correlation-consistent polarized basis set with triple-zeta. The first ionization energy corrected for zero-point vibrational energy (ZPE) was 16.900 eV with RHF/6-311G and 16.527 eV with CCSD/cc-pVTZ using Koopman's theorem. The ionization energy was further constrained to match the experimental value of 15.581 ± 0.008 for N2 in the gas phase [47].
Thus, in the laboratory framework, the atomic triply differential cross sections  were calculated from the atomic transition matrix element between the ground state to the 1st ionized level of the target. Then, by using the well-known frozen-core approximation which reduces the present multi-electron problem to a one active electron problem and considering the well-known partial-wave expansion of the plane wave as well as that of the Coulomb wave, the DDCS could be analytically expressed for each molecular orbital, the target ionization cross sections being simply obtained by summing up all the subshell contributions. Finally, singly differential and total cross sections were obtained after the numerical integrations over the scattering direction and the ejected energy spectrum, respectively.
3.2. CTMC model
The CTMC method is a non-perturbative method, where classical equations of motions are solved numerically [48–51]. In the present work the CTMC simulations were made in the three-body approximation, i.e. the many-electron target atom was replaced by a one-electron atom and the projectile ion was taken into account as one particle [52, 53]. For the target atom a central model potential has been used which is based on the Hartree–Fock method as developed by Green [54]. The potential can be written as:

where Z is the nuclear charge, N is the total number of electrons in the atom or ion, r is the distance between the nucleus and the test charge q, and

The potential parameters ξ and η can be obtained in such a way that they minimize the energy for a given atom or ion [55]. We treat the N2 molecule as two N atoms in our simulation and accordingly we use ξ = 1.179 a.u. and η = 2.27 a.u for the N-atom. Further, this type of potential has certain advantages, because it has a correct asymptotic form for both the small and large values of r.
In the present CTMC approach, Newton's classical non-relativistic equations of motions for a three-body system are solved numerically for a statistically large number of trajectories for given initial conditions. We have used an ensemble of 5 × 10⁷ trajectories. The equations of motion were solved using a standard Runge–Kutta method. A three-body, three-dimensional CTMC calculation is performed as described by Tőkési and Kövér [53]. The initial conditions of the individual collisions are chosen at sufficiently large internuclear separations from the collision center, where the interactions among the particles are negligible. These are selected in a similar fashion as described by Reinhold and Falcon [56] for non-Coulombic systems. A microcanonical ensemble characterizes the initial state of the target. The initial conditions were taken from this ensemble in such a way that initial binding energies of the N(2p) level (Eb = −0.5343 a.u.) and N(2s) level (Eb = −1.371 a.u.) were constrained. For ionization channel the energy and the scattering angles of the particles were recorded. These parameters were calculated at large separation of the projectile and the target nucleus.
The total and double differential cross-sections were computed using the following formulas:


In equations (5)–(6) TN is the total number of trajectories calculated for impact parameters less than bmax, and  is the actual impact parameter for the trajectory corresponding to the ionization process under consideration in the energy interval ΔE and the emission angle interval ΔΩ of the electron.
3.3. CSP-ic model for TCS
In addition to comparing the data with the CB1 and CTMC models, the total ionization cross section (TCS) data have also been compared with a semi-empirical model, namely the CSP-ic model [22, 57] which is used for calculating the ionization and excitation of varieties of molecules under electron impact. Since it has already been discussed in earlier papers we are providing a brief outline. Initially the total inelastic cross sections are calculated based on a complex scattering potential VCSC, constructed using the target molecular charge density which is obtained by a linear combination of the atomic charge densities. This potential can be expressed as:

While the real part of this interaction potential takes into account the static effect (VST), the exchange (VEX) between the projectile and a target electron and the polarization (VPOL) of the charge density cloud, the imaginary part is an absorption term (VABS) [59], responsible for the loss of scattered flux into the allowed channels of electronic excitation and ionization [58]. The partial wave approach under the spherical approximation is used to calculate the complex phase shifts δl (k) which carry the signature of the interaction between the incident electrons and the molecule [60]. To compute the TCS we define a ratio between total ionization cross section and total inelastic cross sections, R(Ei) [57], such that,

where  , Ei is impact energy and I is the ionization potential of the target. We evaluate the three constants c1, c2 and a to obtain R(Ei) and hence the total ionization cross sections.
4. Results and discussions
4.1. Energy distribution at fixed emission angles
Figure 1 displays the absolute DDCS of the secondary electrons emitted from N2 in collisions with 3 keV electrons. The DDCS spectra are shown for six different emission angles. The spectra fall by about four orders of magnitude in the measured emission energy range between 1 and 500 eV. The cross section is maximum in the lowest energy range corresponding to the soft collision mechanism and then falls rapidly with the increase in the emission energies. The soft collision mechanism involves very little momentum transfer from the projectile to the bound electrons of the target and hence these electrons are emitted for large impact parameter collisions. The intermediate part of the spectrum is normally dominated by the two-centre effect where the ejected electron is under the influence of both the projectile and the positively charged recoil target-ion. However, in case of electrons as projectiles, two centre effect does not play a major role unlike the case for a typical ion-molecule collision. The sharp peak observed at ∼350 eV corresponds to the K-LL Auger electron emission. The measured DDCS have been compared with the CB1 model calculations. The calculations have been performed using two different descriptions of the target wave functions at the RHF/6-311G and CCSD/cc-pVTZ levels of the theory. Both the calculations have been shown in figure 1 (solid and dash-dot-dot lines) and it is seen that in the log–log scale, the two models almost merge with each other. This suggests that the description of the target wave functions has very limited impact on the DCCS in the energy range considered here. In case of the forward angles, the CB1 model calculations underestimate the data upto about 60 eV, beyond which it shows overall good agreement with the data. For the intermediate angles, around 90°, the theory matches qualitatively and quantitatively with the measured DDCS above 50 eV. However, in case of backward angles, the model underestimates the data over the entire spectra, with maximum discrepancy occurring in the low emission energies. The ratio between the CB1 predictions using two different wave functions is found to vary very little i.e. from 1.01 in the forward angles to 1.04 for the higher backward angles (see insets in figure 1). The experimental data have also been compared with CTMC model calculations for twice the atomic nitrogen or 2N (red dashed line). Overall an excellent agreement is observed with this model over the entire energy regime. In figures 2 and 3, we have shown the energy dependence of the e-DDCS for the projectile energies 4 and 5 keV, respectively. In both the cases the CTMC model is seen again to match well with the data points except for the lowest energy electrons, where it predicts slightly higher cross sections. On the other hand, the CB1 model show a good qualitative agreement reproducing the shape of the energy distribution accurately. However, this model quantitatively underestimates the data below 70 eV for all the angles. For higher beam energy i.e. at 5 keV (figure 3) the CB1 model although predicts somewhat different cross sections from the experiment, but the difference is quite less compared to that for the 3 keV and 4 keV electron beam. The insets in each panel in figures 2 and 3 show the magnified view of the K-LL Auger peak.
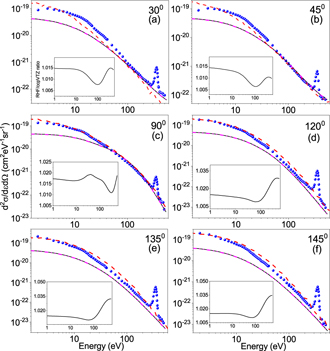
Figure 1. Absolute e-DDCS of N2 in collisions with 3 keV electrons: The lines corresponding to the CB1 calculations with the RHF/6-311G (black solid line) and the CCSD/cc-pVTZ (magenta dash-dot-dot line) descriptions of the target wave function. The difference between these two calculations are too small and therefore the ratio between them are shown in the insets. The CTMC model calculations for 2N are shown by the red dashed lines.
Download figure:
Standard image High-resolution image
Figure 2. DDCS of secondary electrons in case of 4 keV projectile electrons. The CB1 calculations (with RHF/6-311G wavefunction) are shown by black solid lines. The CTMC calculations are shown by red dashed lines. Inset: K-LL Auger peak of nitrogen for each emission angle.
Download figure:
Standard image High-resolution image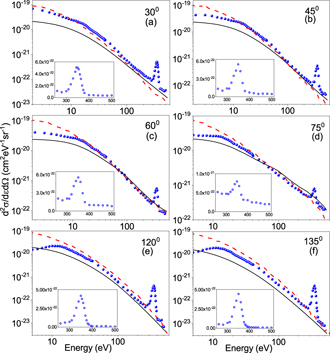
Figure 3. Similar to figure 2, except for 5 keV electrons.
Download figure:
Standard image High-resolution imageFigure 4 displays the theoretical (CB1) DDCS values as a function of the ejected electron energy for various emission angles. The calculated values are shown for incident electron energy of 3 keV. It may be noticed that in the low energy region, all the curves corresponding to the different emission angles bunch together. This region is dominated by the soft collision mechanism for which the DDCS remains almost independent of the emission angles. With the increase in the emission energies, the spectra corresponding to the intermediate angles, (i.e., 75°, 80° and 90°) start going up whereas the spectra for the forward and backward angles show a steady fall. The separation among different lines represent the angular distributions.
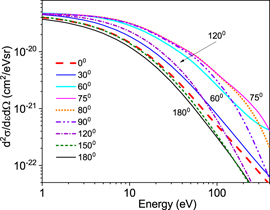
Figure 4. Theoretical (CB1) DDCS for different emission angles for 3 keV electron beam.
Download figure:
Standard image High-resolution image4.2. Angular distribution at fixed emission energies
To have a better understanding of the features seen in figure 4, the absolute DDCS of the ejected electrons as a function of different emission angles have been displayed in figure 5 corresponding to the projectile beam energy of 3 keV. The six plots shown in figure 5 expand over the entire emission energy range revealing the signature of different features at different parts of the spectrum. In figure 5(a) an almost flat distribution is observed corresponding to the soft collision mechanism which is dominated by large impact parameter events. For higher electron emission energies, a peak like structure starts appearing around 80° which sharpens further with the increase in the emission energies. This peak is due to the binary nature of collision i.e. the direct two-body free-electron scattering between the incident electron and the target electron while the recoil-ion remains passive. The CB1 model (black solid and magenta dash-dot-dot lines) show a qualitative agreement only but quantitatively underestimates the data, except in the peak region, where it matches well with the measured quantities. With the increase in the emission energies, it is seen that the DDCS values for the forward angles are slightly higher compared to those for the backward angles. For ejected electron energy 160 eV (figure 5(d)), the measured DDCS for forward angle is 1.6 times higher compared to the backward angle, whereas for 260 eV, the difference goes up to 2.6 times (figure 5(f)). These numbers, i.e. forward–backward angular asymmetry parameters, are close to that predicted by the CB1 model.
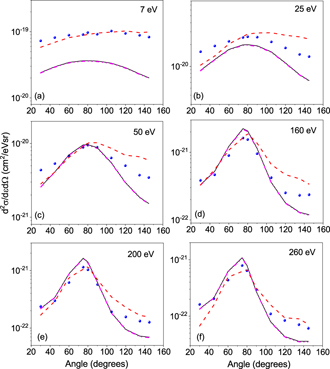
Figure 5. Angular distributions of e-DDCS for fixed secondary electron energies in case of incident energy 3 keV. Black solid and magenta dash-dot-dot lines represent the CB1(RHF/6-311G) and CB1(CCSD/cc-pVTZ), respectively. The CTMC calculations are shown by red dashed lines.
Download figure:
Standard image High-resolution imageIt is seen that the CTMC model show very good agreement with the data at 7 eV (figure 5(a)). However, with increase in emission energies, it is observed that the CTMC model predicts a higher cross section for the backward angles compared to that for the forward angles. Thereby the forward-backward angular asymmetry is not reproduced properly by the CTMC model unlike the cases for the experimental measurements and the CB1 model. Similar features are also observed for the impact energies of 4 keV (figure 6) and 5 keV (figure 7). In order to understand and correct this behavior we made some initial tests on the strength of the projectile electron and target electron interactions as modelled in the CTMC approach. As a result of the standard calculations (shown in the figures), the interaction between the two electrons is kept 'ON' during the entire motion of the particles till the asymptotic limit. However, as a initial test we also performed the simulations by switching off the e–e interaction in the exit channel. This indicated certain improvement in the distribution. However, further systematic calculations are required to be performed to improve the angular distribution. We conclude that the present CTMC model overestimate the strength of the electron–electron interactions particularly in the exit channel. The projectile electron sweep out the ejected target electron from the forward angles to the backward ones. The detailed analysis of this effect is in progress and will be published elsewhere.
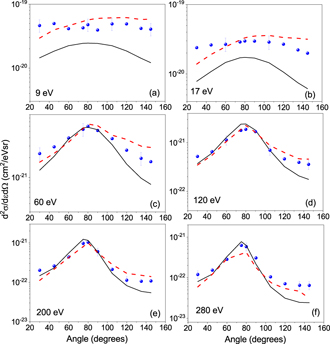
Figure 6. Similar to figure 5, shown for 4 keV electrons. The absolute errors are shown for some data points.
Download figure:
Standard image High-resolution image
Figure 7. Similar to figure 5 for incident energy 5 keV.
Download figure:
Standard image High-resolution image4.3. Single differential cross section
Integrating the e-DDCS spectrum over the emission energy or emission angle gives us the SDCS. Integrating over the emission energies, we obtain the SDCS i.e. dσ/dΩe, as a function of angles which is given by:

Similarly, integrating over the emission angles, we get the SDCS as a function of the emission energy:

Figure 8 displays the SDCS i.e., dσ/de as a function of the emission energies corresponding to 3, 4 and 5 keV incident energies. For all the three beam energies, the CB1 model predicts lower cross sections compared to the data upto ∼50–60 eV, beyond which one can observe a very good agreement. The discrepancy is largest for incident energy 3 keV and least for the 5 keV electrons. The measured DDCS have also been compared with the CTMC model (red dashed line). Overall an excellent agreement is observed with the CTMC model over the entire energy regime for all the three beam energies under investigation. However, in case of 4 and 5 keV (see figures 8(b) and (c)), the model overestimates the data for the lowest energy electrons only by a little amount.
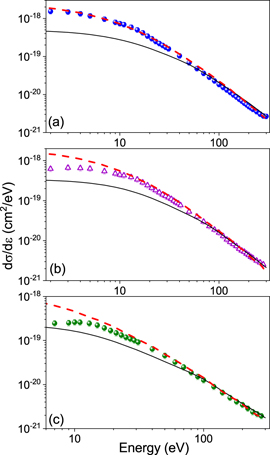
Figure 8. dσ/d as a function of emission energies for (a) 3, (b) 4 and (c) 5 keV incident energies; data compared with CTMC (red dashed line) and CB1 (black solid line) models.
Download figure:
Standard image High-resolution image4.4. Total ionization cross section
Integrating the SDCS over the emission energies or emission angles gives the total ionization cross section. The TCS were obtained by integrating over the electron energies between 1 and 500 eV and over the emission angles from θ = 0° to θ = 180°. The data points below 30° and above 145° were estimated by extrapolation to obtain the total cross section and the difference was found to be about 11%–13%. It was observed that the TCS values derived by integrating the SDCS over the emission angles and energies varied very little i.e. only by ∼0.3%–0.4%. In figure 9, the experimental and theoretical TCS values have been displayed which includes the data obtained for the incident energies of 7 keV [61] as well as for the 6 and 8 keV [62]. The total contribution of the K-shell ionization (σK−LL) for 3, 4 and 5 keV beam energies are 0.23 Mb, 0.21 Mb and 0.19 Mb, respectively, whereas, the TCS at these three energies were found to be 26.3 Mb, 16.8 Mb and 14.2 Mb.
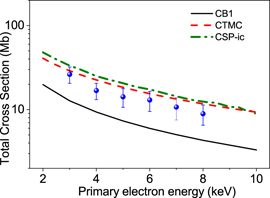
Figure 9. Total ionization cross section as a function of incident electron energy along with the predictions of three different models, i.e. the CB1, CTMC and CSP-ic.
Download figure:
Standard image High-resolution image
From figure 9 it is seen that the CB1 model falls well below the present experimental data but provides an excellent qualitative agreement with the observed energy-dependence. The CTMC model, on the other hand, falls a bit higher compared to most of the data points but mostly within the experimental uncertainties which are about 22%–27%. The present TCS values are found to be lower than the existing data [7] by about 20% to 40% (not shown). The CTMC calculations also fall below these existing data and the difference increases for higher energy. The CB1 model is closer to the present measurements and has a large deviation from the existing data. The TCS values predicted by the CSP-ic model overestimates the measured data for all the energies, but provides a good qualitative behavior regarding the energy dependence. This discrepancy could be due to the consideration of the spherical charge density of the N2 molecule and other approximations [63] used in the semi-empirical model. It is to be noted that the TCS calculations obtained using the two ab initio models, (CB1 and CTMC), lie below and just above the experimental values, respectively. The CTMC model provides closest agreement to the present data.
5. Conclusions
We have measured the absolute DDCS, SDCS and TCS of the secondary electron emission in ionization of N2 under the impact of 3, 4 and 5 keV fast electrons for emission angles between 30° and 145°. The experimental DDCSs spectra have been compared with the CB1 model calculations with two different target wave functions as well as with the CTMC model for twice of atomic nitrogen. No significant difference has been observed between the two sets of the CB1 model calculations corresponding to the two wave functions at the RHF/6-311G and CCSD/cc-pVTZ levels of theory. This suggests that the description of the target wave functions have very limited impact on the DDCS in the energy range considered here. The CTMC model provided a very good agreement with the measured data for the entire emission spectra except for certain energy-angle window region. The CB1 model predicted lower cross section values compared to the experimental data for all emission energies, with maximum discrepancy lying in the low emission energy region. Although the CTMC gives the closest representation to the experimental values, the forward–backward angular asymmetry of the DDCS is not reproduced properly by the CTMC model unlike the CB1 model and hence further investigations are required. The derived TCS values have been compared both with the ab initio CB1 and CTMC calculations as well as with the semi-empirical CSP-ic model. While qualitatively both the CB1 and the CSP-ic models show similar energy dependence, the CTMC gives the closest representation to the measured TCS values within experimental uncertainties.
Acknowledgment
One of the authors (M R C) would like to acknowledge the financial assistance from CSIR for the execution of this project. We acknowledge the technical support provided by Mr Nilesh Mhatre and Mr. W Fernandes. Sandia National Laboratories is a multi-mission laboratory managed and operated by National Technology and Engineering Solutions of Sandia, LLC., a wholly owned subsidiary of Honeywell International, Inc., for the US Department of Energy's National Nuclear Security Administration under Contract DE-NA0003525. The views expressed in the article do not necessarily represent the views of the US DOE or the United States Government.