

Abstract
One-dimensional (1D) magnetic nanostructures with high thermal stability have important industrial applications, but their fabrication remains a big challenge. Herein we demonstrate a scalable approach for the preparation of stable 1D γ-Fe2O3@carbon, which is also applicable for other metal oxide-core and carbon-shell nanostructures, such as 1D TiO2@carbon. One-dimensional ferric oxyhydroxide (α-FeO(OH)) was initially prepared by a hydrothermal method, followed by carbon coating through hydrothermal treatment of the resulting metal oxide in glucose solution. After calcination in N2 gas at 500 °C and subsequent exposure to air, the initial carbon-coated 1D α-Fe2O3 was converted to 1D γ-Fe2O3@carbon, which was very stable without any observed changes even after 1.5 years of storage under ambient conditions. The materials were then used as adsorbents and found to be highly selective towards Au (III) adsorption, of which the maximum adsorption capacity is about 600 mg Au/g sorbent (1132 mg Au/g carbon). The spent sorbent containing Au after adsorption can be readily collected by applying a magnetic field due to the presence of the magnetic core, and the adsorbed Au particles are subsequently recovered after the combustion and dissolution of the sorbent. This work demonstrates not only a facile approach to the fabrication of robust 1D magnetic materials with a stable carbon shell, but also a possible cyanide-free process for the fast and selective recovery of gold from electronic waste and industrial water.
Export citation and abstract BibTeX RIS
1. Introduction
Because of their small size and unique physical and chemical properties, one-dimensional (1D) nanostructures have found various applications, such as in microelectronics, information storage, photocatalysis, endoscopy, etc [1–7]. For example, Yang et al [4] reported that a SnO2 nanowire waveguide attached to the tapered tip of an optical fiber could guide visible light into the intracellular compartments of a living mammalian cell, and directly detect optical signals from subcellular regions with high spatial resolution. In computer hard drives, substitution of the magnetic thin film materials used for magnetic memory storage by magnetic nanowires was shown to increase data storage capacity [8].
However, 1D nanostructures often suffer from low thermal stability. In addition, the scalable preparation of 1D nanostructures is also quite difficult, particularly for magnetic nanostructures, which severely suffer from aggregation due to the attractive magnetic force, thus imposing a further challenge on their application. Coating 1D nanostructures with inert or other functional materials may provide a feasible solution to these technical problems as well as widen their application scope. For example, generating a nonmagnetic SiO2 boundary along the grains of CoPtCr could effectively decrease intergranular exchange coupling to produce high perpendicular anisotropy and to lower media noise [9]. Recently, Perineau et al reported the synthesis of α-FeO(OH) nanorods uniformly distributed in poly(hydroxyethyl methacrylate) with tunable alignment and orientation level of the particles [10]. In another work, Zhang et al reported the self-assembly of magnetic nanoparticles into 1D nanostructures with SiO2 coating, which exhibited high magnetic sensitivity [11]. In the presence of an applied magnetic field, the nanostructures could be oriented and aligned along the direction of the external magnetic field.
So far, many template-assisted synthesis methods have been developed to prepare 1D nanostructures, such as using polyelectrolytes [12], biomolecules [13], and carbon nanotubes [14, 15]. Previously, we prepared single-crystal and mesoporous α-Fe2O3 nanorods via hydrothermal synthesis using alkylamines (octylamine and isobutylamine) [16] and tetraethylammonium hydroxide (TEAOH) [17] as the structure-directing agent respectively, followed by calcination in air at 300 °C. The 1D and mesoporous α-Fe2O3 had a specific surface area of 100–140 m2 g−1 [17], much larger than that of commercial α-Fe2O3 (usually 10–30 m2 g−1), hence making it suitable as a catalyst support and sorbent. Later on, the utilization of microwave irradiation shortened synthesis time from several hours to several minutes [18]. However, the obtained 1D α-Fe2O3 is weakly ferromagnetic with limited applications and also structurally unstable as the 1D morphology would collapse at high-temperature calcination or reduction at around 450 °C. In the literature, there are several methods for the carbon encapsulation of nanoparticles, such as the arc-discharge plasma method [19] and chemical vapor deposition [20]. Several years ago Sun et al [21] prepared monodispersed colloidal carbon spheres by hydrothermal treatment of glucose solution at above 160 °C. This approach has been successfully used to prepare hybrid materials containing both metal oxide and carbon [22]. Therefore, we anticipated this approach would be able to generate surface carbon coating on our mesoporous α-Fe2O3 to stabilize the 1D morphology and reinforce its structure as well as its mechanical strength.
Carbon materials were found to exhibit good adsorption properties e.g. hollow mesoporous carbon spheres with magnetic cores were used to adsorb and separate bilirubin [23]. Industrially, activated carbon was employed to recover noble metals such as gold (Au), silver (Ag) and palladium (Pd), although the highly selective recovery of Au from the base metal solution remains a big challenge [24]. The recovery of noble metals, such as Au, is particularly important in the field of electronics, as an enormous quantity of electronic waste is generated annually [25]. For example, a ton of used cell phones contain roughly 350 g Au, 1.34 kg Ag, and 210 g Pd, while a ton of Au ore contains only ca. 0.9 g of this metal [26]. Conventionally, HCl-based leachate, such as Cl2/HCl and HNO3/HCl, has been widely used for the leaching of precious metals [27, 28]. For the effective recovery of each precious metal, selective and efficient separation from the chloride leach liquor is highly desirable. Previously, we found that both the block co-polymer molecules of Pluronic P-123 (HO(CH2CH2O)20(CH2CH(CH3)O)70(CH2CH2O)20H) and glucose-derived polymeric species have high affinity towards Au chloride [29, 30]. Wang et al also reported the high adsorption selectivity of glucose-derived carbon spheres towards Au ions [28]. Therefore, we anticipated this approach would be able to generate surface carbon coating on our mesoporous α-Fe2O3 to stabilize and reinforce the 1D morphology for various applications, such as the adsorption and separation of Au.
Herein, we report the preparation of metal oxide@carbon core–shell nanostructures (Fe2O3@C, TiO2@C) via hydrothermal coating of glucose-derived carbon materials on 1D α-Fe2O3. Interestingly, the calcination of carbon-coated 1D α-Fe2O3 under an inert atmosphere and subsequent exposure to air under ambient conditions generated magnetic 1D γ-Fe2O3@carbon, which was very stable without showing any degradation after 1.5 years because of the carbon shell protection. In addition, we have demonstrated that this carbon coating is applicable to other 1D metal oxides such as 1D TiO2, as shown in the supplementary material. Due to the high affinity of the carbon layer to Au ions and the strong magnetic core, the magnetic 1D γ-Fe2O3@carbon is highly selective for the adsorption of Au species and can be easily separated from aqueous solution upon application of a magnetic field. Because of this finding, a cyanide-free process for the fast and selective recovery of gold from electronic waste and industrial water becomes possible.
2. Methods
All chemicals were purchased from Sigma-Aldrich and Alfa Aesar, and were used without further purification. The procedures for sample preparation are illustrated in scheme
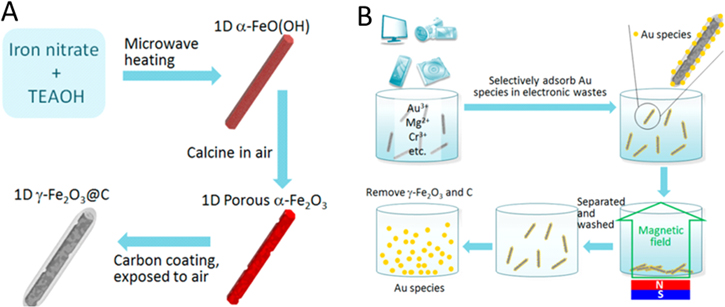
Scheme 1. (A) Preparation of 1D γ-Fe2O3@C from iron nitrate precursor and (B) selective adsorption of Au species from aqueous solution of mixed metal salts. The preparation of TiO2@C follows similar procedures as seen in the supplementary material.
Download figure:
Standard image High-resolution image2.1. Preparation of 1D α-Fe2O3
The preparation of 1D α-Fe2O3 follows the same procedure as has been reported previously [18]. Typically, 2.0 g of iron(III) nitrate was added into 20 ml of TEAOH (20 wt% in H2O), and the mixture was stirred for 20 min before being heated in a microwave oven for 5 min (100 W). Afterward, the sample was washed with DI H2O for five times using a centrifuge, dried at 60 °C for 24 h, and calcined at 300 °C in air for 1 h to obtain 1D α-Fe2O3.
2.2. Carbon coating on 1D α-Fe2O3
Glucose (0.57 g) was dissolved in 40 ml DI H2O, followed by the addition of 0.20 g 1D α-Fe2O3. The mixture was subjected to ultrasonic irradiation to obtain a homogeneous dispersion, after which it was transferred into a Teflon-lined autoclave and then heated up to 180 °C for 18 h. After being cooled to room temperature, the sample was repeatedly washed with water until the pH was ca. 7. The sample was then dried overnight to obtain a dark reddish-brown powder. A second carbon coating was carried out by repeating the above procedures. The carbon-coated samples were calcined at 500 °C in a N2 atmosphere for 2 h prior to any adsorption experiments to obtain γ-Fe2O3@C.
2.3. Metal adsorption
All adsorption experiments were carried out at room temperature. The metal salts used are as follows: (a) Zn(NO3)2.4H2O, (b) Ni(NO3)2.6H2O, (c) Cu(NO3)2.3H2O, (d) Mg(NO3)2.6H2O, (e) Cr(NO3)3.6H2O and (f) HAuCl4.xH2O. Certain amounts of the metal salts were added to 100 ml of ultrapure water to yield an initial concentration of 200 mg l−1. After that, 0.10 g γ-Fe2O3@C sorbent (Fe@C(2x)-500-N2) was added into the metal solution and the mixture was stirred for 24 h. During the stirring, 3 ml sample was taken out in an hourly interval for inductively coupled plasma optical emission spectrometry (ICP-OES) analysis. The liquid sample was centrifuged at 13 000 rpm for 5 min and 1 ml of the supernatant was retrieved and diluted for ICP-OES analysis to determine the metal ion concentration, while the remaining liquid sample was returned to the metal solution. The metal removal efficiency (equation (1)) and the equilibrium adsorption capacity (equation (2)) were calculated using the equations below:


where Ci is the initial metal concentration (mg l−1), Cf is the final metal concentration (mg l−1), qe is the equilibrium adsorption capacity (mg g−1), Ce is the metal concentration at equilibrium (mg l−1), V is the sample volume (ml) and m is the mass of the adsorbent (g).
2.4. Material characterizations
The morphology and the particle size were observed by a transmission electron microscope (TEM, JEOL-3010 at 300 kV). The crystal structure of the samples was characterized by powder x-ray diffractometry (XRD; Bruker D8 Advance diffractometer system) with a Cu Kα (1.5418 Å) source, while thermogravimetric analysis (TGA) was performed on a Q500 TA instrument in an air flow. The surface area was measured at 77 K (liquid nitrogen) on a Quantachrome Autosorb-6B surface area and pore size analyzer. Before the measurement, the samples were degassed at 200 °C for several hours. The pore size distribution was calculated with the Barrett−Joyner−Halenda method using the desorption isotherm branch. The specific surface area was determined according to the Brunauer–Emmett–Teller (BET) method in the relative pressure (p/p0) range of 0.05−0.3. The infrared spectra for dried samples were recorded on a Bio-Rad Excalibur spectrometer employing a KBr disc method. X-ray photoelectron spectroscopy (XPS) spectra were recorded in a Kratos AXIS Ultra DLD spectrometer and Al Kr radiation was used as the x-ray source. The C1s peak at 284.6 eV was used as a reference for the calibration of the binding energy scale. The saturation magnetization curves of the prepared samples were obtained on a vibrating sample magnetometer (VSM), Lake Shore model 7407, while the magnetic properties were investigated using a superconducting quantum interference device (SQUID), Quantum Design MPMS 3, from 10 to 300 K.
3. Results and discussion
3.1. Preparation and characterization of Fe2O3@carbon composite
One-dimensional Fe2O3 and its corresponding carbon-coated samples were prepared according to the procedures shown in scheme
Table 1. List of the prepared samples and their preparation conditions.
| Sample name | Sample phase | Calcination |
|---|---|---|
| Fe-300-Air | 1D α-Fe2O3 | 300 °C in air |
| Fe@C(1x) | 1D α- Fe2O3 coated with carbon (single coating) | — |
| Fe@C(2x) | 1D α- Fe2O3 coated with carbon (double coating) | — |
| Fe@C(1x)-500-N2 | 1D γ- Fe2O3 coated with carbon (single coating) | 500 °C in N2 |
| Fe@C(2x)-500-N2 | 1D γ- Fe2O3 coated with carbon (double coating) | 500 °C in N2 |
| Ti-300-Air | 1D TiO2 | 300 °C in air |
| Ti@C(2x) | 1D TiO2 coated with carbon (double coating) | — |
| Ti@C(2x)-500-N2 | 1D TiO2 coated with carbon (double coating) | 500 °C in N2 |
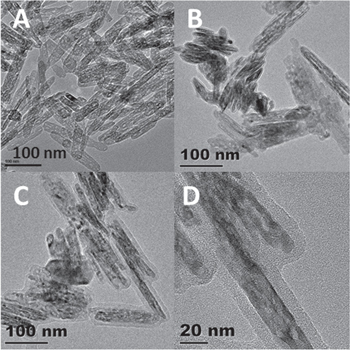
Figure 1. TEM images of (A) Fe-300-Air, (B) Fe@C(1x), and (C) Fe@C(2x) and (D) a higher magnification of (C).
Download figure:
Standard image High-resolution imageThe subsequent calcination of Fe@C(1x) and Fe@C(2x) at 500 °C in a N2 atmosphere and exposure to air transformed the initial α-Fe2O3 phase to γ-Fe2O3. The samples are denoted as Fe@C(1x)-500-N2 and Fe@C(2x)-500-N2, respectively. Structural analysis was conducted by XRD and high-resolution TEM (HRTEM). Figure 2 compares the XRD patterns of Fe@C(1x)-500-N2 (red line), Fe@C(2x)-500-N2 (blue line), and Fe-300-Air (pink line). From the XRD patterns we can see the formation of γ-Fe2O3 for the calcined samples, which is in agreement with the standard γ-Fe2O3 diffraction data (JCPDS 00-004-0755) both in the peak positions and the relative intensities. It is observed there is no peak at 2θ = 18.2°, which corresponds to the Fe3O4 (111) plane (JCPDS 82-1533), suggesting Fe@C(1x)-500-N2 and Fe@C(2x)-500-N2 contain negligible Fe3O4 phases. The TEM and HRTEM images of Fe@C(1x)-500-N2 after storage for 6 months are shown in figures 3(A) and (B). It is found that even after long-time storage at the ambient atmosphere, the morphology and the pore structure are still clearly discerned. From the HRTEM image shown in figure 3(B), the lattice spacing is measured to be 0.29 nm, which corresponds to the γ-Fe2O3 (220) plane. The selected area electron diffraction (SAED) pattern shown in the inset (between figures 3(A) and (B)) confirms the crystal structure of γ-Fe2O3, in good agreement with the above XRD results. The HRTEM image of Fe-300-Air (figure 3(D)) shows a lattice spacing of 0.25 nm, which is assigned to the α-Fe2O3 (110) plane, hence confirming the α-Fe2O3 phase of Fe-300-Air.

Figure 2. XRD patterns of Fe@C(1x)-500-N2 (red), Fe@C(2x)-500-N2 (blue) and Fe-300-Air (pink).
Download figure:
Standard image High-resolution image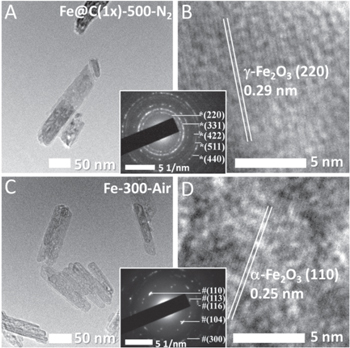
Figure 3. TEM and HRTEM images of (A) and (B) Fe@C(1x)-500-N2 and (C) and (D) Fe-300-Air.
Download figure:
Standard image High-resolution imageThe surface area analysis is presented in table 2 and it shows that the initial α-Fe2O3 nanorods (Fe-300-Air) have a specific surface area of 132 m2 g−1, a pore volume of 0.398 cm3 g−1, and a pore diameter of 11.7 nm, much larger than those of commercial non-porous α-Fe2O3, of which the surface area is usually between 10 and 20 m2 g−1. After carbon coating on the Fe2O3 nanorods (Fe@C(2x)), the surface area becomes 24.2 m2 g−1. However, after calcination in N2 at 500 °C (Fe@C(2x)-500-N2), the specific surface area increases to 162 m2 g−1, mainly due to the generation of micropores in the carbon layer, as indicated by the measured pore diameter (<2 nm).
Table 2. Surface area analysis of the prepared samples before and after calcination.
| Sample | Surface area (m2 g−1) | Pore volume (cm3 g−1) | Pore diameter (Å) |
|---|---|---|---|
| Fe-300-Air | 132 | 0.398 | 117 |
| Fe@C(2x) | 24.2 | 0.425 | 24.5 |
| Fe@C(2x)-500-N2 | 162 | 0.368 | 16.8 |
XPS analysis was used to further determine the oxidation state of the Fe element in the composite (figure 4). It is observed that the Fe 2p1/2 and Fe 2p3/2 peaks of both Fe@C(1x)-500-N2 (figure 4(A)) and Fe-300-Air (figure 4(B)) are accompanied by satellite peaks. The position of the satellite peak for Fe 2p3/2 is determined to be ∼719.0 eV for both samples. The satellite peak is attributed to Fe3d–O2p hybridization and suggests that both samples have a composition of Fe2O3 [31]. No satellite peak is observed around the binding energy of 715.5 eV, which rules out the existence of Fe2+. Also, the absence of the characteristic Fe2p peak for metallic Fe at 706.6 eV excludes the presence of Fe0 clusters [32].
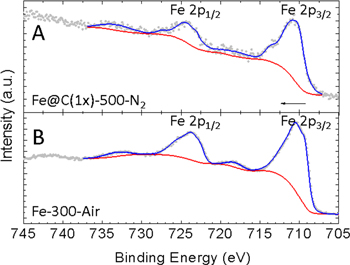
Figure 4. X-ray photoelectron spectroscopy (XPS) analysis of (A) Fe@C(1x)-500-N2 and (B) Fe-300-Air.
Download figure:
Standard image High-resolution imageFigure 5 shows the TGA results of Fe-300-Air, Fe@C(2x), and Fe@C(2x)-500-N2 in air from room temperature up to 800 °C. Without carbon coating, Fe-300-Air hardly exhibits any weight loss in the examined temperature range, except for moisture loss from room temperature up to 200 °C. After double coating with carbon, the weight loss is very significant, mainly due to the combustion of carbon, which starts at 250 °C and ends at 500 °C. The carbon composition can be deduced from the weight loss of about 61.5 wt% before calcination in N2 (Fe@C(2x)) and 53.2 wt% after calcination in N2 (Fe@C(2x)-500-N2). The decrease of carbon content after calcination is due to the removal of functional groups, such as –COOH, –OH, and –C=O, during calcination. This carbon amount is higher than that of the sample with single carbon coating (Fe@C(1x)-500-N2), which is ca. 37%.

Figure 5. TGA profiles of Fe-300-Air, Fe@C(2x), and Fe@C(2x)-500-N2. The analysis was carried out in air from 25 °C to 800 °C.
Download figure:
Standard image High-resolution imageMagnetic measurements are carried out to demonstrate the magnetic properties of the freshly prepared and 6-month aged samples (figures 6 and 7) by subjecting them to a VSM. It can be seen from the magnetic hysteresis loops (figure 6) that the 6-month old Fe@C(1x)-500-N2 (black solid line) and the fresh sample (red solid line) have a saturation magnetization (MS) of ∼47 emu g−1, while Fe@C(2x)-500-N2 (green solid line and blue solid line) has a MS of ∼32 emu g−1. It should be noted that the saturation magnetization here is calculated by using the total weight of each sample. The results show that there is no difference in the magnetization values for the freshly prepared samples and the aged ones, indicating excellent magnetic stability under ambient storage. By considering the weight of the carbon amorphous layer obtained from TGA, the corrected saturation magnetizations of sample Fe@C(2x)-500-N2, as shown by the green and blue dashed lines, are ∼72 emu g−1, quite close to the MS value of bulk γ-Fe2O3 (76.3 emu g−1), giving further evidence that the core phase is γ-Fe2O3 [33]. On the contrary, Fe-300-Air has a very small MS of 0.4 emu g−1, affirming that it is non-ferromagnetic α-Fe2O3 (the bulk MS is 0.4–1.9 emu g−1) [34]. In figure 7, Fe@C(1x)-500-N2 and Fe@C(2x)-500-N2 are further characterized by the SQUID from 10 to 300 K. Magnetic hysteresis measurement by the SQUID agrees well with the VSM measurement at room temperature. With the increase of temperature from 10 to 300 K, the measured saturation magnetization and coercivity of both samples are decreased due to thermal fluctuations of the magnetic moments and a reduced magnetocrystalline anisotropy field, respectively. The temperature dependence of magnetic moments between 10 and 300 K is also measured under field-cool (FC) and zero-field-cool (ZFC) conditions. In the FC measurement, the sample was first cooled down from 300 to 10 K under an applied magnetic field of 500 Oe. The magnetic moment was then measured as the temperature was raised from 10 to 300 K. In the ZFC measurement, the sample was cooled to 10 K without applying a magnetic field and magnetic measurement was then performed when heating the sample to 300 K. It can be seen in figures 7(C) and (D) that both samples do not show a Verwey transition at ∼120 K, which is a characteristic behavior of Fe3O4. The measurements exclude the presence of Fe3O4 and again suggest that the sample core is γ-Fe2O3.
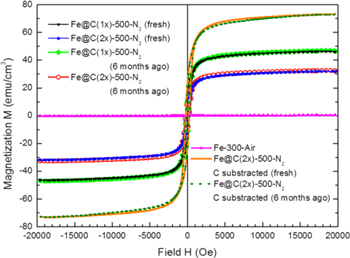
Figure 6. The saturation magnetization curve of each sample measured by a vibrating sample magnetometer: Fe@C(1x)-500-N2, fresh (black); Fe@C(2x)-500-N2, fresh (blue and orange); Fe@C(1x)-500-N2, 6 months old (light green); Fe@C(2x)-500-N2, 6 months old (red and dark green); Fe-300-Air (pink).
Download figure:
Standard image High-resolution image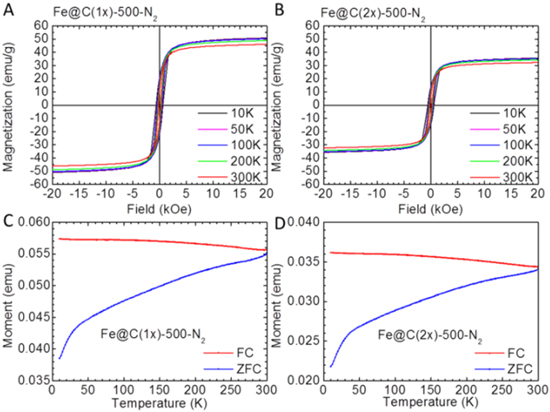
Figure 7. Magnetic properties of the sample investigated using a superconducting quantum interference device (SQUID; Quantum Design MPMS 3) magnetometer from 10 to 300 K. (A and C) Fe@C (1x)-500-N2; (B and D) Fe@C (2x)-500-N2.
Download figure:
Standard image High-resolution imageThe above results and our previous work [17] clearly demonstrate that the initially formed 1D α-Fe(O)(OH) was converted to 1D and porous α-Fe2O3 after calcination in air at 300 °C. This phase structure was maintained after the hydrothermal carbon coating. An evaluation of the FTIR spectra (figure 8) shows the characteristic Fe-O stretching bands in α-Fe2O3 at 445 and 529 cm−1. After fresh calcination in N2, because of the partial reduction, an Fe3O4 phase may be initially formed. This is evident from the FTIR spectra (figure 8) of the fresh Fe@C(2x)-500-N2, which shows a single Fe-O vibration at 566 cm−1 that is attributed to the Fe3O4 phase, as has been reported elsewhere [35, 36]. However, after exposure to air, this Fe3O4 phase was re-oxidized to γ-Fe2O3, suggesting oxygen molecules could effectively penetrate the carbon layer due to its porous nature and oxidize the Fe3O4 core. Dar et al [37] reported that the conversion of Fe3O4 to γ-Fe2O3 took place at ca. 200 °C, while that of γ-Fe2O3 to α-Fe2O3 occurred at ca. 500 °C. Jia et al [38] prepared single-crystal α-Fe2O3 nanorings and converted them to Fe3O4 after a reduction in H2 gas at 360 °C, and the latter was converted to γ-Fe2O3 after exposure to air at 240 °C. However, this conversion is also dependent on the interaction between iron oxide and the support. As previously reported, the complete transformation of γ-Fe2O3 to α-Fe2O3 could be retarded to as high as 700 °C in the presence of amorphous Al2O3 support [39, 40]. Guo et al [23] also prepared magnetic composite spheres consisting of a magnetic core and a mesoporous carbon shell by direct replication from hollow mesoporous aluminosilicate spheres, followed by casting of iron nitrate solution, impregnation of the organic carbon source and carbonization, reduction of the α-Fe2O3 core to Fe3O4 and removal of the silica template. Compared to these literature methods, the route shown in this work is quite straightforward. The 1D α-Fe2O3 phase was reduced to Fe3O4 first, and the latter was re-oxidized into γ-Fe2O3 under ambient conditions within almost two weeks.

Figure 8. FTIR spectra of Fe-300-Air, Fe@C(1x), and Fe@C(1x)-500-N2.
Download figure:
Standard image High-resolution imageInterestingly, the 1D morphology and porous structure are well maintained even after the two-stage phase change, which should be attributed to the good protective characteristic of the carbon layer. This carbon layer is inert, amorphous and porous, in close contact with the iron oxide core but not rigidly enough, so that it can accommodate structural and volume changes. The formation of γ-Fe2O3 is important as it is a well-known magnetic material with extensive applications. More importantly, there is no degradation in the magnetic property after long storage in air (>6 months) (figure 6). In a recent analysis by TEM after 1.5 years of storage, the structure and morphology are still well maintained. Therefore, this work demonstrates a feasible and scalable route to prepare robust and stable 1D magnetic materials, overcoming the long-standing technical problem that 1D structures, particularly magnetic ones, are usually not very stable upon aging/heating. Similarly, the successful preparation and surface carbon coating of 1D TiO2 are shown in figures S1 and S2 in the supplementary material.
3.2. Sorption performance of carbon-coated iron oxides for noble and heavy metals
The adsorption study was performed by stirring Fe@C(2x)-500-N2 as a sorbent in Au solution with different concentrations (200 to 5000 mg l−1) for 20 h. The equilibrium adsorption curve in figure 9 was measured and used to calculate the maximum adsorption capacity of Au which is about 600 mg Au/g sorbent. By deducting the γ-Fe2O3 core, the maximum adsorption capacity is 1132 mg g−1 carbon, which is almost the highest Au adsorption capacity by carbon reported so far. Similar adsorption behavior with high capacity was observed for a TiO2@C system (figure S3) as compared to γ-Fe2O3@C, while both bare Fe2O3 and TiO2 have poor adsorption capacity towards Au (below 50 mg Au g−1 metal oxide). This indicates that the adsorption capacity of the composite nanostructures is mainly due to the surface carbon. It should be pointed out that, due to the presence of the magnetic core, the sorbent can be readily separated from the solution by simply applying a magnetic field. Figure 10 shows the adsorption properties of Fe@C(2x)-500-N2 towards Au3+, Cr3+, Cu2+, Mg2+, Ni2+ and Zn2+ ions. It was observed that the sorbent exhibits high adsorption selectivity to Au3+ but very low selectivity to other metal cations. The metal removal efficiencies for these metal ions are given in table 3, where Au3+ has the highest removal efficiency of 98%, while those of the other metals are below 4%. Mpinga et al [41] tested the adsorption behaviors of activated carbon for the cyanide salts of Au, Pt, Pd, Ni and Cu, and found the affinity of activated carbon is in the following sequence: Au > Pt > Pd > Ni > Cu. Zheng et al [42] utilized carbon material derived from banana peel for the adsorption of metal ions, which exhibits strong selectivity towards Au(III) while negligible affinity to other base metals, such as Cu(II), Pb(II), Ni(II), and Fe(III). The carbon material has the maximum Au adsorption capacity of 801.7 mg g−1 carbon, lower than what we obtained. In this case, one possible explanation is that the carbon is coated and dispersed on the surface of metal oxides, which exposes more adsorption active sites to Au as compared with bulk carbon or carbon not coated on a 1D nanostructure. In addition, glucose-derived carbon probably generates more defects acting as active sites for Au adsorption.
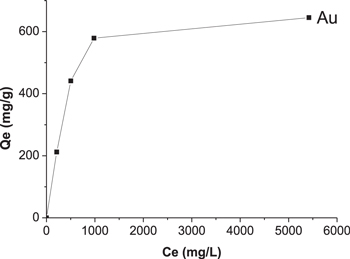
Figure 9. Equilibrium adsorption capacity against initial concentration of Au on Fe@C(2x)-500-N2.
Download figure:
Standard image High-resolution image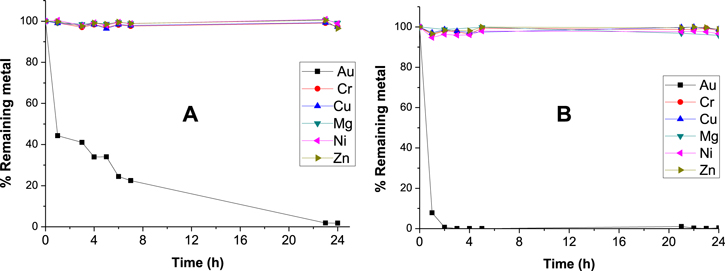
Figure 10. Selective adsorption of Au ions from aqueous solution containing Au, Cr, Cu, Mg, Ni and Zn ions by (A) Fe@C(2x) and (B) Fe@C(2x)-500-N2. The concentration of each metal ion was 200 mg l−1.
Download figure:
Standard image High-resolution imageTable 3. The removal efficiency of metal ions by Fe@C(2x)-500-N2 (200 mg l−1 of each metal).
| Metal removal efficiency (%) | ||||||
|---|---|---|---|---|---|---|
| Sample | Au(III) | Cr(III) | Cu(II) | Ni(II) | Mg(II) | Zn(II) |
| Fe@C(2x)-500-N2 | 98.2 | 2.7 | 2.7 | 1.1 | 0.8 | 3.6 |
The mechanism for Au ion adsorption is still not very clear. Traditionally, the adsorption of Au cyanide by activated carbon is believed to be due to the formation of Mn+-[Au(CN)2-], where Mn+ is a metal ion, such as Na+, K+ and Ca2+. The adsorbed Au species is finally reduced to a Au cluster [43]. Zheng et al [42] believed that –OH, –NH2 functional groups on the carbon surface are active for the selective adsorption of Au(III) ions. In the templated synthesis of Au nanoparticles on glucose-derived carbon species, it was confirmed that the –OH, C-O-C functional groups played an important role in anchoring Au species [30]. Wang et al [28] also prepared carbon spherules by hydrothermal treatment of glucose and observed the highly selective adsorption of Au(III) against Pd(II), Pt(VI), Rh(III), Fe(III), Cu(II) and Ni(II) ions. High selectivity towards Au(III) is also proposed due to the presence of surface –OH, C-O-C and –COOH groups, which are able to reduce Au(III) to Au0, as evident in TEM and XPS analysis. On the other hand, carbon nanotubes are also reported to be active in adsorbing some organic molecules and their interaction forces with the adsorbates include hydrophobic interaction, electrostatic interaction, etc [44]. In our case, sample calcination at 500 °C in N2 largely removes surface –OH and –COOH functional groups and generates amorphous carbon with a lot of defects. In contrast to conventional carbon materials, during the calcination process, glucose-derived carbon materials release a lot of gas molecules, such as CO2 and H2O, which will damage the integrity of the carbon structure and generate defects. It is reflected in the dramatic increase in surface area after calcination (table 2). As shown in figure 10, both the uncalcined and the calcined samples adsorb Au species with high capacity, but the former have a much lower adsorption rate than the latter. In the former, adsorption is mainly via surface groups, while in the latter, the formed structural defects should also exhibit significant contribution to Au adsorption besides the surface groups. The carbon defects are electron-rich centers which can adsorb molecular oxygen to form 
 species [45]. The latter can transfer electrons and further reduce Au(III) ions. In addition, these defects can interact with water molecules and generate new surface functional groups, which may attract Au(III) cations and promote Au reduction after several hours of stirring. The other metals such as Ni(II) and Cr(III) could not be reduced into their metal state, hence leading to weak interaction between the metal ions and the carbon surface, which renders low adsorption selectivity. Among the noble metals, Au(III) is highly reducible (metallic Au is the most stable state), thus leading to the highest adsorption selectivity. The reduction of Au(III) to metallic Au is confirmed by TEM analysis. Figure 11 shows the TEM images of the collected Fe@C(2x)-500-N2 after the adsorption study in 1000 and 2500 mg l−1 Au solution. It can be observed that there are a lot of metallic Au particles distributed on the carbon surface. In the case of the 1000 mg l−1 Au solution, the Au nanoparticles are quite uniform and usually below 5 nm in size, while in the latter case, the Au particles are larger, about 10–60 nm in size, which not only demonstrates that this composite is a very good sorbent for the selective recovery of Au from aqueous solution, but also confirms that the high selectivity towards Au is related to the high reducibility of Au cations. It is known that for the supported Au catalysts, the catalytic performance is usually dependent on the Au particle size, so this method provides a facile way to prepare supported Au catalysts on carbon with tunable Au particle size, which may have important application in catalysis [45]. In addition, the carbon structure on oxide materials may have changed electronic properties [46, 47]; hence it is possible that the high selectivity of 1D γ-Fe2O3@carbon is associated with the presence of a γ-Fe2O3 core, which should be further investigated in the future.

Figure 11. TEM images of Fe@C(2x)-500-N2 adsorbed with 1000 mg l−1 Au (A) and (B) and 2500 mg l−1 Au (C and D) from aqueous solution.
Download figure:
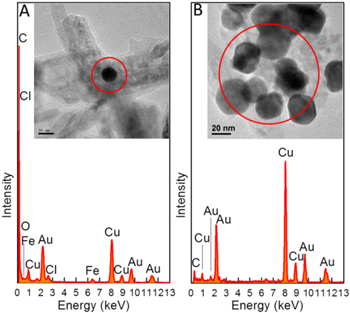
Standard image High-resolution imageAlthough the adsorbed Au particles can be recovered by washing the adsorbent with thiourea solution [48], we combusted the Au-adsorbed Fe@C(2x)-500-N2 in air at 600 °C to remove the carbon layer followed by dissolution of the γ-Fe2O3 core in HCl solution for a direct TEM observation of the Au particles. As a result, pure metallic Au particles can be retrieved, as shown by the EDX analysis in figure 12. Before the removal of carbon and iron oxide (figure 12(A)), strong C and Fe spectra are detected together with the Au spectra. After combustion and acid dissolution, the EDX signal for C drops dramatically while the signals for Fe and O completely disappear as seen in figure 12(B), leaving only strong Au signals together with Cu spectra that come from the copper grids. The TEM image shows that the recovered Au nanoparticles have sizes of 20–40 nm. Therefore, this confirms that a straightforward Au recovery method can be effectively performed after the adsorption procedure.
Figure 12. EDX spectra of (A) Fe@C(2x)-500-N2 adsorbed with Au nanoparticles and (B) Au nanoparticles after removal of carbon and Fe2O3. Inset: the corresponding TEM image.
Download figure:
Standard image High-resolution image
4. Conclusions
We have prepared robust fossil-like 1D mesoporous γ-Fe2O3@carbon and TiO2@carbon nanostructures via a two-step approach. One-dimensional α-FeO(OH) and anatase TiO2 are first prepared by the template method using TEAOH and organic amines as the structural directing agents respectively. After calcination in air, the 1D metal oxides are coated with carbon by hydrothermal treatment in glucose solution. XRD, TEM, XPS and magnetic measurements show that the α-Fe2O3 core is transformed to γ-Fe2O3 after calcination in N2 and subsequent exposure to air. Interestingly, the resulting γ-Fe2O3@carbon is very stable, of which the structure and magnetic property remained intact even after 1.5 years of storage in the ambient environment. In addition, the carbon thickness can be tuned by changing the glucose/metal oxide ratio or increasing the coating cycle. Acting as an adsorbent, γ-Fe2O3@carbon is highly selective towards Au(III) with maximum adsorption capacity of about 600 mg/g sorbent or 1132 mg g−1 carbon, which is almost the highest adsorption capacity as compared with the literature results. More important, the adsorbent can be readily separated from the aqueous solution upon application of a magnetic field due to the presence of the magnetic core. The mechanism for high selectivity towards Au(III) adsorption is believed to be related to the high reducibility of Au(III) cations, and the abounding defects on the carbon surface after calcination in N2 gas, which can interact with molecular oxygen and water to form negatively charged oxygen species and functional groups that can bind and reduce the Au(III) cations.
Acknowledgments
Z Zhong is grateful to the Agency for Science Technology and Research (A*STAR) and ICES for their financial support of this work. J Ding acknowledges the financial support from A*STAR research project SERC 1321202068 and NRF-CRP9-2011-01. P G and W X have equal contributions to this work.