

Abstract
The creation of a novel flexible nanocomposite fiber with conductive polymer polyaniline (PAni) coating on a polyethylene terephthalate (PET) substrate allowed for increased electrochemical performance while retaining ideal mechanical properties such as very high flexibility. Binder-free PAni-wrapped PET (PAni@PET) fiber with a core–shell structure was successfully fabricated through a novel technique. The PET nanofiber substrate was fabricated through an optimized electrospinning method, while the PAni shell was chemically polymerized onto the surface of the nanofibers. The PET substrate can be made directly from recycled PETE1 grade plastic water bottles. The resulting nanofiber with an average diameter of 121 nm ± 39 nm, with a specific surface area of 83.72 m2 g−1, led to better ionic interactions at the electrode/electrolyte interface. The PAni active layer coating was found to be 69 nm in average thickness. The specific capacitance was found to have increased dramatically from pure PAni with carbon binders. The specific capacitance was found to be 347 F g−1 at a relatively high scan rate of 10 mV s−1. The PAni/PET fiber also experienced very little degradation (4.4%) in capacitance after 1500 galvanostatic charge/discharge cycles at a specific current of 1.2 A g−1. The mesoporous structure of the PAni@PET fibrous mat also allowed for tunable capacitance by controlling the pore sizes. This novel fabrication method offers insights for the utilization of recycled PETE1 based bottles as a high performance, low cost, highly flexible supercapacitor device.
Export citation and abstract BibTeX RIS
1. Introduction
With the introduction of flexible wearable electronics devices such as smartwatches, medical sensors, curved smartphones, and smart textiles, there is an immediate need for flexible components such as active matrix organic light-emitting diode (AMOLED) digital displays, printed circuit boards (PCBs), and lightweight energy sources. Novel materials for these applications have been studied intensively in the past decade [1–7]. With the demanding energy consumption from these wearable devices, energy sources with increasing power and energy densities are continuously being developed. Supercapacitors or electrochemical capacitors (ECs) represent a new class of energy storage devices capable of delivering high power and energy density simultaneously [8–11]. The high power rating of ECs at around 10 kW kg–1 makes this type of energy storage device attractive for fast charging of personal electronics [1, 12]. Concurrently, researchers have been looking for new ways to reduce production cost, enhance the cycling performance while preserving the flexibility and light weight of EC cells [6, 7, 13–15].
The charge storage mechanisms of electrochemical capacitor are mainly double layer capacitance (EDLC) and pseudocapacitance [11]. Recent progress made on EDLC materials focuses on high-surface-area carbon based materials such as graphene, graphene oxide, and multi-walled carbon nanotubes (MWCNT), which utilizes charge separation in the Helmholtz layer formed at the electrode/electrolyte interface to store energy [6, 13–17]. However, due to the low specific capacitance obtained from these carbon materials, EDLC type materials are typically integrated with pseudocapacitive materials that employ fast faradaic interactions to store charge. The objective of many studies has been to obtain a composite hybrid that takes advantage of both charge storage mechanisms to yield an optimal storage regime [18–22]. Pure EDLC systems offer far superior cycling performance, with typically less than 5% capacitance drop after more than 5000 charging and discharging cycles [8, 12, 13, 15, 23, 24], while pseudocapacitive materials, such as metal oxides and conductive polymers, boost the energy and power density of the overall supercapacitor devices. However, the main limitations for these powder composite electrodes were their lack of flexibility and the need for binder materials.
Many advances in flexible ECs have been made through various fabrication methods with the deposition of active materials on flexible substrates, such as paper, polymers, etc, in order to obtain complete functionality while maintaining its structural flexibility [7, 12, 18, 23, 25]. Current studies began investigating the possibilities of attaching charge storage materials onto flexible porous surfaces that allows the electrolytic ions to be efficiently transported onto the electrode surface [26]. Many have suggested the optimal pore sizes to be within the range of 2 nm to 50 nm or mesopores that maximize the ion-accessible surface areas, without hindering the transport phenomenon [24, 27–29]. Proper pore selection offers the key to achieving ideal specific capacitance and rate capability for hybrid ECs. Many surface modification techniques were employed to create higher specific surface area for increased electrolyte/electrode interactions [1]. However, adhesion properties and issues with wear and tear in the case of paper-based electrodes remain some of the biggest challenges for flexible implementations.
Polyethylene terephthalate (PET) thermoplastic resin is used extensively for various applications. Every year, around 43 billion PET bottles have been sold in the United States alone, but only 30% of these are recycled for future use. The wasted PET resin can cause severe damage to the environment due to its slow degradation regime. If it was possible to recycle the PET thermoplastic resin from bottles for energy storage purposes, it would open up entirely new possibilities for the disposal of such plastic wastes.
Herein, we examine a novel fabrication route, using recycled PET based water bottles, to create a porous core–shell fiber structure for high performance EC construction. The structural backbone is an electrospun nanofibrous PET network with an average diameter of 121 nm ± 39 nm. The active material is a 69 nm pseudocapacitive conductive polymer polyaniline (PAni) shell layer well attached to the surface of core PET fibers. Electrospinning technique has been employed previously in constructing polymer nanofibers in the diameter range of 50 to 200 nm for various mechanical and electrical property enhancements. However, the core–shell structure formation of recycled PET with an active layer of PAni coating (PAni@PET) has not yet been reported for the energy storage applications. The specific capacitance for the PAni@PET flexible fibrous binder-free electrodes measured 10 mV s−1 showed 347 F g−1, indicating a dramatic increase from pure PAni electrodes with carbon binder. Some of the key improvements over previously reported flexible electrodes are the ideal cycling capabilities, extremely flexible characteristics, low charge transfer resistance, good adhesion, high specific surface area, and high hydrophilicity.
2. Materials and methods
2.1. Materials
The PET resin for the construction of the PET nanofiber substrate was obtained from the recycled water or other beverage bottles with identification of PETE1 recyclable logos. The solvents, namely trifluoroacetic acid (TFA, ReagentPlus, 99%) and dichloromethane (DCM, anhydrous, ≥99.8%) utilized in the electrospinning process were purchased from Sigma Aldrich and used without further modification. The aniline monomer (ACS reagent, ≥99.5%) was obtained from Sigma Aldrich, and underwent distillation to obtain a golden transparent color before use. Hydrochloric acid (HCl) and ammonium persulfate used in the chemical polymerization of PAni were used without further modifications.
2.2. Fabrication
As shown in figures 1 and S1 pictures, the raw PET resin was obtained from various recycled beverage bottles by cutting them into small, thin strips. The PET strips thus obtained were dissolved in a solvent mixture of 1:1 molar ratio TFA:DCM, as commonly used for electrospinning PET. The amount of PET resin dissolved was controlled at 10 wt. %. The solution was then transferred to a sealed glass bottle and magnetically stirred before the electrospinning process. The electrospinning process was carried out using a conventional electrospinning chamber with controlled temperature and relative humidity (R.H.). The chamber was first conditioned to a temperature around 30 °C, with R.H. below 10%. A syringe was filled with the electrospinning solution, then secured onto the syringe pump (New Era Pump Systems, NE 300). The collector was a grade 304 stainless steel sheet. A high voltage DC source was connected to the metallic syringe tip, whilst the fiber collector was grounded. The source DC voltage used for the process was 15 kV, and the distance between the high voltage needle tip and the fiber collector was set to 10 cm. The pumping rate was set to 0.04 ml h−1 and the entire process continued for 30 min to obtain a thin flexible white film. The film was then detached from the collector and placed within the vacuum oven at 60 °C for 12 h.
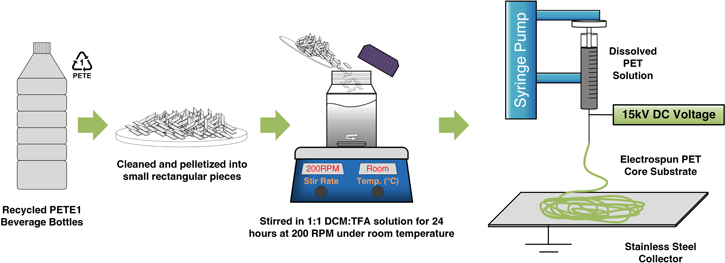
Figure 1. Fabrication process of the nano-sized PET polymer core fibers from the recycled PETE1 recyclable beverage bottles.
Download figure:
Standard image High-resolution imageAs shown in figure 2, the formation of PAni was carried out via an in situ chemical polymerization process. The oxidant used was ammonium persulfate (APS), and the acidic environment required for protonation was created with 1 M HCl. Upon doping with an acid, PAni emeraldine base can be converted to emeraldine salt, which is electrically conductive and suitable for charge storage applications [30]. A solution with 4 mmol of APS and 20 mL HCl (1 M) was made and the previously obtained PET core nanofiber was placed in the solution. The PET nanofiber core was hydrophobic at first when placed in the solution, and therefore needs to be stirred vigorously for 4 h and ultrasonicated for 10 min before the entire film is submerged under the solution surface. The ultrasonication process was able to increase the surface energy of the PET nanofibers, and is therefore seen to be very important in obtaining uniform core–shell structures throughout the film surface. Another solution with 4 mmol of aniline monomer and 20 mL of distilled water was made and stirred thoroughly to form a white opaque solution. The solution containing aniline was then added dropwise into the oxidant/acid solution. The mixture was then placed in an ice bath at 0 °C for 4 h to allow for polymerization, which can be characterized by a significant color change [31]. After the polymerization process, the PAni@PET film was washed thoroughly with distilled water and ethanol to remove excess monomers and oligomers. The washed PAni@PET fiber was then dried overnight in an oven at 50 °C.
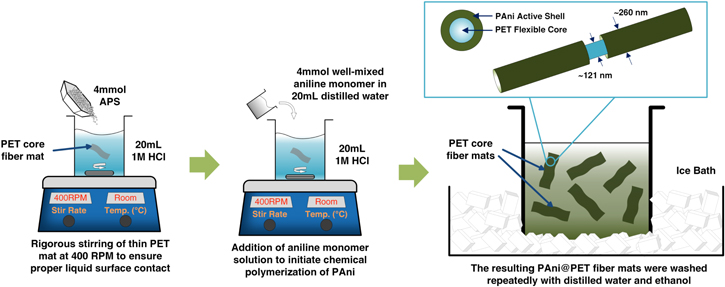
Figure 2. The thorough stirring process allowed the surface to become somewhat hydrophilic, so that the fiber mat sank in the solution. Polymerization process took place at the liquid-solid interface and allowed better adhesion between the PAni shell and the PET core; after 4 h of polymerization, a PAni@PET core–shell structure was formed.
Download figure:
Standard image High-resolution image2.3. Characterization
Electrochemical characterization was performed using a Solartron 1470E multi-channel potentiostat, with a 2-electrode symmetrical cell setup with 1 cm2 pieces of PAni@PET nanofibers serving as the electrodes, an aqueous 1 M sulfuric acid (H2SO4) as the electrolyte and thin (0.05 mm) flexible stainless steel sheets as the current collector. CV measurements were performed at varying scan rates, ranging from 5 mV s−1 to 2000 mV s−1, with a voltage window from −0.2 V to 1.0 V, which was selected with respect to the optimum operating condition for PAni-based electrodes. Electrochemical impedance spectroscopy (EIS) was performed from a high frequency of 105 Hz to a low frequency of 0.02 Hz. A galvanostatic charge discharge (GCD) test was performed at a current density of 12 A g−1 and 1.2 A g−1, with the voltage cycling between 0 V and 1.0 V. The specific capacitance was calculated based on the weight of the entire PAni@PET fiber electrode using equation (1). The electrochemical measurements were averaged over five sets of samples and the repeatability has been verified.

Where  is the scan rate in (V s–1);
  is the mass of the active material in (g);
  is the potential window in (V) (Vi to Vf),
  is the current measured in (A), and
  is the voltage applied in (V).
The morphology of the electrode surface structures was analyzed using a Hitachi S-5200 field emission scanning electron microscope (SEM). The core–shell structure was further verified with Hitachi H-7000 transmission electron microscope (TEM). The water contact angle test was carried out with standard sessile drop technique with drops of 20 uL of deionized water on the surface, measured at 25 °C. Brunauer–Emmett–Teller (BET) specific surface area analysis was performed by Quantachrome Instruments Nova 1200e, with CO2 as the adsorbate gas and a degassing temperature of 200 °C. Fourier transform infrared spectroscopy (FTIR) was performed with a Bruker ALPHA FT-IR Spectrometer, averaged over 25 scans. Thermal gravimetric analysis (TGA) was carried out with TA Instrument Model Q50 at a temperature scan rate of 20 °C min–1, from 20 °C to 900 °C, in order to verify the composition of the PAni@PET fiber structures. Roughness and surface characteristics were measured via the usage of an atomic force microscope (AFM), namely a Bruker MultiMode 8 with PeakForce tapping mode.
3. Results and discussion
3.1. Morphology and physical behavior
The PET nanofibers were obtained via conventional electrospinning technique, without the aid of rotating collectors for alignment. Alignment of the fibers would disrupt the proper size distribution of the pores that allows the electrolytic ions to travel freely for interfacial charge storage interactions with the electrode. Previous studies noted that mesoporous structures with pore diameters in the range of 2 nm to 50 nm are the most appropriate for supercapacitor electrode applications [10]. However, it was found in our study that a blend of macro-, micro-, and meso-porous structures allowed for more efficient charge transfer at the electrode/electrolyte interface, hence better performance at fast scanning rates, even up to 500 mV s−1. This distribution of various types of pores gave rise to more accessible surface area, and therefore, it was deduced that randomly distributed fiber structures can sufficiently meet the objectives of maximizing accessible surface areas for electrolytic ions. Via the conventional electrospinning technique, PET core fibers with a diameter of 121 nm ± 39 nm were produced. The overlapping or crisscross nature of the PET fibers in the mat depth allowed for formation of high-surface-area 3D structures that effectively increased the available surface for ion access, without hindering the ion transport, as the mix of macro-, micro-, and meso- pores allowed for highly efficient transport routes to form.
As shown in table 1, the PET electrospun core mat thickness is a function of time and therefore, the time allowed for electrospinning process was carefully controlled to obtain film with ideal thickness and flexibility. The observed density was very consistent at around 0.71 g cm−3, and the porosity was calculated to be around 50%. The availability of porous structures allows the efficient insertion of oxidant, acid, and the monomer for the in situ polymerization to take place. The tradeoff here is that the formation of thicker films can increase the three-dimensional surface area, allowing higher per-area capacitance values, but the material flexibility can be jeopardized. Also, as was observed, thicker PET substrates can impede the in situ chemical polymerization process, causing uneven PAni attachment, while hardening the film, making it unsuitable for potential flexible applications.
Table 1. PET film physical characteristics with respect to deposition time.
| Deposition time (minutes) | Thickness (μm) | Area-specific weight (mg cm−2) | Observed density (g cm−3) | Porosity (%) |
|---|---|---|---|---|
| 10 | 7 | 0.5 | 0.714 | 48.24% |
| 30 | 16 | 1.2 | 0.750 | 45.65% |
| 60 | 33 | 2.3 | 0.697 | 49.49% |
| 90 | 55 | 4 | 0.727 | 47.30% |
As shown in figure 3(a), by only using a flat, solid, PET film as the substrate, the aniline monomer was unable to reach the surface pores of the PET material and can only form large PAni agglomerates not well-adhered on the PET surface, indicating a weak interaction between PAni and PET. The PET solid flat film was formed via a solvent casting technique with the same recycled PET resin and treatment as for the PET core fibers. Figures 3(b) and (c) showed the morphology of electrospun pure PET nanofiber core. BET surface area analysis with CO2 adsorbate gas showed a specific surface area of 73.12 m2 g−1 for the pure PET electrospun fibers. The increased surface area was created via the interlacing fibrous three-dimensional structure and the interconnected nature throughout the depth fiber membrane. This non-woven textile structure offered ideal pore sizes from the crisscross patterns formed by the randomly distributed fibers, which allowed the oxidant and aniline monomer solutions to polymerize at the liquid−solid interface, which led to the appropriate PAni@PET core–shell formation. The electrospinning parameters were tuned in order to avoid the formation of beads and other non-uniformities. Figures 3(d) and (e) showed the very evenly distributed layer of PAni shell formed via the in situ chemical polymerization method as described.

Figure 3. (a) SEM morphology of pure PAni formed from in situ chemical polymerization process with PET solid film as substrate. (b) and (c) Morphology of the pure PET fibrous core: the electrospun PET fibrous structure was from the recycled PET bottles, these fibers have an average diameter of 121 nm ± 39 nm, and observed to have a smooth surface. (d) and (e) PAni@PET core–shell structure: after the PAni coating has been applied, it is evident that an even layer of PAni shell has been adhered on the PET surface. (f) At high magnifications, some exposed fiber core shows the internal core–shell structure as predicted during fabrication.
Download figure:
Standard image High-resolution imageAs shown in figure 4(a), the average diameter of these fibers is measured to be 121 nm ± 39 nm, with fiber diameters ranging from 24.2 nm to 301.5 nm. The average thickness of the PAni shell layer was measured to be 69 nm ± 22 nm and gives an overall core–shell structure thickness of around 260 nm, which was also presented in figure 4(a)). Via the thermogravimetric analysis (TGA) measurements, shown in S2, the PAni shell accounted for 22.7% of the overall mass of the core–shell structure. Figures 4(b) and (c) also showed the sample and the SEM image of the pure PET electrospun mat. The low weight and high flexibility were some of the desired features of the substrate material. After the core–shell structure formation, as demonstrated by the bending tests and SEM images shown in figure 4(d) as well as figures S3 and S4, the PET backbone continues to provide flexible structural support and good surface adhesion properties for the active conductive polymer layer to better interact with the electrolytic ions. Figure 4(e) showed the uniformity and the complete coverage of the coating layer on the PET fiber substrate in the PAni@PET core–shell composite. The specific surface area increased slightly to 83.72 m2 g−1 from the pure PET fiber, indicating formation of additional micro-porous structures of less than 2 nm in diameters on the PAni shell surfaces.
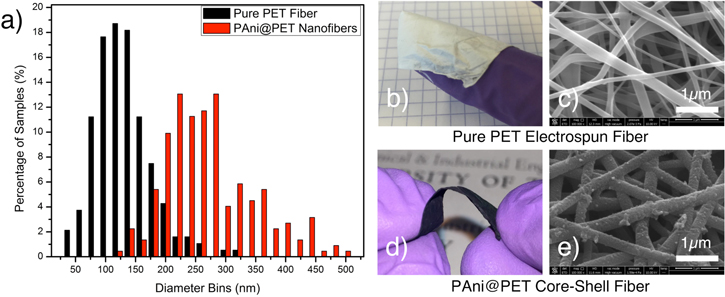
Figure 4. (a) Fiber sample diameter distribution with varying diameter bins; (b) sample of the flexible thin pure PET fiber mat; (c) SEM image of the pure PET electrospun fiber; (d) the flexible PAni@PET core–shell fiber shown under bending; (e) SEM image of the PET fiber coated with an average of 69 nm of PAni active shell layer.
Download figure:
Standard image High-resolution imageAdditionally, TEM was used to further verify the core–shell structure formation of the PAni@PET fiber. As shown in figure 5, core–shell fibrous structures of PAni@PET samples with varying dimensions were scanned and the core–shell formation was clearly shown.
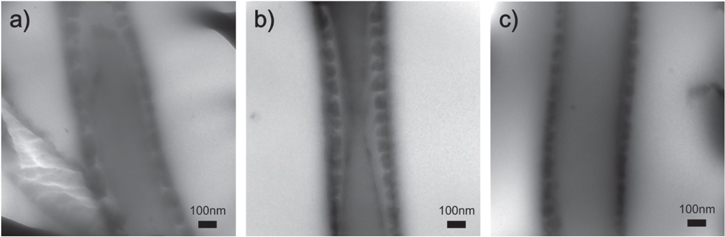
Figure 5. TEM images demonstrating the core–shell fiber structure formation of the PAni@PET composite with varying diameters.
Download figure:
Standard image High-resolution imageFourier transform infrared spectroscopy (FTIR) was performed on both the pure PET electrospun film, as well as the PAni@PET core–shell fiber structures, as shown in figure S5 and table S1. The results clearly indicated the difference in the IR spectra between the pure PET fibers and the PAni@PET fibers, with the additional characteristic peaks of PAni shown in the PAni@PET fiber composite materials, confirming the composition. The flat surface of the flexible electrode was also ensured in fabricating the electrodes. The PAni@PET composite fiber mat was firmly adhered onto the stainless current collector using carbon paste. As shown in the figure S6, the roughness factor Ra of the surface was measured using AFM technique to be 37.7 nm, similar to that for pure PET fibers at 30.5 nm.
3.2. Surface energy
One of the key features of the PAni@PET core–shell fiber structure is its high surface energy. The high surface energy allows better ionic interaction with the typical aqueous electrolyte used for electrochemical capacitors. The pure PET fiber was shown to have a water contact angle of 131.66°, while the PAni@PET core–shell structure measured a water contact angle of 8.36°, as shown in figures 6(a) and (b). It has been reported previously that flat solid pure PET surface has a water contact angle of 72.4°, indicative of partial wetting. With the electrospinning treatment, it was found that the modified PET surface led to a significantly decreased surface energy, indicated by the increase in water contact angle. The decreased surface energy can be attributed to the formation of overlaying nanofibers, which affected the surface interfacial interactions. After the formation of the PAni shell layers on the PET nanofiber surface, the almost complete wetting indicated that the PAni shell was wrapped uniformly throughout the PET electrospun nanofiber surfaces. This can be readily indicated by the hydrophilicity of the PAni@PET fibrous core–shell structure in comparison to the hydrophobic pure PET nanofiber.
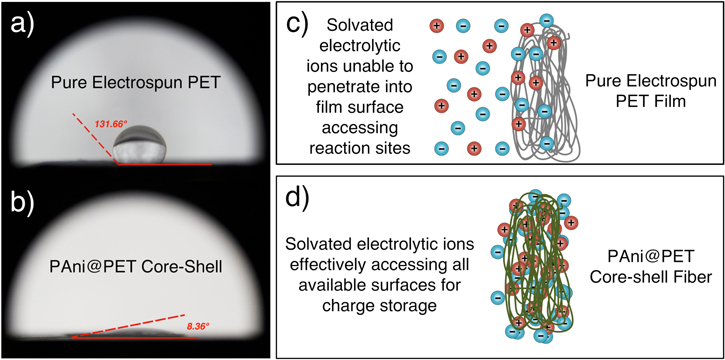
Figure 6. (a) and (b) Water contact angle measurements for the pure electrospun PET and the PAni@PET core–shell fiber structures. It was evident that the PAni@PET core–shell structure has a much better wetting, indicating a higher surface energy. (c) and (d) Schematics showing the difference in terms of ion accessibilities in relation to the wetting parameters of the fiber surfaces, with pure electrospun PET film, the aqueous electrolytic ions were not readily able to access all surfaces.
Download figure:
Standard image High-resolution imageAs demonstrated with the schematics in figures 6(c) and (d), the high surface energy allowed the aqueous electrolyte system to readily penetrate into the available electrode surfaces, which led to better charge storage behaviors and lower charge transfer resistance.
3.3. Electrochemical
The viability of the PAni@PET core–shell nanofiber structure to be employed in energy storage system has been examined using a two-electrode symmetrical electrochemical cell setup, which was selected to present a better estimation of the actual capacitance offered by the electrode. The specific capacitance calculations from the three-electrode setup quadruples the values shown here and may overestimate the EC performance in some cases. The CV scan rates were varied between 5 mV s−1 to 2000 mV s−1, and the results are shown in figures 7(a) and (b). It was observed that even at very high scanning rates at 2000 mV s−1, the PAni@PET nanofibers still experienced capacitor behaviors indicating that the electrode three-dimensional matrix allowed electrolytic ions to travel freely through the thickness of the electrode material and interact with the PAni shell effectively.
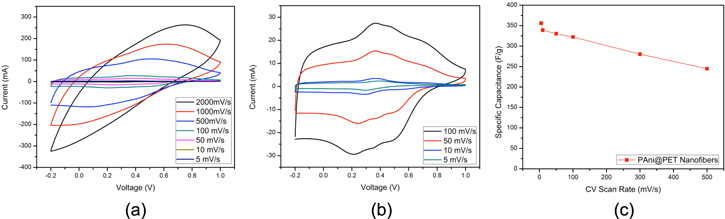
Figure 7. (a) CV scans with variation of scan rates from 5 mV s−1 to 2000 mV s−1. (b) CV graphs with scan rates varied between 5 mV s−1 to 100 mV s−1. (c) Calculated specific capacitance with varying scan rates.
Download figure:
Standard image High-resolution imageWhen examining the range of CV curves with slower scan rates from 5 mV s−1 to 100 mV s−1, the REDOX peaks were apparent with the current peaks in the charge/discharge processes. The different peaks at specific voltages in the CV diagrams can be attributed to the various oxidation states of PAni. The uniformity of the CV curve shapes indicated that by varying the scan rates between 5 mV s−1 and 100 mV s−1, the charge transfer process taking place at the porous electrode surface was not greatly affected. The specific capacitance at 10 mV s−1 as calculated from equation (1) was 347 F g−1, which presented a dramatic increase from the pristine PAni powder electrodes with carbon binders. The efficient contact between the electrode and the electrolytic ions was also demonstrated by the relatively small decrease in specific capacitance values as the scan rates were increased, as shown in figure 7(c). Even at a very high scan rate of 500 mV s−1 for conductive polymers, the PAni@PET nanofiber electrode still retained a specific capacitance of 244.9 F g−1, which still represented a relatively high capacitance for electrolytic capacitors. This observation can be attributed to the optimally sized porous structures that allowed high surfaces of the active PAni shell layer to be utilized for charge storage without hindering ion transfer.
As show in figure 8(a), the specific capacitance of binder-free PAni@PET nanofibers measured at 10 mV s−1 showed a significant increase in comparison to pristine PAni powder electrodes with carbon ink binders. From the charge-discharge curves, it is also evident that not only the specific capacitance increased with the core–shell PAni@PET structures, the IR drop was also much less. The observed IR drop in PAni@PET electrodes has been significantly reduced, which can be attributed to the internal resistance of the PAni@PET structure and the contact resistance from the electrolyte/electrode interface. The carbon binder clearly introduced higher internal resistance at the electrode/current collector interface and the higher thickness of the pristine PAni electrodes also contributed to the higher IR drops. The discharging time for PAni@PET nanofiber in a typical discharge cycle was 147.4 s, which showed a higher energy density in comparison to previously reported values. With a 1.2 V applied voltage window, it can be calculated that PAni@PET nanofiber electrodes offered an energy density of 69.4 W h kg−1, which is comparable to a typical NiCad battery. Researchers have reported that by utilizing PAni with other substrates, such as reduced graphene oxide and self-supporting graphene sheets, the energy density was reported at 25 W h kg−1 and 46 W h kg−1 respectively [18, 32]. From the galvanostatic 4-cycle test, it was observed that the symmetrical shape of the charge/discharge cycles was also very consistent.

Figure 8. (a) The CV scans at 10 mV s−1 comparing between pristine PAni electrodes and the PAni@PET core–shell nanofibers, it is evident that the capacitance was increased dramatically from the pristine PAni powder electrode with carbon binders. (b) The charge–discharge curves comparing between pristine PAni and PAni@PET nanofibers. (c) The presentation of 4 cycles of charge/discharge at 1.2 A g−1 current.
Download figure:
Standard image High-resolution imageFigure 9(a) shows the complex plane Nyquist plot of the impedance of the PAni@PET nanofibers. The curve intercepts the real axis at around a 45° angle indicating an efficient porous electrode behavior. The ESR was estimated at 1 kHz to be around 223 mΩ, which demonstrates a very low contact resistance at the electrode/electrolyte interface. The series resistance of around 1.0 Ω was from the aqueous 1 M H2SO4 electrolyte system. The almost vertical slope of the Nyquist plot showed ideal capacitor behaviors as the frequency decreased, which verified the hypothesis that the porous structures created with the electrospinning process aided the charge storage efficiency.

Figure 9. (a) Electrochemical impedance spectroscopy (EIS) Nyquist plot for the PAni@PET nanofiber structure with measurements from 100 kHz to 0.5 Hz shown. (b) Bode plot of the impedance magnitude. (c) Bode plot of the impedance angles.
Download figure:
Standard image High-resolution imageOne of the key benefits delivered by the PAni@PET nanofibers is the cycling capacity. From figure 10(a), it is clearly shown that the CV measurements taken at the 1st and 1500th cycles are similar in both shape and magnitude. Figure 10(b) shows the galvanostatic charge–discharge behavior comparison between the PAni@PET nanofiber behavior at 1st cycle and 1500th cycle. By the 1500th charging cycle, the capacitance had degraded only from 347 F g−1 to 331.9 F g−1, which represents only a 4.4% decrease in charge storage capacities, a significant improvement over the previously studied PAni-based electrode systems. And the discharging time intervals only decreased from 147.4 s to 142.8 s, which is also an insignificant drop in capacitance. Therefore, it can be concluded that the PAni active surface was well attached on the PET substrate surface, and suffered almost no apparent loss of capacitance after 1500 cycles, which is already a high cycle number for conductive polymer based pseudocapacitor devices.
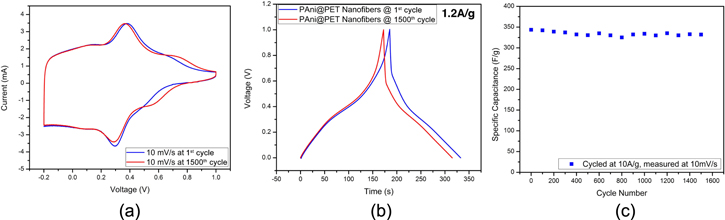
Figure 10. (a) Cycling behavior displayed with the comparison of CV curves at 1st cycle and 1500th cycle. (b) Comparison of the charge/discharge cycles at at 1st cycle and 1500th cycle. (c) The specific capacitance measured at various cycle numbers.
Download figure:
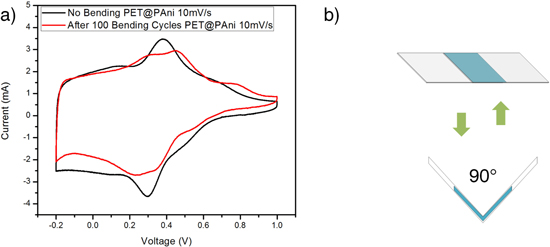
Standard image High-resolution imageAfter the cycling performance of PAni@PET fiber electrodes was evaluated, it was noted that the bending performance for this type of flexible electrode is also extremely important. Bending tests were carried out with constructed cells as discussed. Bending was applied to a 90° angle and for 100 cycles, with CV tests carried out before and after the test, as demonstrated in figure 11. From the CV results shown, it was demonstrated that the charge retention capability was not greatly affected after 100 bending cycles. The specific capacitance was 89.6% of the original value measured without bending. The two-electrode cell showed good flexibility and very limited degradation in cell performance after 100 bending cycles. This demonstrated that the performance can be ensured even for very demanding applications where repetitive bending is required.
Figure 11. (a) CV curves of PAni@PET electrodes before and after 100 bending cycles. (b) Schematics of bending test.
Download figure:
Standard image High-resolution image
4. Conclusions
A novel core–shell PAni@PET nanofibrous structure has been successfully fabricated with recycled PETE1 type recyclable beverage bottles. The weak mechanical properties of PAni have been readily compensated with the PET flexible structural support, with good adhesion. From the morphology analysis, the PAni@PET nanofiber has a PET core with 121 nm ± 39 nm in average diameter, while the PAni shell layer has an average thickness of 69 nm. The dispersion property of PAni shell layer was examined with surface energy analysis to show that the PAni wrapping has been very uniform throughout the structure. The higher surface energy led to better ionic interactions between the PAni@PET nanofiber electrode and the electrolytic ions. The specific capacitance was found to be 347 F g−1 at a scan rate of 10 mV s−1, while even at a very high scan rate of 500 mV s−1, the capacitance only decreased to 244.9 F g−1, which represents a very good specific capacitance value for pseudocapacitive materials. The energy density was measured to be 69.4 W h kg−1, comparable to a typical NiCad battery system. EIS showed that the charge transfer resistance was also minimal, along with a BET specific surface area measurement, leading to the conclusion that the blend of macro-, micro-, and meso-pores aided the charge transfer process, without hindering their interactions with the electrode. The galvanostatic cycling test showed that after 1500 cycles, the specific capacitance only dropped 4.4%. It was deduced that the formation of three-dimensional porous structures throughout the electrode contributed to the stability of the charge storage capabilities and the high energy density offered by the symmetrical two-electrode device. The bending tests showed that even after continuous bending for 100 cycles, the specific capacitance remained at a promising 89.6% of the original value before bending. This demonstrated that the flexible PAni@PET flexible fiber electrode can be applicable even for very mechanically demanding energy storage applications.
Acknowledgments
The authors would like to acknowledge Natural Sciences and Engineering Research Council of Canada (NSERC) (Grant# 459389), Canada Foundation for Innovation (CFI) (Grant# 481796), and Canada Research Chairs program (CRC) (Grant# 480255) for the financial support they have provided for this research work. Additionally, the authors would like to thank Ilya Gourevich, Nazanin Khalili, and Yu-Chen Sun for their support in obtaining the TEM images.