

Abstract
As nanomaterials become an increasing part of everyday consumer products, it is imperative to monitor their potential release during production, use and disposal, and to assess their impact on the health of humans and the ecosystem. This necessitates research to better understand how the properties of engineered nanomaterials (ENMs) lead to their accumulation and redistribution in the environment, and to assess whether they could become novel pollutants or if they can affect the mobility and bioavailability of other toxins. This study focuses on understanding the influence of nanostructured-TiO2 and the interaction of multi-walled carbon nanotubes with organic pollutants in water. We studied the adsorption and water phase dispersion of model pollutants with relatively small water solubility (i.e., two- and three-ring polyaromatic hydrocarbons and insecticides) with respect to ENMs. The sorption of pollutants was measured based on water phase analysis, and by separating suspended particles from the water phase and analyzing dried samples using integrated thermal–chromatographic–mass spectroscopic (TGA/GC/MS) techniques. Solid phase analysis using a combination of TGA/GC/MS is a novel technique that can provide real-time quantitative analysis and which helps to understand the interaction of hydrophobic organic pollutants and ENMs. The adsorption of these contaminants to nanomaterials increased the concentration of the contaminants in the aqueous phase as compared to the 'real' partitioning due to the octanol–water partitioning. The study showed that ENMs can significantly influence the adsorption and dispersion of hydrophobic/low water soluble contaminants. The type of ENM, the exposure to light, and the water pH have a significant influence on the partitioning of pollutants.
Export citation and abstract BibTeX RIS
1. Introduction
The use of nanomaterials and nanoparticles has experienced rapid growth over the last two decades. There are more than a thousand products claiming to contain nanoparticles in biomedical, chemical, clothing, cosmetics, electronics, energy, environmental, food, materials and optical products [1–3]. The properties of nano-scale structures and particles differ fundamentally from those of the macro material regarding chemical reactivity and electrical conductivity [1, 4]. The effects of engineered nanomaterials (ENMs) on environmental processes and human health are strongly related to the large surface-to-mass ratio and the chemical and surface properties of nanoparticles. The increasing use of ENMs means that the risk of intentional and unintentional release of nanoparticles into the environment during their life cycle, and the potential for exposure has become high [5, 6]. ENMs can reach humans and ecosystems through direct application, accidental release, contaminated soil, leachates from nanomaterials, or atmospheric fallout [6].
Natural colloids are generated from various sources, including river-borne clay and resuspended sediments, airborne volcanic ash, forest-fire smoke and other aerosols [7, 8]. Although the influence of natural colloids on the environment is well documented, we have a limited understanding of the fate, transport, toxicity and pollutant interaction of engineered nanomaterials. The factors that are directly associated with the fate of an anthropogenic organic compound released into the environment include the prevailing environmental conditions at the point of discharge, the transport and transformation, the physicochemical properties of the compound, and the patterns of use, including the locus and timing of introduction [9]. The physicochemical properties relating to the environmental behavior of hydrophobic organic compounds are mainly affected by aqueous solubility (Sw) and the octanol–water partition coefficient (Kow) [10]. The Sw is the equilibrium distribution of a solute between the water and solute phases and is a significant parameter for determining the maximum concentration of compounds in different media that are at equilibrium [11]. The Kow is determined by the ratio of the concentration of a chemical in octanol and water at equilibrium. Octanol is a common organic solvent that is used as a surrogate for natural organic matter [12]. Kow is widely used in different environmental studies to investigate the fate of chemicals in the environment, and in particular for predicting the bioaccumulation of chemicals in aquatic species [13]. Since Kow correlates with the Sw of compounds, the Sw of a chemical can be used to determine its Kow. The presence of nanomaterials in the water phase affects the octanol–water partitioning of hydrophobic organic contaminants by creating a microenvironment within it. Therefore, it is of great importance to understand the interaction between water pollutants and nanoparticles in the environment. Reliable analytical techniques are critical for understanding the fate, transport and accumulation of ENMs—and their interaction with pollutants in the environment.
In the last two decades, there has been increasing interest in nanoparticles because of our ability to synthesize and manipulate such materials [5, 7]. Many nanoparticles, including both natural and engineered ones, can interact with pollutants and other compounds when suspended in natural water. The unique properties (i.e., high surface-area-to-volume ratio) and behaviors (e.g., high interface energy and high surface-to-charge ratio density) of nanoparticles mean that the fate and transport of water contaminants in the environment may be strongly affected by them [7, 14, 15]. In particular, for aquatic systems and species, the fate and bioavailability of pollutants are significantly affected by the partitioning and phase distribution of hydrophobic organic contaminants [16]. Many pollutants have shown that their partitioning to nanoparticles is inversely proportional to the log solubility of pollutants and the log concentration of nanoparticles, while it is proportional to Kow [17]. Nanoparticle–water partitioning will significantly affect the speciation of water contaminants, including persistent organic pollutants (POPs) such as polycyclic aromatic hydrocarbons (PAHs) and polychlorinated biphenyls [18]. Therefore, it is of great importance to study the partitioning behavior of contaminants to nanoparticles in the aquatic environment to understand the fate and transport of POPs, together with their toxicological impact.
The interaction of solid adsorbents such as ENMs with water pollutants is usually studied by extracting samples of water to obtain the pollutants adsorbed to the solid phase as an indirect quantification method [19–21]. Extraction requires large amounts of solvent and multiple work-up steps to separate and concentrate the target compounds from different diluted media. Therefore, there is a need for a relatively simple, novel and reliable method to quantify the adsorbed compounds on solid materials to verify the extraction method of the water phase. Zhan et al showed that metal contaminants such as Cd can adsorb to TiO2 significantly more than to natural sediment particles, hence greatly enhancing the accumulation of Cd in carp [22]. However, there is limited data on the adsorption of hydrophobic organic pollutants on ENMs, and their transport and bioaccumulation.
In this study, the adsorption of water pollutants, two PAHs and an insecticide with ENMs such as multi-walled carbon nanotubes (MWCNTs), carboxylic-functionalized MWCNTs (MWCNT-COOH) and titanium dioxide (TiO2) were investigated under different sets of conditions. To understand the interaction mechanism better, two PAHs (i.e., phenanthrene and naphthalene) and aldrin were selected as model nonpolar hydrophobic pollutants and a chlorinated insecticide with many functional groups, respectively. To quantify the quantity of PAHs and aldrin adsorbed on nanomaterials, gas chromatography/mass spectrometry (GC/MS) was used. The quantity of hydrophobic water pollutant adsorbed on nanomaterials was determined by calculation with the results of the GC/MS analysis. In particular, thermogravimetric analysis (TGA/GC/MS) was applied to quantify the PAHs adsorbed on ENM, directly from the solid phase as a direct quantification method. To the best of our knowledge, this is the first paper to use TGA/GC/MS to determine the PAHs adsorbed on nanomaterials directly as a solid phase analysis to study the interaction of PAHs and nanomaterials.
2. Experiment
2.1. Materials used and characterization of ENM
For this study, phenanthrene, naphthalene, dichloromethane (CH2Cl2), aldrin (C12H8Cl6) and TiO2 (Aeroxide® P25) were purchased from Sigma-Aldrich (USA). Sodium chloride (NaCl) was purchased from Fisher Scientific (USA). Pure MWCNTs and MWCNT-COOH were purchased from Sun Innovation Inc. (Fremont, California, USA). All the materials were used as received for all the experiments. The physical properties of the MWCNTS are listed in table 1 [23–25]. The purity of the ENMs and the concentration of the trace inorganics were discussed in our previous study [26, 27]. The physical properties of the pollutants selected for this study are listed in table 2. Laser doppler velocimetry in conjunction with phase analysis light scattering (Malvern Zetasizer Nano, Malvern Instruments Ltd) was used to measure the zeta potential of TiO2 and MWCNTs at selected pH values.
Table 1. The physical properties of the MWCNTs [23–25].
| Purity (%) | Inner diameter (nm) | Outer diameter (nm) | Length (μm) | Specific surface area (m2 g−1) | Density (g−1 cm3) | Content of functional group (wt%) | |
|---|---|---|---|---|---|---|---|
| MWCNT | 95 | 5–10 | 10–20 | 10–30 | >200 | ∼2.1 | — |
| MWCNT-COOH | 95 | 5–10 | 10–20 | 10–30 | >200 | ∼2.1 | 2 |
| TiO2 | 100 | — | 21 (primary particle size) | — | 35–65 | 4.26 at 25 °C | — |
Table 2. Properties of organics pollutants tested.
| Compound | Chemical structure | Mole weight (g mol−1) | Boiling point (°C) | Water solubility (mg l−1) | Log Kow |
|---|---|---|---|---|---|
| Naphthalene |

|
128 | 218 | 31.7 | 3.5 |
| Phenanthrene |

|
178 | 340 | 1.29 | 4.45 |
| Aldrin |

|
364 | 145 | 0.003 | 6.5 |
2.2. Adsorption experiments for octanol–water partitioning of pollutants
Stock solutions of phenanthrene and aldrin were prepared in octanol with concentrations ranging from 0.1 to 10.0 g l−1. A naphthalene standard solution of 10 mg l−1 was prepared in CH2Cl2. Each PAH solution of 0–20 mg l−1 was prepared with 50 ml octanol and then added to 900 ml DI water that contained 0–20 mg l−1 of each nanomaterial in a 2 l flask. A measured amount of 1 M NaCl solution was added to the flask according to each experimental condition. A known weight of ENMs was placed in a 125 ml umber glass vial with a measured concentration of PAH in distilled water. The solution pH was adjusted using either 1 M NaOH or HCl to the preset pH. A minimum of headspace was left to avoid PAH losses in the vapor phase. The flasks were then sealed with a rubber cock, placed on a stir plate and kept under gentle stirring (i.e., the vortex was less than 1 cm) for five days to reach equilibrium. A glass tube was inserted through the rubber cock to take out samples in the water layer without disturbing the octanol layer. To avoid chemical or photodegradation, the tests were conducted under anaerobic conditions in the absence of light by wrapping the vials with aluminum foil. Samples (30 ml) were taken from the water layer using a 60 ml plastic syringe 3 h after stirring had stopped. Each compound of PAH in the samples was quantified by GC/MS (Agilent GC/MS 6890/5973) equipped with a split/splitless injector. The octanol phase was also analyzed by GC/MS. A Supel-Q™ PLOT Capillary GC Column (Supelco, 30 m × 0.32 mm, average thickness 15 μm) was used. The sample injection volume was 1 μl and the injector temperature was 300 °C. The oven temperature was initially held at 35 °C for 4 min and was then raised at 15 °C min−1 up to 185 °C, with a second heating rate at 10 °C min−1 up to 230 °C , and then a final heating rate at 25 °C min−1 up to 310 °C, where it was held for 2 min.
2.3. Sample preparation and analysis
The samples collected from the aqueous samples were centrifuged using a Sorvall Legend T+ centrifuge (Thermo Scientific), and this was followed by microfiltration. Sodium chloride was dissolved to form a concentration of 10 g l−1 in the filtrate to assist the extraction by increasing the ionic strength to promote the transfer of hydrophobic pollutants to the organic phase. The sample and 20 ml dimethyl chloride were added into a reparatory funnel, and samples were shaken for 10 min. The organic phase was decanted, and the extraction process was repeated with the same volume of dimethyl chloride before the GC/MS analysis. For the GC/MS analysis, the 30 ml aqueous sample was extracted with 30 ml of CH2Cl2 using a 125 ml separatory funnel. The mixture of the aqueous sample and CH2Cl2 was then taken and transferred to a 50 ml conical centrifuge tube. The tube was under nitrogen flow until all the extracted solutions were evaporated. After the evaporation, 2 ml of a mixture of 50:50 CH2Cl2 and acetone was added to the tube and used to rinse the wall of the tube well. The solution in the tube after rinsing was analyzed by GC/MS to quantify PAHs.
In addition, the PAHs adsorbed on the nanomaterials were determined with TGA (PerkinElmer Pyrus 7) combined with evolved analysis using an integrated GC/MS system (PerkinElmer Clarus 600) (TGA/GC/MS). For the analysis, nanomaterials were collected by filtration using a glass fiber filter (Whatman Glass Microfibre Filter, GE Healthcare Life Sciences, Pittsburgh, Pennsylvania, USA) or centrifugation. The collected ENMs were dried in a conventional oven at 35 °C for 8 h. The mass fraction of the adsorbed PAHs on nanomaterials was analyzed using TGA (PerkinElmer Pyrus 7) under nitrogen flow.
2.4. Thermogravimetric analysis with evolved gas characterization
Thermal analysis provides an important insight into the thermodynamic and mechanical properties of materials heated under a controlled atmosphere and their interaction with probe molecules. Thermogravimetric analysis (TGA) is a thermal analysis method in which air-dried ENM samples are heated under a controlled aerobic or anaerobic environment, and the changes in the weight of the samples as a function of the temperature is recorded. This weight change data provide useful information about the physical and chemical properties of the samples. However, TGA cannot identify what material is emitted at a specific temperature. The analysis of gases evolved during a TGA experiment by gas chromatography/mass spectrometry provides us with a means of identifying the compound or groups of compounds evolved during a specific weight-loss event. Hence, TGA integrated with gas chromatography and mass spectroscopy (TGA/GC/MS) improves our ability to understand a sample's physical properties and chemical composition. Coupling a TGA to a GC/MS allows us to detect, trap and isolate low levels of materials sorbed to ENMs from complex mixtures, and to identify their components. The nanomaterials filtered from the sample water of our batch adsorption tests are air dried. A measured mass of (∼10 mg) was put on a PerkinElmer's TGA (Pyrus 1) and the evolved gas containing PAHs was transferred through a heated transfer capillary tube that was kept under partial vacuum to the sampling loop (5 ml) integrated with a Clarus 600 GC/MS. The system was controlled by Turbo Mass software.
For GC-MS analysis, an Agilent DB-5ms capillary column (30 m × 0.250 mm, film thickness 0.25 um) was used. The oven temperature was initially held at 35 °C for 4 min and was then raised at 15 °C min−1 up to 185 °C, with a second heating rate at 10 °C min−1 up to 230 °C, and then a final heating rate at 25 °C min−1 up to 310 °C, where it was held for 2 min. The injection volume was 1 μl and the injector temperature was 300 °C. The EPC was run with the splitless mode, and the column flow rate of helium was 1 ml min−1. The average velocity in the column was 37 cm s−1 and for MS acquisition a secondary ion mass spectrometry (SIMS) was used. Measured masses of pure PAH were placed in a TGA pan for qualitative calibration of the TGA/GC/MS response as a function of evolved gas PAH concentration. To quantify the naphthalene in MWCNTs, an internal standard was used. Scheme

Scheme 1. An experimental flow for the interaction of PAHs and nanomaterials in water.
Download figure:
Standard image High-resolution image3. Results
3.1. Zeta potential of ENM
Figure 1 shows the zeta potential values (mV) as a function of pH in dispersions of pristine and acid-functionalized CNTs and TiO2. Pristine MWCNTs were positively charged from pH 3 to pH 8. Above pH 8, the surface of pure MWCNTs was negatively charged. The acid functional groups had a higher electron negativity of oxygen than neat CNTs and polarized for oxygen. The presence of the hydroxyl group helped to stabilize the COOH-CNT suspensions [28], increasing their dispersion in water, which can increase their ion exchange capacity [29]. Figure 1 shows that the points of zero charges (pHPZC) for pristine-CNT and COOH-CNT were 7.9 and 1.7, respectively. For MWCNT-COOH, the zeta potential reached a low plateau at a pH of 2.7, which can be explained by the fact that COOH-CNT is completely deprotonated above this pH [30–33]. These results are in good agreement with previous studies, which reported that the surface of MWCNTs is negatively charged after functionalization with acid or noncovalent treatments due to the formation of carboxyl functional groups [30–32]. The different zeta potential values of the CNTs are directly correlated with the ability of CNTs to stay in suspension and form stable colloidal solutions, and to facilitate the sorption mechanisms [34]. The increased quantity of oxygen groups present on the surface lattice of CNTs enhances the attraction between the oxygen functional groups and the water molecules, overcoming the CNTs' gravitational force and leading to the formation of stable suspensions [28]. Based on its colloidal stability, COOH-CNT is a better adsorbent than pristine-CNT. Pristine-CNT also has deprotonated groups, which result in decreased electronegativity at higher pHs. The attachment of hydroxyl ions onto the hydrophilic surface or residual oxygen groups during the synthesis process may also result in a negative zeta potential for untreated pristine-CNTs [33]. In the case of TiO2, the particles have negative zeta potential values above a pH of 6 and at alkaline conditions, and the pHPZC for commercial P25 TiO2 (a 25%:75% mixture of rutile and anatase) was found between 6.2, which is in good agreement with previous studies [35–37].
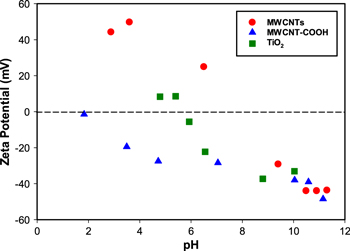
Figure 1. Zeta potential of MWCNTs, MWCNT-COOH and nano-TiO2 at selected pHs.
Download figure:
Standard image High-resolution image3.2. Thermogravimetric analysis
The TGA weight-loss profiles of neat naphthalene, the glass filter used to recover MWCNTs and the pristine and carboxyl-functionalized MWCNTs as a function of temperature are presented in figure 2. Since the boiling point of naphthalene is 218 °C, the total weight loss of pure naphthalene from the TGA pan occurred at around 230 °C. The glass filter used to separate the nanomaterials was very stable (no weight loss) within the temperature range for TGA analysis. The MWCNTs and MWCNT-COOH exhibited a small weight loss above 500 °C. The TGA profile of the naphthalene adsorbed MWCNT and MWCNT-COOH samples showed weight loss around 390 °C to 400 °C, following a similar trend to that demonstrated by the neat MWCNTs and MWCNT-COOH. Significant weight loss was observed around 470 °C and 620 °C for the naphthalene-adsorbed MWCNTs and MWCNT-COOH, respectively. The delay in the weight loss accounting for the release of naphthalene indicates the strong adsorbtion of naphthalene to the ENMs.

Figure 2. TGA for (a) the glass filter, (b) neat MWCNT-COOH, (c) neat MWCNTs, (d) neat naphthalene, (e) filtered MWCNT-COOH and (f) filtered MWCNTs.
Download figure:
Standard image High-resolution imageIn addition to the naphthalene adsorption on MWCNTs, the adsorption of phenanthrene to nanostructured-TiO2 was investigated. Figure 3 shows the TGA profile for dried or wet TiO2 before and after phenanthrene adsorption. As seen in figure 3, TiO2 had a high capacity for phenanthrene adsorption and released it during a thermal heating step. Since wet TiO2 contains water, its weight loss was larger than that of dried TiO2. After phenanthrene adsorption, both dried and wet TiO2 showed a similar trend to the TGA results for TiO2 before phenanthrene adsorption. The phenanthrene-adsorbed wet TiO2 sample lost more weight than the dried one. Interestingly, the TiO2 samples adsorbed more water and phenanthrene in the absence of light illumination. This might have resulted from TiO2 photocatalysis. Adsorbed phenanthrene on the surface of TiO2 starts to be decomposed by reactive oxygen species generated by TiO2 photocatalytic reaction. The formed reaction intermediates during TiO2 photocatalysis may interrupt phenanthrene adsorption due to competition between the phenanthrene and reaction intermediates on the surface of TiO2 to occupy active sites of TiO2. In addition, the surface chemistry of TiO2 might be changed by TiO2 photocatalysis in a way that lowers phenanthrene adsorption. Moreover, TiO2 becomes hydrophilic in the presence of light [38]. The lowered hydrophobicity of TiO2 reduced its interaction with the hydrophobic phenanthrene, resulting in decreased phenanthrene adsorption. Similar results were reported in a previous study where the adsorption of contaminants by TiO2 in the presence of UV light was lower than in the absence of light [39].

Figure 3. TGA analysis for neat TiO2 and phenanthrene-adsorbed TiO2. (A) Weight (%) of neat TiO2 and phenanthrene-adsorbed TiO2 at different temperatures ((a) neat TiO2 (dried), (b) neat TiO2 (wet), (c) phenanthrene-adsorbed TiO2 (dried) under fluorescent light, (d) phenanthrene-adsorbed TiO2 (wet) under fluorescent light, (e) phenanthrene-adsorbed TiO2 (dried) under dark conditions and (f) phenanthrene-adsorbed TiO2 (wet) under dark conditions) and (B) weight (%) and derivative weight (%) of phenanthrene-adsorbed TiO2 ((a) and (c) dried and (b) and (d) wet, respectively) under dark conditions.
Download figure:
Standard image High-resolution image3.3. Measuring pollutant adsorption based on liquid phase analysis
Based on the GC/MS analysis, the Kow of phenanthrene in the presence of TiO2 was calculated via equation (1):

where Co is the centration of phenanthrene in octanol and Cw is the concentration of phenanthrene in water. The calculated log Kow are listed in table 3. As seen in table 3, the values of Kow were proportional to the solution pHs, while Kow decreased with an increase in mixing times. More phenanthrene goes into the water phase with longer mixing times. Compared to the log Kow (4.46) of phenanthrene under normal conditions [40], in the presence of TiO2 the calculated log Kow became smaller, indicating that TiO2 helps phenanthrene to become more partitioned in water. Moreover, the Kow increased slightly at pH 3, but decreased at pH 10. It might be that the environmental conditions around TiO2 change due to the photocatalytic activity of TiO2 at different solution pHs.
Table 3. Values of log Kow for phenanthrene in the presence of TiO2 with an ionic strength of 1.0 mM NaCl.
| pH | ||||
|---|---|---|---|---|
| 3.0 | 10.0 | |||
| Light | ||||
| Mixing (day) | No | Yes | No | Yes |
| 3 | 1.53 | 1.62 | 2.41 | 2.02 |
| 6 | 0.84 | 1.25 | 2.29 | 1.28 |
| 7 | — | — | 2.20 | 1.28 |
In addition to phenanthrene adsorption on TiO2, adsorption of the hydrophobic insecticide aldrin on TiO2, pristine MWCNTs and MWCNT-COOH was studied by GC/MS analysis. Figure 4 shows the results for aldrin adsorption on TiO2 and MWCNTs, which were calculated via liquid phase analysis using GC/MS. As seen in figure 4, the adsorbed aldrin on all TiO2, pristine MWCNTs and MWCNT-COOH was proportional to the equilibrium concentration of aldrin in experimental systems. Interestingly, MWCNTs adsorbed a smaller amount of aldrin than TiO2, while MWCNT-COOH showed a higher adsorption of aldrin than TiO2 and pristine MWCNTs. This might have been caused by their different physicochemical properties (e.g., Brunauer, Emmett and Teller (BET) surface areas, sizes and surface charges).
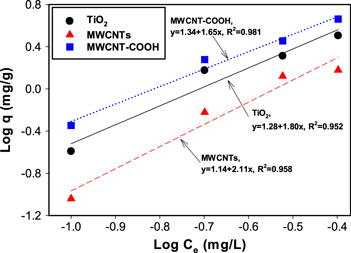
Figure 4. Adsorbed aldrin on nanomaterials (TiO2, MWCNTs, and MWCNT-COOH) calculated using the GC-MS analysis results.
Download figure:
Standard image High-resolution imageMoreover, the interaction of naphthalene and MWCNTs in water was studied. As seen in figure 5, the concentration of naphthalene in both the solid and liquid phases increased with an increase of the concentration of spiked naphthalene. This indicates that the MWCNTs adsorbed naphthalene effectively in addition to aiding naphthalene dissolution in water. The naphthalene concentrations for pristine MWCNTs in both phases increased linearly, but for MWCNT-COOH, it seemed that the adsorption reached equilibrium in the solid phase, even though more naphthalene dissolved in water. Based on the results of the GC/MS analysis, the nanoparticle–water partition coefficient (Kd) for MWCNTs at different concentrations of naphthalene was calculated using equation (2). The calculated coefficients are listed in table 4.

where Cp is the centration of naphthalene in MWCNTs and Cw is the concentration of naphthalene in water. At a higher concentration of naphthalene, log Kd decreased slightly for MWCNTs, indicating that more naphthalene went to the water phase. However, for MWCNT-COOH, the log Kd was smaller than that for bare MWCNT, showing less adsorption of naphthalene. This may have resulted from the different hydrophobicities of bare and functionalized MWCNT. Similar results were reported in previous studies, namely that adsorption of PAHs decreased significantly after the functionalization of MWCNTs [41–44].
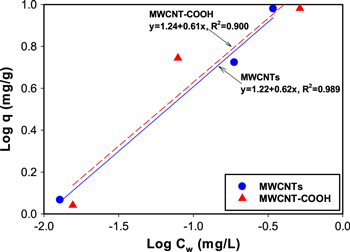
Figure 5. Log Cw (naphthalene in water phase) versus log q (naphthalene in solid phase) of naphthalene for different MWCNTs with different concentrations of spiked naphthalene in the system. Left: low concentration (0.1 mg l−1). Right: high concentration (1.0 mg l−1).
Download figure:
Standard image High-resolution imageTable 4. The values of log Kd (l/g) for MWCNTs at different concentrations of naphthalene calculated with the results of GC/MS analysis.
| Naphthalene concentration (mg l−1) | MWCNT | MWCNT-COOH |
|---|---|---|
| 0.1 | 91.24 | 70.60 |
| 0.5 | 28.17 | 70.40 |
| 1 | 27.88 | 18.55 |
In addition, the adsorption isotherm was determined using 48 h of equilibrium time. The experimental data for chlorinated pesticide, aldrin and naphthalene adsorption to TiO2, MWCNT and MWCNT-COOH were fit with the Freundlich isotherm ( , as shown in figures 4 and 5. The correlation coefficients vary from 0.95 to 0.98. For TiO2, pristine and COOH-functionalized MWCNT the constants KF for aldrin adsorption were 19.1, 13.8 and 21.9, respectively, and the n values were 0.56, 0.47 and 0.61, respectively. The average particle size of the Degussa P25 nanoparticles, 20 nm, is comparable with the OD of MWCNT (10–20 nm), affording a high surface area. Suspended TiO2 and MWCNT-COOH have a zeta potential of about −29 mV in the experimental conditions of pH = 7, which accounts for the higher electrostatic attraction of these pollutants compared with MWCNT.
3.4. Integrating TGA with GC/MS for evolved gas analysis of adsorbed pollutants
As the temperature of the nanomaterial sample obtained from the batch equilibrium study continued to increase, the evolved gas from TGA was transferred via a heated line and analyzed using GC/MS to determine the quantity of PAHs adsorbed on the nanomaterials for batch equilibrium study. Vapor phase samples were pulled to the GC/MS by a vacuum pump and trapped in the injection port. The MS response was calibrated by putting multiple masses of naphthalene on the TGA pan and assessing the MS responses. The data set obtained by TGA/GC/MS analysis is provided in figure S1 in the supporting information. Figure 6 shows the concentration of naphthalene in MWCNTs and MWCNT-COOH obtained by direct solid phase analysis with TGA/GC/MS and by calculation based on liquid phase analysis with GC/MS. As seen in figure 6, the results of TGA/GC/MS analysis for solid phase was compared to calculated amount of naphthalene in nanomaterials based on the GC/MS analysis for liquid phase analysis. The adsorption capacity, q, of both pristine and COOH-functionalized MWCNT for naphthalene was linearly proportional to the concentration of spiked naphthalene in a batch three-phase system, as shown in figures 6(a) and (b), respectively. The adsorption capacity estimates based on solid phase analysis using TGA/GC/MS were 6% to 19% higher than the measurements made using liquid samples. To investigate whether there is a significant difference between liquid phase analysis with GC/MS and solid phase analysis with TGA/GC/MS in quantifying the adsorbed amount of naphthalene, statistical analysis was conducted. Further investigation proved that there is no significant difference between the two analytical methods at 95% confidence. Moreover, the difference in the adsorption capacity between pristine and COOH-functionalized MWCNT for naphthalene adsorption was not significant (figures 6(c) and (d)).

Figure 6. Adsorbed naphthalene on different types of MWCNTs (q is adsorbed naphthalene on MWCNTs and C0 is initial concentration of naphthalene spiked in the reactor) (a) pure MWCNTs and (b) MWCNT-COOH; (c) calculated amount of naphthalene adsorbed on MWCNTs using the results of GC/MS analysis from the liquid phase; and (d) amount of naphthalene adsorbed on MWCNTs measured via a direct TGA/GC/MS analysis for the solid phase.
Download figure:
Standard image High-resolution image
4. Conclusion
In this study, the adsorption of hydrophobic organic pollutants onto ENM was studied using the reduction in the concentration of the liquid phase and the increase in the solid phase analysis. Most hydrophilic pollutants in water travel in solution. ENMs in aquatic environments can adsorb hydrophobic pollutants, and this can result in changes to the environmental risks of ENMs and the bioavailability of adsorbed contaminants.
The ability to integrate thermal instruments with other analytical devices to improve the quality and quantity of information from environmental samples has opened up new opportunities for analytical chemists. This study uses TGA, GC/MS and TGA/GC/MS to investigate hydrophobic organic compounds adsorbed to ENM. TGA/GC/MS analysis of nanomaterials recovered from environmental samples improved our ability to identify and quantify adsorbed pollutants on nanoparticles from aquatic media. The techniques have been shown to be promising for studying the partitioning of hydrophobic contaminants between nanomaterials and water, which is an important parameter for modeling the fate and transport of these contaminants in the aquatic environment. Adsorption of hydrophobic organic pollutants to nanomaterials increased the concentration of contaminants in the aqueous phase as compared to the 'real' partitioning due to the octanol–water partitioning. The effects of nanomaterials on the mobility of pollutants (i.e., naphthalene and phenanthrene with relatively low water solubility and differing mobility in the soil) was studied. A solid phase analysis using a combination of TGA/GC/MS was conducted to quantify the adsorbed contaminants on nanomaterials for the first time in the study of the interaction of nanomaterials and contaminants. This provided more reliable data than a liquid phase analysis using GC/MS. This implies that the TGA/GC/MS method is a promising technique for studying the interaction of nanomaterials and nonvolatile contaminants in the aquatic environment. The results of this study imply that hydrophobic organic pollutants adsorbed to engineered nanomaterials can exist in significant concentrations. The strong adsorption affinities of PAHs and aldrin are likely attributable to several mechanisms, including electrostatic attraction and surface complexation. The findings of this study have important implications for the risk assessment of ENMs. Future studies should use additional surface probing techniques, such as x-ray photoelectron spectroscopy, to better understand the sorption isotherms and adsorption mechanisms of organic pollutants with respect to ENMs.
Acknowledgments
This project was supported in part by an appointment to the Internship/Research Participation Program at the National Risk Management Research Laboratory, Office of Research and Development, US Environmental Protection Agency, administered by the Oak Ridge Institute for Science and Education through an interagency agreement between the US Department of Energy and US EPA. The authors thank Mr Yonggui Shan and Mr Tomas Mancuso for analytical assistance.
Disclaimer
The views expressed in this article are those of the authors and do not reflect the official policy or position of the Unites State Environmental Protection Agency. Mention of trade names, products, or services does not convey official EPA approval, endorsement, or recommendation. This manuscript has been subjected to the Agency's review and has been approved for publication.