
Abstract
Downsizing to the nanoscale has opened up a spectrum of new magnetic phenomena yet to be discovered. In this context, we investigate the magnetic properties of Ni clusters embedded in a metallic Ag matrix. Unlike in Ni free-standing clusters, where the magnetic moment increases towards the atomic value when decreasing the cluster size, we show, by tuning the Ni cluster size down to the sub-nanoscale, that there is a size limit below which the clusters become non-magnetic when embedded in Ag. To this end, we have fabricated by DC-sputtering a system composed of sub-nanometer sized and non interacting Ni clusters embedded into a Ag matrix. A thorough experimental characterization by means of structural techniques (x-ray diffraction, x-ray absorption spectroscopy) and DC-magnetization confirms that the cluster size is in the sub-nanometric range and shows that the magnetization of the system is dramatically reduced, reaching only 38% of the bulk value. The experimental system has been reproduced by density functional theory calculations on Nim clusters (m = 1–6, 10 and 13) embedded in Ag. The combination of the experimental and theoretical analysis points out that there is a breakdown of magnetism occurring below a cluster size of six atoms. According to our results, the loss of magnetic moment is not due to Ag–Ni hybridization but to charge transfer between the Ni sp and d orbitals, and the reduced magnetization observed experimentally is explained on the basis of the presence of a narrow cluster size-distribution where magnetic and non-magnetic clusters coexist.
Export citation and abstract BibTeX RIS
1. Introduction
Magnetic properties of materials change drastically from the bulk size to the nanoscale [1, 2]. Understanding the new magnetic phenomena arising at the nanoscale constitutes not only an exciting field of basic research, but also an essential step towards the technologically challenging miniaturization of devices. Outstanding interest in sub-nanometric 3d-transition metals is supported by a number of works reporting on Fe, Co and Ni clusters free-standing [3, 4], deposited onto metals [5, 6] or, more recently, onto graphene [7].
In these systems, together with Fe and Co ultrathin film structures [8], the magnetic moment has been observed to increase with respect to the bulk value, the reason being the enhancement of the orbital magnetic moment due to the narrowing of the electron bands and the loss of symmetry of the crystal field at the surface. However, when the 3d-clusters are coated or embedded in a matrix, changes of the magnetic moment have been reported that point either towards an increase [9, 10] or a decrease [11–14] with respect to bulk, depending on the coating or matrix material.
The reduction of the magnetic moment is especially evident in Ni clusters due to the weaker magnetic moment of Ni as compared to Fe or Co. In fact, a reduction of the Ni mean magnetic moment has been reported when the clusters are embedded in a matrix or coated by a surfactant [15–21]. This phenomenon has been generally attributed to surface effects, such as spin-canting [17, 18], formation of a NiAg alloy on the surface of the particles [21], or to the existence of a 'dead layer' due to hybridization with the matrix atoms [15, 16]. Thus in most cases, regardless of the controversy connected to basic understanding of the electronic orbital configurations and charge transfer, the embedded Ni clusters have been generally thought of as core-shell particles with a weakly or non-magnetic shell surrounding a magnetic core.
In this sense, this paper is devoted to understanding the mechanisms leading to the reduction of the Ni mean magnetic moment when forming nanoparticles in a Ag matrix. The combination of a thorough structural and magnetic experimental analysis together with density functional theory (DFT) calculations has led us to conclude as the most plausible hypothesis for the breakdown of magnetism the existence of a size limit below which Ni clusters embedded in Ag become non-magnetic. Additionally, results point at a charge transfer occurring between the Ni sp and d orbitals as the origin for the breakdown of magnetism rather than to Ag–Ni hybridization.
The paper is organized as follows: In section 2 we present the experimental results on the structural and magnetic properties of the films. In section 3 we present the theoretical calculations on Ni clusters embedded in an Ag bulk matrix. Finally, section 4 contains the discussion on the experimental and theoretical results, and section 5 is the final conclusion of the paper.
2. Experiment
2.1. Methods
A Ni6Ag94 nanogranular thin film has been prepared by DC-magnetron sputtering at room temperature. The base pressure of the DC-magnetron sputtering setup (Pfeiffer Vacuum Classic 500 system) is  mbar with approximately 2 · 10−3 mbar of Ar. The film was deposited onto a Si(100) substrate. The film thickness is 390 nm (Alpha-step KLA-Tencor Profiler). To prevent oxidation, the film was coated with a ≈10 nm thick Au layer. The Ni atomic composition of the film checked by energy-dispersive x-rays (EDX) is
  %. Because of the immiscibility between Ni and Ag, the resulting film displays a nanogranular microstructure due to a frustrated segregation promoted by the DC-sputtering fabrication method. The low Ni concentration favours negligible magnetic interactions and in the present case, as will be shown in the following, a small value of the particle size is obtained, maximizing the size and surface effects. To establish trends, the segregation of Ni into the Ag matrix has been achieved with the annealing of four sections of the as-deposited film at 100, 200, 300 and 400 °C, respectively, in an Ar atmosphere.
The microstructure of the as-deposited and annealed films has been analyzed by x-ray diffraction (XRD) and Ni K-edge x-ray absorption spectroscopy (XAS). XAS is an essential structural technique in these nanogranular systems in which the clusters are too small and low concentrated to be resolved by x-ray diffraction, as in this case, and by transmission electron microscopy due to the poor contrast and similar cubic structures of the constituents [22, 23].
XRD measurements have been performed on a Philips X'Pert PRO diffractometer (SGIker, UPV/EHU) in Bragg-Brentano configuration and with Cu Kα radiation. Due to the high texture of the films (see section 2.2.1), the selected  range was 35–45° with a step size of 0.026° and an integration time of 5 s per point.
Ni K-edge XAS spectra were collected at the BL22 CLÆSS beamline of the Alba Synchrotron facility. Experiments were performed in fluorescence geometry at 80 K. The monochromator used in these measurements was a double Si-crystal oriented in the (111) direction.
Magnetic measurements have been performed on a superconducting quantum interference device magnetometer (Quantum Design MPMS-7). Hysteresis loops ( ) were collected at fields (H) between 0 and 70 kOe and at several temperatures between 5 and 300 K. Zero-field cooling–field cooling measurements (ZFC–FC) were collected at
  kOe in a temperature range between 5 and 300 K.
2.2. Results
2.2.1. X-ray diffraction (XRD)
XRD data of the as-deposited and annealed Ni6Ag94 films are shown in figure 1 together with a Ag film as a control sample. Due to the preparation method, the films show a strong (111) texture, as observed in similar DC sputtered films [22, 23]. A unique peak is observed, which corresponds to the Ag (111) reflection. Note the clear asymmetry of the (111) peak due to the presence of Cu-K and
and  wavelengths, indicative of a very narrow peak (large crystallite size). A much weaker peak is also observed in the Ag film in the (200) position. Due to the low Ni concentration of the samples and/or small nanoparticle sizes, XRD does not show any trace of the Ni face centered cubic (fcc) lattices, even in the annealed samples.
To determine the lattice parameters of the Ag-rich phase as a function of annealing temperature, the (111) peak has been fitted to a pseudo-Voigt function as implemented in the FullProf software [24]. The results of the fit for the lattice parameters are shown in figure 2 together with an example of the fit. The as-deposited film shows a lattice parameter similar to that of bulk fcc Ag ( [25]). Annealing provides thermal energy, which allows the system to evolve towards a more ordered and stable structure, as indicated by the monotonous narrowing of the Ag (111) peak with annealing, indicative of a large crystallite size. The lattice parameter, even though it contracts slightly at 100 °C, presumably due to stress relaxation from the fabrication method, at 200 °C recovers a final value (
 Å) that is basically that of the bulk (
 Å).
Å).

Figure 1. Left: XRD data of the as-deposited and annealed Ni6Ag94 films. Patterns have been shifted up for clarity. Right: detail of the Ag (111) peak.
Download figure:
Standard image High-resolution image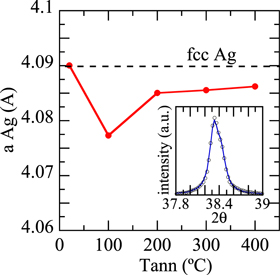
Figure 2. Lattice parameters of the Ag-rich phase for the as-deposited and annealed films as a function of the annealing temperature. The inset shows a fit example of the Ag (111) peak to a pseudo-Voigt function.
Download figure:
Standard image High-resolution image2.2.2. X-ray absorption structure (XAS)
The near-edge region of the XAS spectra (XANES) is shown in figure 3 for the as-deposited and annealed Ni6Ag94 films together with the XANES spectra of Ag and Ni foils, as references. There is a notable change in the shape of the jump at the edge position (E0) between the samples as-deposited and annealed at 100 °C and the annealed at 200 °C and 400 °C. In the latter two films, both the shape and the edge position resemble those of bulk fcc Ni, but the films as-deposited and annealed at 100 °C are shifted  with respect to the bulk. This indicates that electronic changes are taking place due to atomic rearrangements. Furthermore, from inspection of the structure of the XANES signal just above the edge, it is clear that all films retain the fcc structure present in bulk, but it can be readily observed from the position of the minima and maxima that the structure of the as-deposited film and the film annealed at 100 °C resembles the structure of fcc Ag, while annealing above 200 °C promotes the evolution towards the Ni fcc structure. This is indicative of a high number of Ag atoms as nearest neighbors of Ni in the as-deposited film and the film annealed at 100 °C, a sign of a small nanoparticle size with a large surface-to-volume ratio, as will be confirmed later by means of the extended x-ray absorption fine structure (EXAFS) analysis. Another important point deduced from the XANES observation is that there are no Ni oxides, as this would be easily observed by the appearance of a pre-edge peak.

Figure 3. (a) Ni K-edge XANES signals and (b) EXAFS signals for the as-deposited and annealed Ni6Ag94 films together with the fcc Ni and fcc Ag foils. In (a) the foils have been shifted to ease comparison. Note that the fcc Ag energy axis is on top. In (b) all the spectra have been shifted up for the sake of clarity.
Download figure:
Standard image High-resolution imageThe structural EXAFS signals were extracted from the absorption spectra using standard procedures for background substraction and data normalization as implemented in the software Athena [26]. Systematic errors were eliminated by using the same procedure for all the data sets. The fine structure extended from 20 to 700eV above the edge was first normalized to the jump of the K-absorption edge and then fitted with the aid of a cubic spline curve to remove the low frequency background oscillations. Finally, it was converted to photon-electron wave vector k-space. The EXAFS signals,  obtained in this way are displayed in figure 3(b) for the as-deposited and annealed samples together with the Ag and Ni foils as references. Afterwards, the range
  Å−1 of the EXAFS signals was Fourier transformed to radial coordinates, R, in order to gain direct information about the structure around the Ni sites (figure 4(a)). We have selected the first shells contribution (1 Å
 Å) and fitted the back-transformed (filtered) EXAFS signal (figure 4(b)).

Figure 4. (a) Experimental Fourier transforms (dots) and first shells ( Å) fit (continuous black line) of the as-deposited and annealed Ni6Ag94 films. (b) Corresponding fits in the back-Fourier transform of the
  first shells (
 Å) shown in (a).
Download figure:
Standard image High-resolution imageQuantitative information on the local structure around the Ni atoms and its evolution with the annealing temperature was obtained by fitting the filtered EXAFS data to the expression [27]:
The sum expands over all the species of backscattering atoms at the same distance Rj of the central atom with variance  (Debye–Waller factor) around the absorber, and Nj is the number of such atoms. The scale factor
  is related to the many body effects and
  is the mean free path term that takes into account the inelastic losses of the photoelectron.
  is the magnitude of the effective curved-wave backscattering amplitude for the jth type of atoms and
  is the modification in the phase shift of the ejected photoelectron wave function by the potential of the central absorbing and backscattering atoms. In our case, the central atom is Ni and two single scattering paths have been considered: Ni–Ni and Ni–Ag. The corresponding backscattering parameters of both kinds of neighbors,
  and
and  have been theoretically generated with the FEFF6.0 codes [28].
In order to improve the reliability of the fits, the four films have been fitted simultaneously as implemented in the IFeffit and Artemis softwares [26, 29]. The parameters  and
and  for each path Ni–Ni and Ni–Ag were left free in the fitting procedure but were common for all the samples. An additional constraint was made as a result of the XANES inspection: the number of first nearest neighbors has been fixed to 12 (
 ) as corresponds to a fcc ordering. Results have been checked with the additional XAFS software Viper [30]. Fits in the direct
  and back-Fourier (filtered)
  spaces are shown in figure 4 and the results of the fit are represented in figure 5.
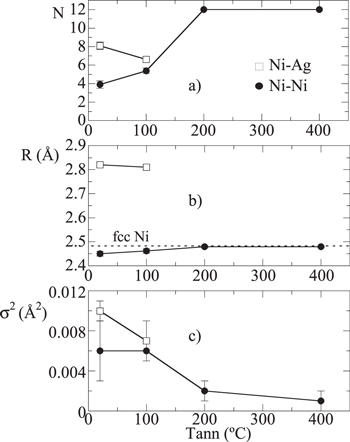
Figure 5. (a) Number of nearest neighbors (N), (b) interatomic distances (R) and (c) Debye–Waller factors ( ) obtained from the EXAFS first shells fits of the as-deposited and annealed Ni6Ag94 thin films.
Download figure:
Standard image High-resolution imageAs shown in figure 5(a), the Ni–Ni coordination number for the as-deposited film is  well below the bulk value (12). This indicates that, on average, every Ni atom is surrounded by only four Ni atoms, the other eight being Ag atoms. This suggests that the film is composed of very small clusters with a high surface-to-volume ratio. Annealing at 100 °C increases
  to
to  an indication of the thermal treatment promoting the segregation of Ni and consequently a reduction of the number of surface atoms (an increment of the cluster size). An estimation of the cluster size can be gathered from the average number of Ni nearest neighbors (
 ). As shown from theoretical calculations [1, 31], for compact shapes retaining an fcc ordering the mean number of nearest neighbors increases rapidly with the cluster size. In our case, a coordination value of
  obtained for the as-deposited film would imply having a cluster size of
  atoms, increasing to
  atoms for the film annealed at 100 °C (
 ), in which all atoms count at least 1 Ag atom as nearest neighbor. A similar result for the cluster size can be obtained from the phenomenological expression published in [32] that relates
  with the cluster size D (see the Supplementary Information (SI)).
Above 200 °C the contribution of the Ni–Ag path becomes negligible and  equals the bulk value (12), a sign of the Ni particles becoming larger than
  [32].
[32].
The segregation process promoted by the thermal treatment is also reflected in the evolution of the Ni–Ni interatomic distances ( ), see figure 5(b). In this respect, the Ni–Ni interatomic distances are slightly contracted with respect to the Ni fcc bulk and expand with the thermal treatment, until they reach the Ni bulk value (2.482 Å) at 200 °C. The Ni–Ag interatomic distances (
 ) of the as-deposited film and the annealed at 100 °C remain practically unchanged at 2.81–2.82 Å, also slightly smaller than the Ag–Ag distance in an fcc Ag lattice (2.89 Å) [25].
Regarding the Debye–Waller factors, they provide a measure of the structural disorder around the Ni atoms. The disorder can be dynamic, due to thermal agitation, or static, due to lattice distortions. In this case, because all measurements were performed at 80 K, the changes in the Debye–Waller factor from one film to another reflect uniquely the static disorder. As shown in figure 5(c), the Debye–Waller factor of the Ni–Ni path decreases with the annealing due to the structural ordering induced by the thermal treatment, and the Ni–Ag path displays a slightly larger Debye–Waller factor than the Ni–Ni path, as corresponds to the more disordered environment of surface atoms.
2.2.3. Magnetic characterization
As shown in figure 6, 5 K hysteresis loops ( ) and zero-field cooling–field cooling (ZFC–FC) measurements of the as-deposited NiAg thin film display a paramagnetic-like behavior down to 5 K. The fact that blocking is not observed is a consequence of either the low magnetocrystalline anisotropy of Ni or the presence of a small magnetic moment per particle (small volume), or both.

Figure 6. (a) 5 K hysteresis loops ( ) of the as-deposited and annealed Ni6Ag94 films. In the as-deposited film, the experimental points are the open dots, and the continuous line is the Langevin fit. The inset shows the 40 K
  curve of the as-deposited film together with the 5 K curve for comparison. (b) Zero-field cooling (ZFC) measurements (open dots) and Langevin fits (continuous line) of the as-deposited film taken at H = 2 and 10 kOe. The inset displays a detail of the low temperature region. The diamagnetic signal of the substrate has been removed in all measurements.
Download figure:
Standard image High-resolution imageAdditionally, the blocking not being observed down to 5 K suggests that magnetic interactions between nanoparticles are negligible [33]. This is also supported by the  purely linear behavior occurring at temperatures above 40 K (see inset of figure 6(a).
On the contrary, the  curves of the films annealed at 200 °C and 400 °C are saturated and display coercivity and remanence (figure 6), and the ZFC–FC curves are slowly variable and irreversible (see the SI). This indicates that Ni has segregated in the form of large ferromagnetic particles, in accordance with the EXAFS results. The saturation magnetization (Ms) at 200 °C is only slightly lower than at 400 °C, indicating that annealing at 200 °C promotes an almost full segregation of Ni. The saturation value at 400 °C (17.4 emu/cc) corresponds to a Ni atomic content of 5.2% assuming an fcc Ni bulk value of 512 emu/cc. This confirms the value obtained from EDX (
 %).
%).
Additional magnetic and structural information can be put forward from the analysis of the paramagnetic response of the as-deposited film by a fit to the Langevin law [34]:

M0 being the saturation magnetization and  μ is the magnetic moment of the magnetic clusters given by
  , where
  is the volume of the nanoparticles, assumed spheres with diameter D, and
  = 512 emu/cc is the saturation magnetization of bulk fcc Ni [34].
  is a term that accounts for the strength of the magnetic interactions [35]. In order to take into account the different sizes of the Ni clusters we have introduced a log-normal size distribution function
  which is defined as follows:
and depends on two parameters, α and β. The mean particle diameter ( ) and the standard deviation (σ) are given by
In sum, the evolution of the magnetization of an array of Ni nanoparticles with a size distribution given by equation (3) is given by:

To reduce correlations between parameters and corresponding fitting errors, the  curve at 5 K and the ZFC curves measured at
  2 and 10 kOe have been fitted simultaneously to equation (5), the four data sets sharing common M0, α, β and
  The fitted curves (continuous line) with the experimental data (open dots) are shown in figure 6.
Results of the fits give  emu/cc, which, compared to the magnetization of bulk Ni (512 emu/cc), corresponds to a Ni atomic content of
  %, significantly lower than the
  % value obtained by EDX. This is a phenomenal sign of a drastic 62% reduction of the magnetic signal with respect to the bulk value. The mean cluster diameter (assuming each Ni atom contributes with a maximum of 0.6
  as in bulk [34]) is
  nm with a narrow size-distribution function of
  nm, corresponding to a mean cluster size of
  atoms, considerably larger than the average size obtained from EXAFS (
 atoms). The distributions of the magnetic cluster size and the number of atoms per cluster (m) are shown in figure 7. Finally, the term accounting for the strength of the magnetic interactions between clusters results in a very small value (
 K), an additional sign of the negligible interactions among clusters.
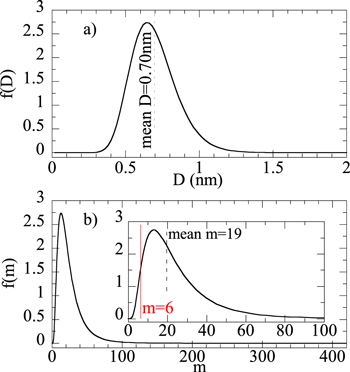
Figure 7. (a) Magnetic cluster log-normal size-distribution obtained from the Langevin fit for the as-deposited thin film. (b) Corresponding distribution in terms of number of atoms per cluster (m). The  -axis corresponds to the same
  -axis shown on top. Note that according to the saturation magnetization, this magnetic distribution only represents 38% of the film total Ni content.
Download figure:
Standard image High-resolution imageAs supported by DFT calculations below and further discussed in section 4, the observed drastic reduction of the magnetic signal (62%) and the larger mean magnetic cluster size ( atoms) compared to the mean cluster size obtained from a purely structural technique such as EXAFS (
 atoms) suggest that there is a significant number of small clusters with a non-magnetic response that are not being detected in the magnetic analysis.
3. Density functional theory (DFT) calculations
3.1. Details of the computational procedure and model
Our calculations were performed using the DFT package SIESTA [36]. In this work we used the Perdew–Burke–Ernzerhof form of the generalized gradient approximation for the exchange and correlation potential [37], and atomic cores were described by nonlocal norm-conserving scalar-relativistic Troullier–Martins pseudopotentials [38] factorized in the Kleinman–Bylander form [39]. The pseudo-potentials for Ni and Ag were generated using the valence configurations  and
and  respectively. More details can be found in our previous works [40, 41]. The valence states were described using double-ζ doubly polarized basis sets. We used an energy cutoff of 250 Ry to define the real space grid for numerical calculations involving the electron density. Using a conjugate gradient method [42], all the structures were fully relaxed, without any constraints on geometry or spin, until the interatomic forces were smaller than 0.006 eV/Å. As a benchmark of our method, we calculated the binding energy for the Ag bulk 2.367 eV/atom and the lattice constant is 4.23 Å in comparison with the experimental values 2.96 eV/atom and 4.09 Å [25]. In the case of Ni, for Ni2 we have 2.17 Å and 1.34 eV/atom in comparison with the experimental values 2.15 Å and 1.04 eV/atoms [43]. Comparison of our calculation and the experimental reports in both (bulk and Ni clusters) is reasonable. The previous results give us confidence in our method to simulate the Ni clusters in a bulk Ag matrix.
In our bulk calculations, we considered a finite system with N = 32 atoms in the unit cell (base with atoms in fcc positions) with periodic boundary conditions, and we used simple cubic lattice vectors for solid description. The system size is large enough to consider negligible the interactions between Ni clusters and their replicas in neighboring cells. This holds for clusters up to m = 6, where m is the number of atoms per cluster. For larger clusters (m = 10 and 13) we have considered a larger unit cell (N = 108 atoms) to avoid interactions between the Ni cluster and its replicas. For the growth pattern of the Ni clusters, we assume that the Ni atoms are placed in a substitutional way and occupy fcc lattice sites when forming the clusters. This assumption is confirmed by our experimental XANES results (figure 3) and backed up by the fact that the excess energy of a single Ni atom into a Ag matrix in the substitutional way (−3.78 eV) is larger than the interstitial one (−1.94 eV). We have also checked that the NiAg system prefers aggregation and compact shapes. For example, when the Ni4 clusters are split into two separated pairs (second nearest neighbors distance), the system becomes less stable by 0.54 eV. Also, additional calculations in a Ni10 cluster showed that compact configurations are the most stable ones, the system becoming less stable when the number of Ni–Ag bonds increases (see the SI). Finally, it is worth noticing that in the case of Ni10 free-standing clusters, the order of the geometrical isomers is different than in the embedded case (see the SI).
3.2. Results
The Nim clusters with m = 1–6, 10, 13 are shown in figure 8, together with the calculated results for the average Ni–Ni and Ni–Ag interatomic distances ( and
and  ). The Ni–Ni and Ni–Ag interatomic distances obtained for the most stable configurations are larger than the bulk value for the smallest clusters, and tend towards the bulk value as the cluster size m increases. This tendency towards the bulk value when increasing the cluster size is supported by EXAFS (figures 5 and 8(a)), although EXAFS reflects a slight increase towards the bulk value and not a decrease as the DFT calculations, being the calculated distances
  Å longer than the experimental ones. We attribute this difference to the stress introduced by the fabrication method, and have confirmed that this difference in the interatomic distances does not affect the calculated magnetic moments (see the SI).
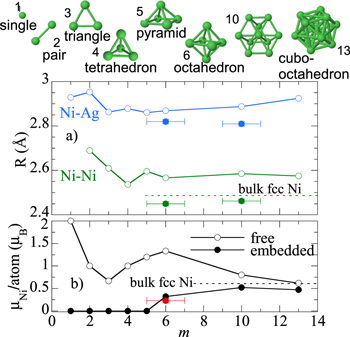
Figure 8. Illustration of the studied Nim clusters. Theoretically calculated (a) interatomic distances and (b) average magnetic moment per Ni atom as a function of the cluster size for the Nim clusters embedded in Ag and free. The experimental values obtained for the as-deposited ( ) and annealed at 100 °C (
 ) Ni6Ag94 films are also shown for comparison (full dots in (a), red dot in (b)).
Download figure:
Standard image High-resolution imageThe results of the calculations for the total magnetic moment of the system (including Ni and Ag atoms) ( ), the magnetic moment of the Ni cluster both embedded in Ag (
 ) and free (
 ), the average magnetic moment per Ni atom in the embedded case (
 atom), and the charge difference per Ni atom with respect to the atomic state (
 ), are shown in table 1. The average magnetic moment per Ni atom (
 atom) is also shown in figure 8(b).
Table 1.
Magnetic and electronic properties of the Nim system with m = 1–6, and Nim
 with m = 10 and 13. The Nim clusters are illustrated in figure 8.
  is the total magnetic moment of the NiAg system,
  and
and  are respectively the magnetic moments of the Nim clusters in the NiAg system and free-standing,
  atom is the mean magnetic moment per Ni atom in the NiAg system and
  is the average net charge difference per Ni atom with respect to the atomic state.
| System |

 ( ( ) ) |
 atom atom |

|
|---|---|---|---|

|

|
(e) | |
| Ni1 | 0.00, 0.00 (2) | 0.0 | 0.09 |
| Ni2 | 0.00, 0.00 (2) | 0.0 | 0.09 |
| Ni3 | 0.00, 0.00 (2) | 0.0 | 0.08 |
| Ni4 | 0.00, 0.00 (4) | 0.0 | 0.05 |
| Ni5 | 0.00, 0.00 (6) | 0.0 | 0.08 |
| Ni6 | 1.92,1.86 (8) | 0.32 | 0.06 |
| Ni10 | 5.86, 5.16 (8) | 0.52 | 0.04 |
| Ni13 | 6.54, 6.12 (8) | 0.47 | 0.03 |
As shown in figure 8(b), in free Ni clusters the average magnetic moment per Ni atom follows the general trend published in recent theoretical and experimental works (see [44–47] and [48] and references therein). As expected, it decreases (although not monotonically) towards the bulk value as the cluster size increases.
This trend changes drastically when the Ni clusters are embedded in a Ag matrix. In this case, for m = 1 and 3 we have clearly a non-magnetic solution for the system. For Ni4 the non-magnetic solution is practically degenerated with the magnetic one, the energy difference being smaller than 0.03 eV.
It is of paramount importance that the first spontaneous magnetic solution appears for m = 6; however, the energy difference with respect to non-magnetic is very small once again (0.025 eV). This suggests that a non-magnetic to magnetic transition appears for sizes of around m = 6 atoms.
In general, for all Ni clusters the charge transference is very small ( ), suggesting that there is no hybridization with the Ag, as will be discussed later. Finally, as a sign of consistency, it should be noted that calculations predict a slight polarization of the Ag matrix (
 see table 1), as observed experimentally in similar FeAg [49], FeAu [23] and CoCu [50] nanogranular systems. Calculations show that this polarization occurs mainly in those Ag atoms in touch with the Ni cluster atoms, reaching up to 0.04
  per Ag atom in some cases and being negligible for far away Ag atoms.
4. Discussion
In this section, from the combination of the experimental and theoretical studies shown in the preceding sections we will show that the drastic reduction of the magnetic signal detected in the magnetic analysis can be attributed to the existence of a cluster size limit below which the Ni clusters become non-magnetic when embedded in a Ag matrix.
As shown in section 2.2.1, the presence of Ni in the Ni6Ag94 thin films is undetectable by means of XRD (even in the films annealed at 200 °C and 400 °C, where according to the EXAFS and magnetic analysis the Ni has reached an almost full segregation), a fact that can be attributed to the existence of either small or too few Ni nanoclusters.
This issue is confirmed by EXAFS, which, unlike XRD, is an element-specific and short-range order technique that detects all the Ni in the sample regardless of the cluster size or concentration. As shown in section 2.2.2, the average cluster size for the films as-deposited and annealed at 100 °C is  and
and  atoms, respectively.
On the other hand, the magnetic analysis has provided indirect structural information by means of the Langevin fits, as shown in section 2.2.3. For the as-deposited film, fits give a mean diameter of  nm with a narrow size-distribution function of
  nm (figure 7). This corresponds to a mean number of atoms per cluster of
  considerably larger than the
  atoms obtained from EXAFS. Additionally, comparison of the magnetic saturation value of the film with the bulk magnetization of Ni shows that the magnetic signal of the film is 62% lower than the bulk.
These experimental findings (the smaller EXAFS size compared to the magnetic size and the drastic reduction of the magnetic signal) can be explained by means of the DFT analysis. In fact, according to the DFT analysis, there is a non-magnetic to magnetic transition for clusters of around m = 6 atoms. This suggests that in our film there is a distribution of cluster sizes, but the smallest ones are invisible from the magnetic point of view. According to the saturation magnetization, the majority of the Ni content of the film (62%) is forming these small non-magnetic clusters, and only the remaining 38% is forming the larger magnetic clusters and is thus represented in the magnetic size-distribution shown in figure 7. In fact, as shown in figure 7, the number of small clusters of less than  atoms comprise only
  % of the whole magnetic distribution. Unlike the magnetic analysis, EXAFS detects all the Ni in the film, and results in an average cluster size that is substantially smaller (6 atoms) than the mean magnetic size (19 atoms), because of the heavier weight of the smaller non-magnetic clusters (62% of the Ni atoms shared among the smallest particles) against the larger ones in the total size-distribution.
Also, it should be noted that DFT calculations show that in the case of larger clusters (m = 10 and 13), when a clear magnetic solution is well stabilized, the magnetic moment per Ni atom is basically the bulk value ( ) [51] (note that we are only calculating the spin contribution). As an additional sign of consistency, the corresponding mean magnetic moment per Ni atom obtained from the saturation magnetization of the
  loops is
  very close to the magnetic moment obtained theoretically for 6-atom sized clusters (figure 8(b)).
Finally, we have also considered the hypothesis of Ni–Ag hybridization to account for the observed reduction of magnetic signal. However, this hypothesis seems less plausible from both the experimental and DFT results. The hypothesis of Ni–Ag hybridization does not seem to be consistent with our experimental findings, because if there was hybridization, the clusters could be thought of as core-shell particles with a magnetic core—non-magnetic shell structure. This means that the size obtained by EXAFS should be substantially larger (core + shell) than the size obtained by the magnetic analysis (only the core), which is opposite to our findings. In fact, a cluster size of 19 atoms (the magnetic mean size) corresponds to a  [1, 31, 32], substantially larger than the result obtained from the EXAFS fit (
 ). Additionally, DFT calculations suggest that Ni–Ag hybridization is negligible. In fact, as shown in table 1, the charge difference
  between the Ni atoms embedded in Ag and the Ni atomic state is insignificant in all the studied cases (
 ). This discards any charge transference between the electronic bands of Ni and Ag. This conclusion is also supported by comparing the density of states (DOS) of bulk Ag and a free Ni10 particle with the DOS of a Ni10 particle embedded in Ag (figure 9). The up and down bands of the free Ni10 particle are shifted consistently to give the magnetic moment shown in figure 8(b). This shift is maintained, although it is less pronounced in the embedded clusters; but more importantly, the structure of the electronic bands corresponding to the embedded system clearly preserve the individual structures corresponding to bulk Ag and the free Ni particles, pointing to a lack of hybridization between them. This conclusion is also supported by the projected density of states for the
  and
and  orbitals of Ni and
 and
and  of Ag in the range from −15–10 eV shown in figure 4 of the SI, where it is clearly observed that from −15 eV to −4.97 eV (Fermi energy) there is not substantial overlap between Ni and Ag orbitals.

Figure 9. Density of states (OS) of (a) bulk Ag and a Ni10 free cluster, (b) a Ni10 cluster embedded in Ag and the Ni10 free cluster shown in (a). For ease of comparison, the energy axes of bulk Ag and the Ni10 cluster embedded in Ag have been shifted to make the Fermi energies coincident with that of the Ni10 free cluster.
Download figure:
Standard image High-resolution image
In sum, in our particular NiAg case, the drastic reduction of the mean magnetic moment of Ni clusters embedded in Ag is attributed to the existence of a large number of small Ni clusters that become non-magnetic due to a redistribution of the Ni electrons between the Ni sp and d orbitals. In fact, changes in the electronic occupation of the sp and d bands were also inferred experimentally in the jump of the absorption edge in the XANES measurements (figure 3). A similar conclusion has been reached recently for Ni clusters deposited onto a graphene monolayer [7]. In the latter case, Ni clusters with less than four atoms were found non-magnetic due to charge transfer between the Ni s and d orbitals.
5. Conclusion
This work presents a combined experimental and theoretical study on the structural and magnetic properties of Ni sub-nanometric clusters embedded in a metallic Ag matrix. The magnetic response of the system highlights a dramatic (62%) decrease of the Ni mean magnetic moment with respect to the bulk value. DFT calculations on Nim clusters of selected sizes (m = 1–6, 10 and 13) embedded in a Ag bulk matrix suggest that the breakdown of magnetism revealed by DC-magnetization is due to the existence of a size limit (m = 6 atoms) below which Ni clusters embedded in Ag become non-magnetic. Additionally, results point at charge transfer occurring between the Ni sp and d orbitals as the origin for the breakdown of magnetism rather than to Ag–Ni hybridization.
Acknowledgments
The authors acknowledge A Svalov (UPV/EHU) for the thin film preparation, A Larrañaga from SGIker (UPV/EHU) for the XRD measurements, and L Simonelli and M Ávila from the CLÆSS beamline at the ALBA Synchrotron for assistance in the XAFS measurements. AGP, JA, LFB and MLFG are grateful for financial support from the Spanish MINECO (Projects No. MAT2011-27573-C04 and MAT2014-55049-C2-1-R) and from the Basque Government (Project No. IT711-13). FAG acknowledges the financial support from DIPC-UPV and the computer facilities, with thanks in particular to Diego Lasa for computational support. FAG and MBT acknowledge A Vega and L C Balbas for helpful discussions. MBT acknowledges the group GIR120 'Nanometric properties of matter' and financial support from the Spanish MINECO (Project FIS2014-59279-P). MBT, FAG, MLFG and AGP acknowledge the MULTINANOMAT excellence network funded by MINECO, SPAIN, MAT2011-15800-E and INCRAM, MINECO, Spain, MAT2014-59069-REDT.