


ABSTRACT
Galactic open and globular clusters (OCs, GCs) appear to inhabit separate regions of the age–mass plane. However, the transition between them is not easily defined because there is some overlap between high-mass, old OCs and low-mass, young GCs. We are exploring the possibility of a clear-cut separation between OCs and GCs using an abundance feature that has been found so far only in GCs: (anti)correlations between light elements. Among the coupled abundance trends, the Na–O anticorrelation is the most widely studied. These anticorrelations are the signature of self-enrichment, i.e., of a formation mechanism that implies multiple generations of stars. Here we concentrate on the old, massive, metal-rich OC NGC 6791. We analyzed archival Keck/HIRES spectra of 15 NGC 6791 main-sequence turnoff and evolved stars, concentrating on the derivation of C, N, O, and Na abundances. We also used WIYN/Hydra spectra of 21 evolved stars (one is in common). Given the spectral complexity of the very metal-rich NGC 6791 stars, we employed spectrum synthesis to measure most of the abundances. We confirmed the cluster super-solar metallicity and abundances of Ca and Ni that have been derived in past studies. More importantly, we did not detect any significant star-to-star abundance dispersion in C, N, O, and Na. Based on the absence of a clear Na–O anticorrelation, NGC 6791 can still be considered a true OC, hosting a single generation of stars and not a low-mass GC.
Export citation and abstract BibTeX RIS
1. INTRODUCTION
The separation between Galactic open and globular clusters (OCs, GCs) is ambiguous, and probably depends on mass, age, and Galactic population membership. Photometric data are insufficient to address this question; the color–magnitude diagrams (CMDs) of the oldest OCs are morphologically similar to those of metal-rich globulars. Fortunately, the problem can be attacked in a different way by searching for some chemical signatures that are unique to one or the other cluster type. Almost all Galactic GCs studied to date with sufficient sample sizes exhibit star-to-star variations in the abundances of light elements C, N, O, Na, Mg, and Al while their heavy element abundances usually are very uniform (see the reviews by Gratton et al. 2004, 2012, and references therein).
The light element variations in GCs are not random, but occur in distinct patterns. Particularly striking is the observed Na–O anticorrelation discovered by the Lick–Texas group (see the review by Kraft 1994). This feature has been found in (almost) all clusters studied so far (e.g., Carretta et al. 2009, 2010, and references therein), even in the low-mass ones. Possible exceptions are Ter 7 and Pal 12 (Tautvaišė et al. 2004; Sbordone et al. 2005; Cohen 2004), where only five and four stars were analyzed, respectively, and Rup 106 (Villanova et al. 2013). This anticorrelation is noticeably absent in field halo stars (e.g., Gratton et al. 2000), while it is found at all evolutionary phases in GCs (e.g., Gratton et al. 2001; Cohen & Meléndez 2005). This phenomenon is now firmly attributed to the pollution of a previous generation of cluster stars and is clearly dependent on the formation and early evolution of clusters.
The Na–O anticorrelation is such a distinctive characteristic of GCs that Carretta et al. (2010) proposed to use it as a definition of GCs: these are clusters able to sustain self-pollution and to produce a second generation8 of stars with modified composition (enriched in Na and depleted in O). The Na–O anticorrelation has been amply studied in Milky Way GCs: see, e.g., the work of the Lick–Texas group (reviewed by Kraft 1994 and Gratton et al. 2004); the large, homogeneous sample of GCs observed with FLAMES at Very Large Telescope (VLT; Carretta et al. 2009, and references therein); or the recent work on M 13 by Johnson & Pilachowski (2012). This anticorrelation has also been found in GCs of the Large Magellanic Cloud (Johnson et al. 2006; Mucciarelli et al. 2009) and the Fornax dwarf galaxy (Letarte et al. 2006). However, light element abundances have almost never been investigated in OCs with the same kind of large samples. A summary of O and Na results for OCs can be found in de Silva et al. (2009), who collected literature data from various sources and normalized them to a common abundance scale. They found no evidence for internal (single cluster) dispersion in either element, but cautioned about the paucity and the heterogeneity of the published samples.
Although most OCs are far less massive than GCs, there is a "gray area" containing low-mass and/or young GCs and high-mass and old OCs (Carretta et al. 2010, see in particular their Figure 2). We are studying clusters in this area of the mass–age plane. We have already presented results on 30 stars of the old, massive OC Berkeley 39 (Bragaglia et al. 2012). Analyses of our FLAMES/VLT spectra indicated no star-to-star spread in any of the measured elements, in particular, in Na and O. Recently, we have investigated Ter 8, a low-mass, low-metallicity ([Fe/H] ≃ −2.3) GC belonging to the Sagittarius dwarf spheroidal (Carretta et al. 2014). In our sample, one star out of the 20 observed red giants has an overabundance of Na. This indicates the presence of a very small fraction of second-generation stars, keeping Ter 8 in the GC category as defined by Carretta et al. (2010).
We targeted also another interesting object, NGC 6791. This OC is very old (about 9 Gyr, e.g., King et al. 2005, or about 7–8 Gyr, Brogaard et al. 2012), metal-rich ([Fe/H] = 0.30–0.45, e.g., Peterson & Green 1998; Gratton et al. 2006; Boesgaard et al. 2009; Frinchaboy et al. 2013), and massive (∼104M☉, e.g., Liebert et al. 1994; Platais et al. 2011). To account for the combination of age, mass, and a metallicity much higher than that of the other clusters at similar Galactocentric positions, recent studies have proposed hypotheses on the formation site of NGC 6791, (see, e.g., Jílková et al. 2012) for a recent calculation of its orbit.
Given all these characteristics, NGC 6791 is an important link between the OCs and GCs. To have an idea of the position of NGC 6791 in the mass–age plane, see Figure 1 in Bragaglia et al. (2012), where MV is used as a proxy for mass (and note that its MV has been revised upward by Buzzoni et al. 2012). NGC 6791 is an ideal target to test the lower mass limit for the Na–O anticorrelation (i.e., of multiple generations of stars) because of its relatively large age and mass. Indeed, while we were revising the analysis of our data, Geisler et al. (2012) presented evidence of a Na–O anticorrelation on the basis of spectra obtained with the HIRES spectrograph on the Keck I telescope (hereafter Keck/HIRES) and the Hydra multi-object spectrograph on the WIYN telescope (WIYN/Hydra), speculating on the nature and origin of this cluster.
We present here a light element abundance study of archival Keck/HIRES spectra of 15 main-sequence turn-off (MSTO), subgiant branch (SGB), and red giant branch (RGB) members of NGC 6791. These stars are listed in Table 1. We supplement this work with an investigation of Na abundances from a sample of 21 RGB and red clump (RC) stars obtained with WIYN/Hydra (one of which is also in the Keck sample), which are listed in Table 2. The HIRES data are discussed in Section 2, with subsections that describe the targets, the observations and reductions, atmospheric parameters, and abundance results. Then in Section 3, we consider the Hydra data in a similar manner. Our results from both data sets are merged and compared in Section 4, and a summary is presented in Section 5.
Table 1. The HIRES Sample
| ID | R.A. | Decl. | B | V | K | S/N | Teff | log g | vt | Prob | Remarks |
|---|---|---|---|---|---|---|---|---|---|---|---|
| (h:m:s) | (d:p:s) | 2MASS | (K) | (km s−1) | (p.m.) | ||||||
| 5744 | 19:20:46.08 | +37:47:32.3 | 18.350 | 17.377 | 15.477 | 45 | 5364 | 3.96 | 0.94 | 90 | HIRESa, publ. |
| 7649 | 19:20:51.71 | +37:46:57.0 | 18.333 | 17.428 | 15.475 | 16 | 5566 | 4.06 | 0.91 | 78 | HIRESa, publ. |
| 11220 | 19:21:02.19 | +37:50:54.0 | 18.278 | 17.350 | 15.190 | 33 | 5468 | 3.99 | 0.93 | ... | HIRESa |
| 12181 | 19:21:05.72 | +37:50:45.6 | 18.305 | 17.400 | 15.763 | 32 | 5551 | 4.05 | 0.92 | ... | HIRESa |
| 13334 | 19:21:10.37 | +37:48:17.6 | 18.306 | 17.367 | 15.497 | 31 | 5474 | 4.00 | 0.93 | ... | HIRESa |
| 13352 | 19:21:10.40 | +37:45:22.6 | 18.298 | 17.435 | 15.128 | 36 | 5738 | 4.13 | 0.89 | ... | HIRESa |
| 14416 | 19:21:16.28 | +37:49:49.5 | 18.319 | 17.391 | 15.118 | 40 | 5482 | 4.01 | 0.93 | ... | HIRESa |
| 15592 | 19:21:25.71 | +37:46:53.3 | 18.29 | 17.425 | 15.397 | 42 | 5675 | 4.10 | 0.90 | ... | HIRESa |
| 9609 | 19:20:57.20 | +37:47:45.0 | 18.368 | 17.158 | 14.357 | 25 | 4738 | 3.57 | 1.07 | 53 | HIRESb, T32 |
| 11014 | 19:21:01.49 | +37:44:48.6 | 18.575 | 17.457 | 14.904 | 29 | 4968 | 3.81 | 0.99 | ... | HIRESb, T33 |
| 11092 | 19:21:01.76 | +37:46:32.3 | 18.553 | 17.372 | 14.623 | 32 | 4799 | 3.69 | 1.03 | 88 | HIRESb, T34 |
| 12382 | 19:21:06.45 | +37:46:40.1 | 18.520 | 17.369 | 14.786 | 31 | 4887 | 3.73 | 1.02 | ... | HIRESb, T35 |
| 5796 | 19:20:46.25 | +37:49:10.8 | 16.566 | 15.223 | 12.144 | 30 | 4493 | 2.64 | 1.37 | 99 | HIRESc, Hydra, Kepler |
| 7347 | 19:20:50.83 | +37:43:29.5 | 16.474 | 15.099 | 11.935 | 34 | 4444 | 2.55 | 1.40 | 99 | HIRESc, Hydra, Kepler |
| 8351 | 19:20:53.59 | +37:47:19.0 | 16.507 | 15.117 | 11.920 | 34 | 4418 | 2.54 | 1.40 | 96 | HIRESc, Kepler |
| 4591 | 19:20:42.34 | +37:49:18.7 | 18.292 | 17.439 | 15.081 | ... | ... | ... | ... | ... | HIRESa, NM |
| 2130 | 19:20:31.47 | +37:54:26.3 | 18.27 | 17.365 | 15.112 | ... | ... | ... | ... | ... | HIRESa, NM? |
| 8506 | 19:20:53.99 | +37:46:41.9 | 18.329 | 17.150 | 14.335 | ... | ... | ... | ... | ... | HIRESb, NM |
| 6509 | 19:20:48.37 | +37:46:30.2 | 18.687 | 17.542 | 14.440 | ... | ... | ... | ... | ... | HIRESb, NM |
Notes. ID, B, V from Stetson et al. (2003); coordinates and Prob (p.m.) from K. M. Cudworth (2008, private communication). Kepler indicates that the star has been observed by the Kepler satellite and is considered an astroseismologic member (Stello et al. 2011). T32, T33, T34, T35 are identifications in Geisler et al. (2012); NM = not a member PIs of Keck programs; HIRESa: A.M. Boesgaard (U. Hawaii), two stars published in Boesgaard et al. (2009); HIRESb: F. Bresolin (U. Hawaii), published in Geisler et al. (2012); HIRESc: G.W. Marcy (U. California Berkeley).
Download table as: ASCIITypeset image
Table 2. The Hydra Sample
| ID | R.A. | Decl. | B | V | K | S/N | RV | err | Teff | log g | vt | Prob | Remarks |
|---|---|---|---|---|---|---|---|---|---|---|---|---|---|
| (h:m:s) | (d:p:s) | 2MASS | (km s−1) | (km s−1) | (K) | (km s−1) | (p.m.) | ||||||
| 2309 | 19:20:32.66 | +37:46:22.4 | 16.226 | 14.788 | 11.424 | 26 | −47.81 | 0.50 | 4283 | 2.33 | 1.47 | 33 | Kepler |
| 3712 | 19:20:39.23 | +37:44:37.5 | 16.213 | 14.848 | 11.827 | 15 | −44.38 | 0.62 | 4502 | 2.51 | 1.41 | 98 | |
| 4482 | 19:20:41.97 | +37:47:54.4 | 15.871 | 14.548 | 11.517 | 10 | −43.85 | 0.78 | 4530 | 2.31 | 1.44 | 98 | Rebinned, Kepler |
| 5454 | 19:20:45.18 | +37:44:34.2 | 16.312 | 14.915 | 11.704 | 25 | −47.59 | 0.40 | 4393 | 2.47 | 1.43 | 98 | |
| 5706 | 19:20:45.98 | +37:50:48.3 | 17.033 | 15.786 | 13.031 | 11 | −44.64 | 0.83 | 4723 | 3.02 | 1.25 | 85 | |
| 6288 | 19:20:47.66 | +37:47:32.5 | 16.084 | 14.665 | 11.267 | 12 | −55.33 | 0.40 | 4315 | 2.31 | 1.48 | 29 | Bin/NM?, G12, Kepler |
| 6940 | 19:20:49.67 | +37:44:08.0 | 15.923 | 14.588 | 11.500 | 25 | −44.61 | 0.37 | 4525 | 2.42 | 1.44 | 0 | C06, G12 |
| 7347 | 19:20:50.83 | +37:43:29.5 | 16.474 | 15.099 | 11.935 | 13 | −44.70 | 0.43 | 4435 | 2.57 | 1.39 | 99 | Rebinned, Kepler, HIRES |
| 7540 | 19:20:51.38 | +37:46:30.7 | 15.527 | 14.206 | 11.246 | 41 | −47.05 | 0.42 | 4578 | 2.30 | 1.48 | 51 | |
| 7912 | 19:20:52.44 | +37:47:15.4 | 17.009 | 15.699 | 12.700 | 11 | −49.59 | 0.73 | 4554 | 2.89 | 1.29 | 97 | Rebinned, Kepler |
| 8395 | 19:20:53.69 | +37:50:24.0 | 15.943 | 14.574 | 11.549 | 36 | −47.85 | 0.52 | 4494 | 2.40 | 1.45 | 89 | Kepler |
| 8481 | 19:20:53.92 | +37:42:26.3 | 16.681 | 15.927 | 14.251 | 10 | −47.18 | 0.69 | 6178 | 3.77 | ... | 97 | BSS |
| 9462 | 19:20:56.72 | +37:43:07.8 | 16.000 | 14.656 | 11.586 | 26 | −45.86 | 0.51 | 4498 | 2.43 | 1.44 | 99 | G06 (3019), Kepler |
| 9786 | 19:20:57.71 | +37:49:01.5 | 16.791 | 15.435 | 12.336 | 24 | −46.46 | 0.40 | 4463 | 2.72 | 1.34 | 85 | Kepler |
| 10695 | 19:21:00.53 | +37:50:19.1 | 15.843 | 14.511 | 11.493 | 29 | −46.19 | 0.38 | 4524 | 2.30 | 1.45 | 88 | Kepler |
| 10806 | 19:21:00.87 | +37:46:39.9 | 15.948 | 14.576 | 11.468 | 34 | −47.60 | 0.41 | 4464 | 2.38 | 1.45 | 97 | G06 (2014), Kepler |
| 10898 | 19:21:01.13 | +37:42:13.8 | 15.949 | 14.459 | 10.938 | 30 | −47.20 | 0.42 | 4196 | 2.13 | 1.53 | 68 | C06, G12, Kepler |
| 11814 | 19:21:04.27 | +37:47:18.9 | 15.424 | 13.849 | 10.102 | 34 | −46.57 | 0.43 | 4075 | 1.79 | 1.64 | 98 | C06, G12, Kepler |
| 11938 | 19:21:04.74 | +37:45:56.4 | 15.914 | 14.564 | 11.527 | 31 | −46.27 | 0.39 | 4511 | 2.40 | 1.45 | 96 | Kepler |
| 12333 | 19:21:06.31 | +37:44:59.9 | 15.799 | 14.483 | 11.499 | 20 | −44.28 | 0.46 | 4563 | 2.41 | 1.45 | 99 | Kepler |
| 12823 | 19:21:08.07 | +37:49:08.6 | 16.862 | 15.567 | 12.554 | 19 | −46.56 | 0.69 | 4539 | 2.82 | 1.31 | 78 | |
| Not analyzed/Non members | |||||||||||||
| 5796 | 19:20:46.25 | +37:49:10.8 | 16.566 | 15.223 | 12.144 | ... | −45.34 | 0.91 | ... | ... | ... | 99 | HIRES, Very low S/N, Kepler |
| 2746 | 19:20:34.97 | +37:45:52.5 | 15.609 | 15.031 | 13.833 | ... | −15.71 | 0.89 | ... | ... | ... | 89 | NM |
| 11335 | 19:21:02.56 | +37:43:59.8 | 15.606 | 14.886 | 13.195 | ... | 15.66 | 0.34 | ... | ... | ... | 2 | NM |
| 14153 | 19:21:14.75 | +37:43:05.6 | 15.687 | 14.615 | 12.047 | ... | −67.20 | 0.37 | ... | ... | ... | ... | NM |
Notes. ID, B, V from Stetson et al. (2003), except B for stars 2130 and 15592, average between Montgomery et al. (1994) and Kaluzny & Rucinski (1995); coordinates and Prob (p.m.) from K. M. Cudworth (2008, private communication). C06: Carraro et al. (2006), who use Stetson's IDs. G06: Gratton et al. (2006), names indicated in Remarks; G12: Geisler et al. (2012); Kepler indicates that the star has been observed by the Kepler satellite and is considered an astroseismologic member (Stello et al. 2011). NM = not a member for RV.
Download table as: ASCIITypeset image
2. NGC 6791 LIGHT ELEMENT ABUNDANCES FROM HIRES SPECTRA
NGC 6791 presents two formidable challenges for medium- to high-resolution spectroscopic analyses: it is fairly distant, about 4 kpc, and it is very metal-rich, [Fe/H] ≃ +0.4 dec, as discussed in Section 1. The large distance of this cluster makes even its most luminous stars faint observational targets: V(RGB tip) ≃ 14. Only three of the stars in the HIRES sample are brighter than V ≃ 17.1, so all of the HIRES data have S/N ≲ 50. The high metallicity ensures that the RGB stars, which are the brightest NGC 6791 members, have mostly strong lines that are sensitive to microturbulent velocity choices. The spectral features are often also blended, and it is difficult to find many clean lines with which to perform a traditional abundance analysis. Additionally, only Fe is represented by both neutral and ionized species transitions in the spectral region usable for all the HIRES spectra (about 5500−6500 Å). These cautions should be remembered when considering the abundance results presented here.
2.1. The Stellar Sample
We queried the Keck Observatory Archive (KOA)9 and found spectra of 19 stars observed with Keck/HIRES (configured to have resolving power R ≡ λ/Δλ ≃ 45,000). The spectra had been obtained from 1999 to 2009 under several observing programs by three principal investigators (PIs): Ann Merchant Boesgaard (10 stars), Fabio Bresolin (6 stars), and Geoffrey W. Marcy (3 stars). The spectra were acquired using different setups, but they all included the wavelength region containing the same Na and O lines present in the Hydra spectra. To our best knowledge, analyses have been published only for two stars in Boesgaard et al. (2009) and five stars in Geisler et al. (2012).
In Table 1, we list coordinates and photometric data from Stetson et al. (2003) and Two Micron Sky Survey (2MASS) for these stars; they will be called by their numbers given in Stetson et al. (2003). We show their evolutionary phases in Figure 1. About half of the stars are at or near the MSTO, six are located at the base of the RGB, and three are on the RGB just below the RC. Since we have a large enough sample, we preferred to exclude a few dubious cases. We discarded as non-members or possible non-members (see Table 1 and Figure 1) a few stars that showed metallicity discordance with the main body of the sample or different RV (star 2130; note that we did not correct the absolute RV zero point of the HIRES reduced spectra, so we worked differentially).

Figure 1. V, B − V CMD for NGC 6791 (Stetson et al. 2003), with our targets indicated. Large circles indicate cluster members (red for stars observed with Hydra, and blue for those observed with HIRES) and diamonds indicate non-members (green for those excluded from RV mismatches and magenta from metallicity discordance).
Download figure:
Standard image High-resolution imageWe retrieved from KOA the raw data and the extracted/calibrated spectra and used the second for our analysis. The extracted spectra's quality was checked on two extreme cases, star 5744 (at the MSTO, observed in 1999 with the original single chip setup) and star 8351 (on the RGB, just below the RC, observed with the three-chips setup), i.e., one of the faintest, and one of the brightest objects, respectively. We retrieved four and three exposures, respectively, and the relevant calibration files. We used MAKEE, the pipeline reduction for HIRES and proceeded with the analysis as for the spectra presented in the paper (see the next sections). We found that the original and newly reduced spectra are essentially identical when overplotted.
We examined the individual exposures of each star (two to three for the bright RGB stars and up to seven for the MSTO stars), overplotting them to be sure of their correct wavelength registration. We excised the noise spikes in each spectrum before. Finally, we averaged the individual spectra for each star performing a straight mean, without any weighting. The individual exposures were, in fact, comparable to each other, as deduced from the signal-to-noise ratio (S/N) information in the Keck archive.
Even with these co-additions, the resulting noise levels in the spectra are large. We estimated S/Ns in the 6100−6200 Å spectral region in two ways. First, we searched for small spectral intervals that appeared to have only very weak or absent absorption lines and directly measured the noise levels. Second, we compared synthetic spectra computed for abundance determinations with the spectra for individual stars (see below) and took the standard deviation σ of the residual values as a second indicator of spectrum noise. The means of these two estimates, which were always similar, are given in Table 1. All of the HIRES spectra have S/N < 50. Our values are generally smaller than those published in Boesgaard et al. (2009) and Geisler et al. (2012). This is probably due to different ways of estimating S/N and, for star 7649, to the use of only two of the four spectra.
2.2. Model Atmosphere Parameters and Metallicities
NGC 6791 has been the subject of several general abundance studies; see, e.g., the sources cited in Section 1, and references therein. Our chief interest is in derivation of light element abundances and therefore we did not undertake a new comprehensive model atmosphere analysis. Effective temperatures Teff and surface gravities log g were derived from the cluster photometry.
We adopted V magnitudes, B − V, V − IC colors, and the star numbering system from Stetson et al. (2003). These were input to the relations of Ramírez & Meléndez (2005; who use V − IC) to derive two temperature estimates, which were then averaged to produce the Teff's given in Table 1. Bolometric corrections were computed with relations given by Alonso et al. (1999). For NGC 6791, we assumed a distance modulus (m − M)V = 13.45 and a reddening E(B − V) = 0.15, as we did in Gratton et al. (2006). Differential reddening is a rather common occurrence in OCs. NGC 6791 is not an exception (Platais et al. 2011; Brogaard et al. 2011), but the magnitude of its differential reddening is small. Brogaard et al. (2011) published their photometry and differential reddening corrections, from which we could identify the targets. Figure 2 shows that the estimated correction is never large for the cluster and is confined to ±0.02 mag for our targets. Since we have not applied this correction, our temperatures might be wrong by about 20–30 K for an individual star. This would imply differences in the derived abundances of less than about 0.01 dex.

Figure 2. Upper panel: map of differential reddening (Brogaard et al. 2011) with our targets indicated. Darker and lighter gray indicate negative and positive differential reddening (ΔE(B − V) < 0 and >0), respectively. Our target stars from both HIRES and Hydra samples are indicated with red circles. Lower panel: histograms of the differential reddening values for the entire sample (gray, filled) and for our targets (open, red). For ease of comparison, the individual histograms are individually normalized to yield approximately the same vertical extents.
Download figure:
Standard image High-resolution imageWe also assumed a mass of M = 1.1 M☉ for all stars. Brogaard et al. (2012) determined the mass of stars on the lower RGB of NGC 6791 using several eclipsing binary systems; they found 1.15 ± 0.02 M☉, in very good agreement with our choice. NGC 6791 was observed by the Kepler satellite and masses were derived from asteroseismology of evolved stars (1.20 ± 0.01 M☉, Basu et al. 2011). These values are all consistent, considering the uncertainties and the systematics involved in the derivation of masses through photometry and stellar evolutionary models, eclipsing binary systems, and asteroseismology. The fact that we adopted a single mass value for all our targets is not critical for the analysis; stars at the MSTO and on the RGB have very similar masses in a cluster about 8 Gyr old. Furthermore, Miglio et al. (2012) found from Kepler data that stars on the RC and the RGB have only a small difference in mass (about 0.1 M☉), further supporting our choice of a single mass value for all stars. The average Kepler gravities are larger than ours by about 0.07 dex (see, e.g., Stello et al. 2011, and A. Miglio 2010, private communication), but this offset has a completely negligible effect on the abundance derivations.
The temperatures, magnitudes, reddenings, bolometric corrections, distance modulus, and mass were then combined in the standard L − Teff − M relationship to yield the gravities listed in Table 1. Model atmospheres with these parameters were generated by interpolation in the Kurucz (2009)10 grid using software developed by Andy McWilliam and Inese Ivans.
As a check on the model atmospheres, we measured some lines of Ca i, Fe i, Fe ii, and Ni i in the list of Gratton et al. (2003) on the HIRES spectra (see Gratton et al. 2006 for the gf values of iron lines) and derived abundances of these elements for each star. The line parameters given by Gratton et al. were adopted without change in order to be consistent with previous cluster abundance studies by our group. We used software developed by Fitzpatrick & Sneden (1987) to measure equivalent widths (EWs) and used the line analysis and synthetic spectrum package MOOG (Sneden 1973).11 Almost all of the measured lines are saturated to some extent in the very metal-rich NGC 6791 cluster, and we have no independent way to assess microturbulent velocities. Therefore, we adopted the gravity-dependent microturbulent velocity relation recommended by Gratton et al. (1996): ξt = −0.322 × log g + 2.22. The ξt values are entered into Table 1. For the three RGB stars, ξt ≃ 1.4 km s-1, while for all of the higher-gravity stars ξt ≃ 1.0 km s-1. See Gratton et al. (2006) for a more detailed discussion of the microturbulence issue in NGC 6791.
With our adopted values of Teff, log g, and ξt, we derived consistent Fe abundances for all 15 stars of the Keck sample. Averaging the abundances of Fe i and Fe ii, we found 〈log  (Fe)〉 = 7.88 (σ = 0.06, 6−7 lines in each star) for the Keck sample or [Fe/H] = +0.37 dex using the solar Fe abundance derived by Gratton et al. (2003), i.e., 7.54. For the other elements, we derived 〈log (Ca)〉 = 6.59 (σ = 0.12, 5−6 lines) or [Ca/H] = +0.32; and 〈log (Ni)〉 = 6.73 (σ = 0.07, 5−6 lines) or [Ni/H] = +0.45. Our [Fe/H] value is 0.10 lower than that derived by Carretta et al. (2007), but our [Ca/H] and [Ni/H] values are very consistent with the earlier study. This is satisfactory agreement, given that the lines employed here are not optimal for the very strong-lined spectra of NGC 6791 stars.
2.3. Abundances of C, N, O, and Na
Spectral features of C2, CN, and [O i] were used to derive the CNO abundances of the NGC 6791 HIRES sample. Details on the transitions will be given in subsequent paragraphs. Molecular CO formation ties the C, N, and O abundances together in cool stars, and one must derive their abundances as a group, especially for RGB stars. Additionally, it is necessary to estimate the CN contamination of the [O i] feature prior to extracting an O abundance. Therefore, we iteratively derived the CNO abundances in the following manner. First, an initial [O/Fe] = 0 was assumed, and a preliminary C abundance was estimated from C2 features. Then, a preliminary N abundance was set from the CN strengths in the 6290−6310 Å region. A new O abundance was derived from the 6300.3 Å line. The process was repeated, this time expanding the number of the CN features to include several more spectral regions until satisfactory consistency was achieved between C2, CN, and [O i] features.
Carbon. We derived C abundances from the C2 Swan system (d3Π − a3Π) 0–1 bandhead near 5635 Å. The C2 bands are very weak but always detectable on our spectra. The synthetic spectrum line lists were generated beginning with new laboratory line data from Brooke et al. (2013a) and Ram et al. (2014). To the C2 lines, we added atomic lines from the Kurucz (2009)12 compendium. Empirical corrections to the transition probabilities of the atomic lines were then made through synthetic/observed spectrum matches to the spectrum of Arcturus. We adopted a model atmosphere for this star with parameters recommended by Peterson et al. (1993): Teff = 4300 K, log g = 1.50, ξt = 1.7 km s-1, and [M/H] = −0.5 dex. With this model and the line list, we generated synthetic spectra that were then convolved with a Gaussian smoothing function and matched to the electronic version of the Arcturus spectral atlas (Hinkle et al. 2000).13 Alterations to the log gf values in the line list were made until satisfactory observed/synthesized matches were obtained.
We then applied this line list and the NGC 6791 model atmospheres described above to generate synthetic spectra, which were smoothed with Gaussian functions to match the broadening of the NGC 6791 HIRES data. The C abundances were estimated from synthetic/observed spectrum matches. We show C2 bandhead syntheses and observations for two stars in Figure 3. These stars have been chosen for their contrasting CMD positions. Panel (a) shows the SGB star 15592 (Teff = 5675 K, log g = 4.10) and panel (b) shows the RGB star 7347 (Teff = 4445 K, log g = 2.55). The HIRES spectra are of modest S/N but the C2 bandheads are clearly present in these and all but one other program star. We did not attempt to derive a C abundance for star 5796, as its spectrum is of very low quality near 5630 Å. For the rest of the sample, the final C abundances are given in Table 3. We have previously cautioned about the influence of CO formation on abundances of C and O. However, CO formation is small for the eight stars with Teff > 5000 K. As an example, molecular equilibrium computations done for star 5744 (Teff = 5365 K) as part of the CNO abundance computations indicate number density ratios that n(C or O)/n(CO) > 50 in line-forming regions (τ ∼ 0.5). These ratios are even larger for the warmer SGB and MSTO stars of NGC 6791; C is completely decoupled from O. Discussion of C in the RGB stars will be given below.

Figure 3. Observed HIRES and synthetic C2 Swan system 0−1 bandhead for two NGC 6791 stars. In panel (a), the warm subgiant star 15592 is displayed and in panel (b), the RGB star 7347 is shown. The points represent the observed spectra and the abundances of the four synthetic spectra are identified in the figure legend. The "best" C2 means that C abundance that best matches the observed C2 bandhead.
Download figure:
Standard image High-resolution imageTable 3. Abundances for the HIRES and Hydra Stars
| Star | Fe | C | N | O | Ca | Ni | Na | Na | (Fe/H) | (C/Fe) | (N/Fe) | (O/Fe) | (Ca/Fe) | (Ni/Fe) | (Na/Fe) | (Na/Fe) |
|---|---|---|---|---|---|---|---|---|---|---|---|---|---|---|---|---|
| LTE | NLTE | LTE | NLTE | |||||||||||||
| Keck stars | ||||||||||||||||
| 5744 | 7.91 | 8.88 | ... | 8.99 | 6.66 | 6.80 | 6.83 | 6.74 | 0.37 | −0.01 | ... | −0.17 | 0.04 | 0.15 | 0.25 | 0.16 |
| 7649 | 7.96 | ... | ... | ... | 6.89 | 6.90 | 6.73 | 6.64 | 0.42 | ... | ... | ... | 0.22 | 0.20 | 0.10 | 0.01 |
| 11220 | 7.76 | 8.83 | ... | 9.09 | 6.48 | 6.74 | 6.68 | 6.59 | 0.22 | 0.11 | ... | 0.08 | 0.01 | 0.24 | 0.25 | 0.16 |
| 12181 | 7.93 | 8.88 | ... | ... | 6.61 | 6.77 | 6.68 | 6.59 | 0.39 | −0.02 | ... | ... | −0.03 | 0.10 | 0.08 | −0.01 |
| 13334 | 7.92 | 8.83 | ... | 9.09 | 6.60 | 6.65 | 6.76 | 6.67 | 0.38 | −0.05 | ... | −0.08 | −0.03 | −0.01 | 0.17 | 0.08 |
| 13352 | 7.91 | 8.95 | ... | ... | 6.75 | 6.72 | 6.73 | 6.63 | 0.37 | 0.08 | ... | ... | 0.13 | 0.07 | 0.15 | 0.05 |
| 14416 | 7.90 | 8.90 | ... | 8.89 | 6.66 | 6.65 | 6.73 | 6.64 | 0.36 | 0.04 | ... | −0.26 | 0.05 | 0.01 | 0.16 | 0.07 |
| 15592 | 7.89 | 8.90 | ... | 9.09 | 6.67 | 6.69 | 6.78 | 6.69 | 0.35 | 0.05 | ... | −0.05 | 0.07 | 0.06 | 0.22 | 0.13 |
| 9609 | 7.79 | 8.88 | 8.32 | 9.14 | 6.48 | 6.74 | 6.83 | 6.73 | 0.25 | 0.13 | 0.13 | 0.10 | −0.02 | 0.21 | 0.37 | 0.27 |
| 11014 | 7.80 | 8.83 | 8.36 | 8.94 | 6.54 | 6.80 | 6.76 | 6.67 | 0.26 | 0.07 | 0.18 | −0.11 | 0.03 | 0.26 | 0.29 | 0.20 |
| 11092 | 7.82 | 8.78 | 8.3 | 8.89 | 6.50 | 6.74 | 6.86 | 6.77 | 0.28 | 0.00 | 0.10 | −0.18 | −0.03 | 0.18 | 0.37 | 0.28 |
| 12382 | 7.92 | 8.91 | 8.29 | 9.09 | 6.43 | 6.71 | 6.81 | 6.72 | 0.38 | 0.03 | −0.01 | −0.08 | −0.20 | 0.05 | 0.22 | 0.13 |
| 5796 | 7.80 | 8.73 | 8.46 | 8.99 | 6.59 | 6.73 | 6.91 | 6.80 | 0.26 | −0.03 | 0.28 | −0.06 | 0.08 | 0.19 | 0.44 | 0.33 |
| 7347 | 7.86 | 8.75 | 8.41 | 8.94 | 6.51 | 6.61 | 6.83 | 6.72 | 0.32 | −0.07 | 0.17 | −0.17 | −0.06 | 0.01 | 0.30 | 0.19 |
| 8351 | 7.90 | 8.70 | 8.36 | 8.89 | 6.54 | 6.74 | 6.78 | 6.65 | 0.36 | −0.16 | 0.08 | −0.26 | −0.07 | 0.10 | 0.21 | 0.08 |
| Hydra stars | ||||||||||||||||
| 2309 | ... | ... | ... | ... | 6.59 | ... | 6.81 | 6.66 | +0.4 | ... | ... | ... | −0.14 | ... | 0.20 | 0.05 |
| 3712 | ... | ... | ... | ... | 6.62 | ... | 6.86 | 6.74 | +0.4 | ... | ... | ... | −0.06 | ... | 0.25 | 0.13 |
| 4482 | ... | ... | ... | ... | 6.75 | ... | 6.78 | 6.68 | +0.4 | ... | ... | ... | 0.11 | ... | 0.17 | 0.07 |
| 5454 | ... | ... | ... | ... | 6.59 | ... | 6.78 | 6.60 | +0.4 | ... | ... | ... | −0.10 | ... | 0.17 | −0.01 |
| 5706 | ... | ... | ... | ... | 6.62 | ... | 7.01 | 6.90 | +0.4 | ... | ... | ... | −0.04 | ... | 0.40 | 0.29 |
| 6288 | ... | ... | ... | ... | 6.49 | ... | 6.81 | 6.66 | +0.4 | ... | ... | ... | −0.06 | ... | 0.20 | 0.05 |
| 6940 | ... | ... | ... | ... | 6.62 | ... | 6.81 | 6.69 | +0.4 | ... | ... | ... | −0.08 | ... | 0.20 | 0.08 |
| 7347 | ... | ... | ... | ... | 6.78 | ... | 6.93 | 6.82 | +0.4 | ... | ... | ... | −0.08 | ... | 0.32 | 0.21 |
| 7540 | ... | ... | ... | ... | 6.67 | ... | 7.08 | 6.93 | +0.4 | ... | ... | ... | −0.04 | ... | 0.47 | 0.32 |
| 7912 | ... | ... | ... | ... | 6.75 | ... | 7.01 | 6.88 | +0.4 | ... | ... | ... | −0.01 | ... | 0.40 | 0.27 |
| 8395 | ... | ... | ... | ... | 6.60 | ... | 6.56 | 6.44 | +0.4 | ... | ... | ... | −0.11 | ... | −0.05 | −0.17 |
| 8481 | ... | ... | ... | ... | ... | ... | ... | ... | +0.4 | ... | ... | ... | ... | ... | ... | ... |
| 9462 | ... | ... | ... | ... | 6.60 | ... | 6.88 | 6.76 | +0.4 | ... | ... | ... | −0.11 | ... | 0.27 | 0.15 |
| 9786 | ... | ... | ... | ... | 6.63 | ... | 6.91 | 6.79 | +0.4 | ... | ... | ... | −0.04 | ... | 0.30 | 0.18 |
| 10695 | ... | ... | ... | ... | 6.62 | ... | 6.76 | 6.64 | +0.4 | ... | ... | ... | −0.09 | ... | 0.15 | 0.03 |
| 10806 | ... | ... | ... | ... | 6.62 | ... | 6.81 | 6.68 | +0.4 | ... | ... | ... | −0.09 | ... | 0.20 | 0.07 |
| 10898 | ... | ... | ... | ... | 6.59 | ... | 6.76 | 6.59 | +0.4 | ... | ... | ... | −0.15 | ... | 0.15 | −0.02 |
| 11814 | ... | ... | ... | ... | 6.54 | ... | 6.81 | 6.61 | +0.4 | ... | ... | ... | −0.19 | ... | 0.20 | 0.00 |
| 11938 | ... | ... | ... | ... | 6.69 | ... | 6.78 | 6.66 | +0.4 | ... | ... | ... | −0.02 | ... | 0.17 | 0.05 |
| 12333 | ... | ... | ... | ... | 6.72 | ... | 6.78 | 6.66 | +0.4 | ... | ... | ... | −0.02 | ... | 0.17 | 0.05 |
| 12823 | ... | ... | ... | ... | 6.74 | ... | 7.23 | 6.94 | +0.4 | ... | ... | ... | 0.11 | ... | 0.62 | 0.50 |
Notes. Solar values adopted here are: Fe = 7.54, Ca = 6.27, O = 8.79, Ni = 6.28, Na = 6.21 (Gratton et al. 2003); C = 8.52, N = 7.92 (Grevesse & Sauval 1998).
Download table as: ASCIITypeset image
Nitrogen. We attempted to determine N abundances in all program stars. Absorption features of the CN red system (A2Π − X2Σ+) occur throughout the red-infrared spectral domain (λ ≳ 6000 Å) of NGC 6791 stars. A new laboratory study by Brooke et al. (2013b) gives accurate wavelengths, excitation energies, and transition probabilities for the 12CN lines and similar data for 13CN and C15N are provided by Sneden et al. (2014). Beginning with these sources, we constructed atomic and molecular line lists for CN in the manner described above for C2. We examined synthetic/observed spectrum matches of CN-dominated features in three spectral regions: 6100−6200 Å and 6290−6310 Å in all stars, and 7900−7980 Å in six of the coolest program stars. CN absorption is much stronger in the redder spectral region, thus yielding the more reliable N abundances. Unfortunately, no HIRES spectra of this longest-wavelength domain are available in the KOA archives for warmer NGC 6791 stars.
In Figure 4, we show small portions of the spectrum near 6300 and 7910 Å of the RGB star 7347. The N abundances have been altered by large amounts, 0.6 dex, in the three displayed syntheses in order to show clearly the spectral features that are dominated by CN. Inspection of the two figure panels reveals that the CN line strengths are about a factor of two larger in the redder spectral region; CN absorption dominates that from all other species in this domain. We estimated N abundances in multiple small wavelength intervals of the spectral regions named above and averaged the result to give the N abundances reported in Table 3. Happily, the CN features in all spectral regions yield consistent N abundances, with a scatter of ≲0.05 dex from the various estimates that were made. Unfortunately, we cannot report N abundances for any NGC 6791 star with Teff > 5000 K—we have no 7900 Å spectra for any of them and the CN strengths in their 6100−6300 Å spectra are too weak to produce reliable N abundances.
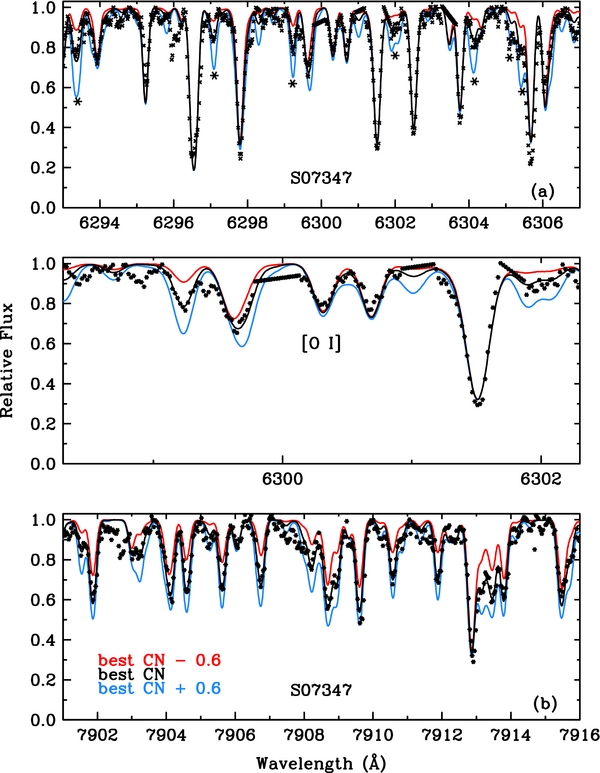
Figure 4. Observed HIRES and synthetic spectra of NGC 6791 RGB star 7347 in small spectral regions surrounding the [O i] 6300.3 Å line (see upper panel and an enlargement in the middle panel) and near 7910 Å. The N abundance has been varied to show the presence of CN lines in the spectrum. Star 7347 is illustrative of all program stars with Teff < 5000 K. In the figure, points represent the observed spectra and the abundances of the three synthetic spectra are identified in the figure legend. Six-pointed stars mark the major CN features. The "best" CN means that N abundance that produces syntheses that best matches the observed CN lines.
Download figure:
Standard image High-resolution image12C/13C. For all but one star, the HIRES wavelength coverage does not extend beyond 7990 Å, thus missing the 13CN transitions that have been the favorite features for decades in deriving carbon isotopic ratios of cool stars (e.g., Day et al. 1973). The RGB star 9609 does have a spectral order containing 8030−8090 Å. We repeated the synthetic/observed spectrum matches in this region for 9609, this time accepting the CNO abundances from other spectral regions but varying the assumed 12C/13C. The 13CN absorption was very weak, yielding only rough isotopic ratios: our analyses suggest that 12C/13C > 15. We were able to rule out very low carbon isotopic ratios in this star. Additionally, we found no evidence for strong 13CN absorption in the 7900 Å spectra of other NGC 6791 RGB stars, although its spectral features are all blended in this region. Typical GC stars exhibit 12C/13C ≃ 3−10 (e.g., Brown & Wallerstein 1989; Suntzeff & Smith 1991; Briley et al. 1994; Shetrone 2003; Pavlenko et al. 2003; Carretta et al. 2005; Valenti et al. 2011). We did not detect large amounts of 13C, but definitive statements on the 12C/13C must await studies specifically targeted to obtain spectra of the best 13CN features.
Oxygen. We derived O abundances from the [O i] 6300.3 Å line. This transition is considered the most reliable O abundance indicator in cool stars, but it is not a simple spectral feature. In addition to the [O i] line at 6300.31 Å, there is a Ni i line at 6300.34 Å and a 12CN red system line at 6300.29 Å. The Ni i has been well-documented (e.g., Allende Prieto et al. 2001; Caffau et al. 2008), and its transition probability has been derived from a laboratory study (Johansson et al. 2003). The CN line (rotational transition R1(14.5) of the 10−5 vibrational band) has been considered far less. It is tabulated in many CN lists (e.g., in the Kurucz 2009 database), but neither its wavelength nor its oscillator strength has been secure in the past. There are many CN red system transitions near 6300 Å as discussed below, but only this particular line can potentially compromise the [O i] feature. Here we used the parameters for this line (wavelength and excitation potential transition probability) given in the new extensive laboratory study by Brooke et al. (2013b) and a CN dissociation energy s0 = 7.6 eV (this value is still uncertain by ≃ ±0.1 eV).
We performed tests with repeated syntheses of the RGB star 7347 to assess the influence of [O i], Ni i and CN on the 6300.3 Å feature in the cooler program stars. The synthetic absorption line that approximates the observed line has EW ≃ 46 mÅ. Using the final abundances for this star and synthesizing the 6300.3 Å components separately, we find EW([O i]) ≃ 38 mÅ, EW(Ni i) ≃ 12 mÅ, and EW(CN) ≃ 5 mÅ. Incipient saturation of the total feature makes its EW less than the sum of its three individual components. Thus the CN contamination is somewhat more than 10%, but the Ni i contamination is about 30%. The influence of the Ni transition at 6300.3 Å cannot be neglected even in the RGB spectra of NGC 6791.
In Table 3, we give the final O abundance estimates for the HIRES RGB sample. The [O i] line are very weak in the warmer MSTO and SGB stars and on average, the spectroscopic S/N values of these fainter stars are too low to permit reliable O abundance determinations, so the reader should take also the measured values with caution.
Sodium. We derived Na abundances from the Na i 6154.23, 6160.75 Å doublet via spectrum synthesis due to the general line crowding surrounding these otherwise simple transitions. The mean Na abundances from these lines are entered in Table 3. In panels (a) and (b) of Figure 5, we show synthetic and observed spectra of the two Na i lines and several Ca i lines in the NGC 6791 subgiant star 15592, and in panels (c) and (d), we show these spectral features in the RGB star 7347. Inspection of this figure makes it clear that while the cooler RGB star has a much stronger-lined spectrum than does the warmer SGB star, the Na i and Ca i features are saturated in both stars. Both Na transitions also have small amounts of blending by lines of other species, particularly the 6160 Å line, which has two strong Ca features to the red of it. However, our derived abundances from the Na lines are in accord: 〈log (6160) − log (6154)〉 = +0.02 (σ = 0.09). The fairly large star-to-star scatter in this difference emphasizes the utility in deriving Na abundances from both lines.

Figure 5. Observed HIRES and synthetic spectra of two NGC 6791 stars in the spectral regions surrounding Na i 6154 and 6160 Å and nearby Ca i lines. The observed spectra are shown as black points. As in Figure 3, the warm subgiant star 15592 is shown in panels (a) and (b) and the RGB star 7347 is shown in panels (c) and (d). The assumed Na and Ca abundances in the syntheses differ by 0.5 dex (as written in the figure legend) in order to clearly show the abundance effects on the displayed transitions. In the figure, points represent the observed spectra.
Download figure:
Standard image High-resolution imageThe neutral Na species is subject to departures from LTE; see, e.g., Lind et al. (2011) for a recent evaluation. Had we only stars of similar evolutionary status in our sample, we could avoid corrections for NLTE entirely and work only differentially. For the 6154, 6160 Å doublet the NLTE corrections are quite small but slightly different for the various temperatures/evolutionary phases we are sampling. Therefore we applied the Lind et al. (2011) NLTE corrections for all our stars, computing these values at the web site14 of the INSPECT project. The corrections vary from about −0.09 dex for the warmer MSTO stars to about −0.20 dex for the coolest RGB stars. A large fraction of the stars observed with HIRES and Hydra (Section 3) are RC and RGB stars near the RC luminosity level; for these stars, the NLTE corrections are about −0.12 dex. Even though the shifts from LTE to NLTE abundances are not large, we take them into account to mute spurious Na abundance trends with Teff or log g (see Section 4). We list both LTE and NLTE abundances of Na in Table 3.
2.4. Abundance Uncertainties
Estimates of uncertainties in the abundances began with goodness-of-fit trials in matching observed to synthesized spectra. For single spectral features, such as the difficult [O i] transition, the uncertainties could be as large as 0.1 dex, due to the high noise level of the HIRES spectra. These uncertainties decreased as the number of transitions grew (two for Na i, up to six for Ca i, many for C2 and CN). Likely uncertainties in atmospheric parameters of NGC 6791 stars are ±150 K in Teff, ±0.2 in log g, ±0.2 km s-1 in ξt, and ±0.1 dex in [Fe/H]. For [O i], these ΔTeff, Δlog g, Δξt, Δ[Fe/H] excursions lead to Δ log (O) values of ±0.03, ±0.12, ±0.00, ∓0.03, respectively. For Na i, these abundance uncertainties are ±0.07, ∓0.02, ∓0.08, and ±0.02. The response of C2 and CN to parameter changes is more complex due to CO competition in the lower-temperature stars. In the coolest RGB stars, increasing Teff by 150 K yields smaller C and N abundances by ∼0.10 dex because lessened CO formation leaves more free C and N atoms to form C2 and CN. For the MSTO stars, CO formation is very small, so the same Teff increase creates fewer C2 and CN molecules, raising the C and N abundances by ∼0.10 dex. Increasing log g by 0.2 dex has no effect on C and N abundances in the warmer stars and increases them by ∼0.05 dex in the cooler ones. There is little dependence of C2 and CN formation on changes in ξt or [Fe/H]. There is a relatively smooth transition between these extreme Teff and log g cases. The model parameter uncertainties, if viewed as independent variables, lead to "external" abundance uncertainties of about ±0.15 dex. Thus microturbulent velocity choice is a significant problem in deriving reliable Na abundances in NGC 6791 stars. However, in a given region of the CMD all stars will respond to parameter variations in the same way and measurement scatter will be the dominant uncertainty source.
3. N, NA, AND CA ABUNDANCES FROM HYDRA SPECTRA
To obtain light element abundances for a larger set of NGC 6791 stars, we employed the Hydra multifiber spectrograph operating at the WIYN telescope on Kitt Peak. Although we experienced inclement weather on our two-night observing run, we obtained enough data to derive Na and Ca abundances and set boundaries on N for 21 cluster members (one in common with the HIRES sample).
3.1. The Hydra Data Set
To select suitable NGC 6791 targets, we began with the recent cluster membership survey (Platais et al. 2011) based on proper motions, data for which was kindly provided to us by Kyle Cudworth in advance of publication. We again adopted the star numbering system and photometry of Stetson et al. (2003). The proper motions and published radial velocities (RVs) were combined to identify stars that have high cluster membership probabilities and are bright enough (V < 16) for the high spectroscopic resolution mode of Hydra. Photometric BV magnitudes from Stetson et al. and K magnitudes from the 2MASS catalog (Skrutskie et al. 2006) are given in Table 2. We also list RVs for the targets derived from our spectra (which are used to help refine cluster membership probabilities) and note stars in common with previous high-resolution spectroscopic studies. Those prior investigations include Carraro et al. (2006), Geisler et al. (2012), and Carretta et al. (2007, who analyzed the same stars of Gratton et al. 2006). We have no stars in common with Peterson & Green (1998) and Origlia et al. (2006). Further discussion of the RVs is given below.
We gathered data for these stars with the upgraded Hydra, a multifiber spectrograph operating at the WIYN telescope on Kitt Peak. We used grating 316@63.4 to obtain spectra near the Na i 6154, 6160 Å doublet and the [O i] 6300 Å line. The wavelength coverage was 6100–6400 Å, with a resolving power R ≡ λ/Δλ ≃ 20, 000. We put 26 fibers on target stars and 60 on sky positions. We observed on UT 2009 June 6–7, but only the first night produced usable data. Even on that night, the sky conditions ranged from mostly clear to very cloudy. This had a direct impact on the quality of our spectra, with final S/N values (see below) S/N ≲ 40. The total exposure time was 4.5 hr, divided in 6 exposures of 2700 s each. We also observed a bright standard star (η UMa) that was later used to cancel the telluric O2 and H2O lines from the stellar spectra.
The majority of data reduction tasks were accomplished with standard IRAF15 routines. Corrections for bias, zero level, and flat field were applied to the individual frames. We then stacked up all the two-dimensional frames and extracted the one-dimensional (1D) spectra. We had to discard one of the targets because its spectrum signal was too weak even in the stacked frame. We averaged the sky fibers and subtracted the 1D average sky from the star spectra. Wavelength calibration was performed using Th–Ar lamp exposures. Division by a properly scaled standard star was used to eliminate the telluric lines.
We measured RVs using about 40 lines with the rvidlines routine in IRAF. Individual heliocentric RVs and associated uncertainties are given in Table 2; typical errors are ≃0.5 km s-1. The identification of obvious non-members was straightforward, with three stars clearly not belonging to the cluster. One more star (6288) has RV = −55.3 km s-1, which is 6σ away from the average cluster velocity as defined by the other 21 stars (〈RV〉 = −46.3 km s-1, rms = 1.5 km s-1). This star may be a non-member, but its spectrum is fully compatible with the same very high metallicity of the cluster stars, a value unusual for a field star. Furthermore, it is included in the sample of cluster stars in Geisler et al. (2012), who do not, however, publish RV values. Possibly it is a binary, but we have no way to confirm it. We decided to keep 6288 among the cluster members. We had to exclude one further object (star 5796) from the analysis because the spectrum was of too poor quality; this star however is part of the HIRES sample discussed in Section 2. We were then left with a sample of 21 stars, one of which was also observed with HIRES (star 7347, see Table 2).
Table 2 lists S/N estimates for each star. There are no extended continuum regions in our line-rich spectra to allow easy noise estimation, so we computed S/N in two ways for each star. First, we multiplied the count rates in the final spectra by the Hydra CCD gain to produce a total electron signal estimate, and used the square root of the high points in these counts as one value of S/N. Second, we produced a high S/N mean spectrum of 10 RC stars16 and subtracted that mean spectrum from those of the individual stars. In most cases, this resulted in reasonably clean "noise" spectra from which we then computed S/N. In general, the two S/N estimates correlated well. Each method has its own limitations, and so we simply averaged the two values for each star. These are the numbers reported in Table 2.
Figure 1 identifies the Hydra targets on the CMD of the cluster. We concentrated on RGB and RC stars but put also a few fibers on other possibly interesting objects. In particular, following the studies by Peterson & Green (1998), who observed one possible horizontal branch (HB) star and by Liebert et al. (1994), who demonstrated that the extreme blue HB stars are members, we tried to find other HB stars. However, none of them has an RV compatible with being part of NGC 6791. On the other hand, the candidate blue straggler (BSS) star 8481 seems to be a true member. Note also that since we began our study, the possible HB star studied by Peterson & Green (1998) has been convincingly classified as a BSS by Brogaard et al. (2012).
3.2. Atmospheric Parameters and Metallicity for the Hydra Sample
The spectral resolution, S/N, and wavelength range values of our Hydra spectra are of course less favorable than those of the HIRES spectra. The Hydra spectra lack the wavelength coverage and resolution to allow reliable simultaneous determination of Teff, log g, [M/H], and ξt for NGC 6791 giants. Assessment of especially log g cannot be accomplished with our data due to the lack of strong first-ion species transitions. Additionally, there is a degeneracy between Teff and ξt changes; variations in these two parameters cannot easily be disentangled.
Therefore, following our procedures for the HIRES data (Section 2), we derived temperatures and gravities for the Hydra stars from their photometry. With these two parameters fixed for the stars, we estimated values of [M/H] and ξt from our Hydra data through minimization of the difference (O − C) between the observed and synthetic spectra. To accomplish this task, as in Section 2.3, we first created a line list for the entire 6090−6400 Å wavelength range of our spectra, beginning with the new CN line lists of Brooke et al. (2013b) and Sneden et al. (2014). To these we added atomic lines from the Kurucz (2009) line compendium and adjusted their transition probabilities to best match the spectra of Arcturus.
We then applied this line list to the NGC 6791 program stars. Because of the modest S/N and R values of the Hydra spectra, the only species of the CNO element group that could be reliably detected was CN. The [O i] line was present but it proved to be very difficult to analyze; we will comment more on this problem in Section 3.3. All of our Hydra sample are RGB and RC stars except star 8481, which is a BSS (see Figure 1) and which was not analyzed. We therefore initially adopted the mean of the CNO abundances derived for the three RGB stars (5796, 7347, and 8351) observed with HIRES: log (C) = 8.73, log (N) = 8.36, and log (O) = 8.94 (σ ≃ 0.05 for each of these values; Table 3).
Then we generated grids of synthetic spectra for metallicities [M/H] = −0.2, +0.1, +0.4, +0.7, +1.0 (where "M" essentially means Fe and other Fe-peak elements) and microturbulent velocities ξt = 1.00, 1.25, 1.50, 1.75, 2.00 km s−1. After these spectra were smoothed to account for (mainly) the spectrograph slit function, they were compared to the observed spectra. Arrays of O − C differences were computed, and simple standard deviations (σ) were used to assess the quality of fit. We used the σ minima to determine best values for [M/H] and ξt. This method permitted estimation of both parameters simultaneously. However, we again emphasize that the derived [M/H] depends substantially on ξt for these high-metallicity stars because many NGC 6791 lines on our spectra are saturated. Not surprisingly, the σ values had broad minima for each star.
In an attempt to more sharply define typical properties for our program stars, we also estimated [M/H] and ξt for the 10 star RC mean spectrum described in Section 3.1. The RC stars have very similar photometric parameters and hence have nearly indistinguishable Teff and log g values. We adopted Teff = 4545 K and log g = 2.40 for this NGC 6791 average RC spectrum and repeated the synthetic/observed spectrum matches described above. The resulting σ(O − C) values converged to a minimum with parameters [M/H] = +0.40 ± 0.15 and ξt = 1.30 ± 0.15 km s−1. These metallicity and microturbulence results were very consistent the HIRES-based values determined in Section 2 and with previous studies of NGC 6791 stars (Peterson & Green 1998; Worthey & Jowett 2003; Carraro et al. 2006; Gratton et al. 2006; Origlia et al. 2006; Carretta et al. 2007; Boesgaard et al. 2009; Geisler et al. 2012).
We tried other numerical experiments that could possibly help to define the metallicities and microturbulent velocities of our stars. In particular, we isolated several small spectral regions that contained mostly Fe i lines, and did O − C comparisons with only Fe abundance variations. The results were little different than those from consideration of the entire spectral domain and variations in all elements, nor did variations in the synthetic spectrum smoothing function produce substantial changes in the overall results. In the end, for all Hydra stars, we chose to adopt the ξt(log g) relationship used for the HIRES sample (Section 2.2) and a fixed metallicity [M/H] = +0.4.
3.3. Light Elements Abundances from the Hydra Spectra
We computed synthetic spectra with variations in N, Na, and Ca abundances while keeping C and O abundances fixed and setting and all other abundances at [X/H] = +0.4. Synthetic spectrum line lists were constructed in the same manner as others described previously. As illustrated in Figure 6, the two Na i and four Ca i lines, and many CN features can easily be seen; the major problems are line crowding and the modest S/N of even the best of our Hydra NGC 6791 spectra.

Figure 6. Observed Hydra and synthetic spectra of NGC 6791 RGB star 8395 in two small spectral intervals. Panel (a) shows the region containing the two Na i lines and four of the six Ca i lines that were used to assess Ca abundances with the Hydra spectra. Panel (b) shows one of the several regions that have substantial CN contribution to the total absorption. As in previous figures, the observed points are indicated with black points, and the synthetic spectra are drawn with color-coded lines that have the abundances that are explained in the figure legends.
Download figure:
Standard image High-resolution imageThe syntheses of multiple regions rich in CN lines strongly suggest that if C and O have no large star-to-star variations, then N is also relatively constant. We do not list N abundances in Table 3 because of their severe dependence on the other two light elements. If our adopted C and O abundances given in Section 3.2 are essentially correct for all RGB stars, then we derive a mean abundance 〈log (N)〉 = 8.30 (σ = 0.05, 15 stars). This value is very close to the mean N abundance (8.36) derived for the three HIRES giants. What is more clear is that we detect no substantial star-to-star variations in CN strengths beyond those changes induced by variations in Teff and log g among NGC 6791 giants. There are no obvious CN-weak or CN-strong stars in our Hydra sample.
For the HIRES stars, we derived Na abundances from synthetic spectrum computations for the Na i 6154.2 and 6160.8 Å lines, and Ca abundances from the Ca i lines at 6102.7, 6122.2, 6161.3, 6162.2, 6169.0, and 6169.6 Å. NLTE corrections were applied to the Hydra Na abundances as was done for the HIRES sample. Simple means of these line abundances were computed and those are listed in Table 3. Slightly larger abundances were derived for the longer-wavelength Na i line: 〈log (6160) − log (6154)〉 = +0.07 (σ = 0.04). We attribute this difference to the difficulty in separating the absorption of the 6160 Å from its Ca i near neighbors.
Unfortunately, our WIYN observing run occurred on non-optimum dates, producing a geocentric RV for the cluster that contaminates the weak stellar [O i] line with a telluric O2 feature. Beyond this problem and the stellar contamination by CN and Ni i features coincident with the [O i] line, there is also substantial blending with the neighboring Sc ii line at 6300.68 Å at the Hydra effective resolution. For all of these reasons, it was not possible to derive a reliable measure of the O abundance from the Hydra spectra. However, the [O i] features are very similar in strength in all program stars.
For the star 7347, in common between the two samples, the difference in Na and Ca are +0.1, −0.27 dex, respectively. However, comparing the elemental abundances from the two data sets, for Ca we get 〈log (Hydra)〉 − 〈log (HIRES)〉 = +0.01 and +0.05 if only the three RGB stars from HIRES are included in its mean. For Na, the difference is 〈log (Hydra)〉 − 〈log (HIRES)〉 = +0.08 and +0.02 considering only the HIRES RGB stars. These abundance means are obviously in agreement with one another.
3.4. Comparison with Other Studies
NGC 6791 has been the subject of several high-resolution spectroscopic analyses (Peterson & Green 1998; Gratton et al. 2006; Carraro et al. 2006; Origlia et al. 2006; Carretta et al. 2007; Boesgaard et al. 2009; Geisler et al. 2012; Frinchaboy et al. 2013). All these papers concur with our determination of a very high metallicity. The range in reported metallicities, [Fe/H] = +0.3 to +0.5, is larger than optimal but it is consistent with observational/analytical uncertainties. The study-to-study variation in individual abundances indicates that uncertainties of about 0.1 dex remain for all abundance ratios in NGC 6791.
We have stars in common with all of the previous optical studies (see the notes in Table 2) except for Peterson & Green (1998); we do not have any in common with the IR study by Origlia et al. (2006) and have not checked the APOGEE spectra, since only average values are presented in Frinchaboy et al. (2013). In two cases, we have analyzed the same HIRES spectra (Boesgaard et al. 2009; Geisler et al. 2012). Figure 7 shows comparisons between our values for Teff, log g, [Fe/H], and Na abundance and the published ones.

Figure 7. Comparison between our results and literature values for temperature, gravity, metallicity, and Na abundance (LTE case). As identified in the legend of panel (a), red open squares are used for the results of Geisler et al. (2012, G12), blue open triangles for Carraro et al. (2006, C06), cyan stars (G06) for Gratton et al. (2006) and Carretta et al. (2007), and green circles for Boesgaard et al. (2009, B09). In panel (b), magenta diamonds are added for Stello et al. (2011, Kepler). We plot log (Na) and not [Na/Fe] in order to isolate the effect of Na variation from differences in Fe.
Download figure:
Standard image High-resolution imageOur temperatures are very close to the ones in Gratton et al. (2006) for two RC stars and hotter by about 100 K than those in Carraro et al. (2006) and Geisler et al. (2012); see Figure 7(a). In all these cases, temperatures were derived from photometry and we consider them to agree well, given the different colors used. The larger discrepancy is found for the two MSTO stars in Boesgaard et al. (2009), who derived Teff spectroscopically. The gravities that are compared in panel (b) of the figure are very similar for the stars in common with Gratton et al. (2006) and Geisler et al. (2012) and, as already noted in Section 2.2, the differences with asteroseismological results are small. For all these stars, the agreement is excellent. Again, there is a larger offset with Boesgaard et al. (2009), who derived gravities from ionization equilibria and, more inexplicably, with Carraro et al. (2006).
The derived metallicities are also in reasonable agreement with differences below about ±0.1 dex, as illustrated in Figure 7(c). However, the lower metallicity obtained by Boesgaard et al. (2009) for the two MSTO stars is difficult to understand; we would have expected an abundance slightly larger than ours, considering the sensitivity of metallicity to changes in Teff, log g, and ξt.
Finally, in Figure 7(d), we compare our LTE Na abundances with those in the literature. We use here the LTE values since those are available for all papers. We find that our Na abundances differ by no more than about ±0.2 dex from literature values without trends with gravity (see Figure 7) or temperature.
4. DISCUSSION
Some photometric studies of NGC 6791 have suggested that this is an unusual OC. In particular, it hosts blue HB stars (the only case in an OC, see, e.g., Kaluzny & Rucinski 1995; Buzzoni et al. 2012) and its RGB seems broad in color. Recently, Twarog et al. (2011) raised the idea of a spread in age of about 1 Gyr between the inner and outer regions of the cluster, suggested by the different colors of stars near the MSTO. They were cautious and this was presented only as a possible (if preferred) explanation. However, the papers by Platais et al. (2011) and especially Brogaard et al. (2011, 2012), with detailed studies of differential reddening and excellent agreement with results based on several eclipsing binary systems, theoretical stellar models, and asteroseismology, seem to exclude the possibility of an age spread.
A strong indicator of multiple populations in some GCs is the existence of a bimodal distribution of CN and CH beyond what can be explained by evolutionary mixing. The case is strengthened in those GCs with CH/CN bimodality extending into the domain of unevolved MS stars; see, e.g., Cannon et al. (1998), Harbeck et al. (2003), and Pancino et al. (2010). A low-resolution spectroscopic study of 19 red HB members of NGC 6791 was conducted by Hufnagel et al. (1995). They found a likely star-to-star CN band strength spread in their sample, but "no bimodality in CN strength is apparent from the spectra of these stars, unlike the bimodalities among the RHB stars of the two disk GCs 47 Tuc and M71." Carrera (2012), analyzing about 100 Sloan Digital Sky Survey (SDSS) spectra of member stars in NGC 6791 of different evolutionary phases (main sequence, RGB, and RC), found a significant spread in the strength of the CN band (only the 3839 Å, not the 4142 Å band), but only a hint of bimodality. On the other hand, Boberg et al. (2014), also using SDSS spectra, seem to reach a different conclusion. They do not find evidence to support abundance variations in NGC 6791; however, a full paper with details is not yet available.
Given the lack of definitive indications from CN, we are then left with Na and O abundances as possible indicators of multiple populations, as advocated by Geisler et al. (2012).
4.1. Na Abundances
The LTE and NLTE Na distributions as functions of Teff are presented in Figures 8(a) and (b). The HIRES and Hydra results are distinguished by different symbol colors. Histograms of Na abundance are displayed in panels (c) and (d), both for the whole sample and for the Hydra and HIRES subsamples. The Hydra stars cover a very limited range in temperature (they are essentially concentrated around 4500 K) and exhibit a moderate spread in Na abundance: 〈log 〉 = 6.72 (σ = 0.13, NLTE). The HIRES stars span a large Teff interval, from about 4400 K to 5800 K, and have a slightly lower average Na abundance with a much smaller dispersion: 〈log 〉 = 6.68 (σ = 0.06 dex (NLTE). The HIRES Na abundances also show a trend of Na abundance with Teff, which is only partially removed once NLTE corrections are applied. Interestingly, the mean Na abundance of the three coolest RGB HIRES stars (〈log 〉 = 6.72, σ = 0.02) agrees with the total Hydra mean, while the Na abundance of warmer HIRES stars at the RGB base and MSTO is slightly lower: 〈log 〉 = 6.67 (σ = 0.06).

Figure 8. Na abundances from our HIRES and Hydra spectra. In all panels, red denotes results from Hydra and blue indicates those from HIRES. The upper panels show Na abundances as a function of temperature for the LTE (a) and NLTE (b) cases. Adoption of NLTE corrections from Lind et al. (2011) eliminates only part of the small trend of Na abundance with temperature. The lower panels show the histograms of the Na abundances for the total sample (gray, filled) in addition to the individual histograms of Hydra and HIRES abundances (panels (c) and (d) for LTE and NLTE results, respectively).
Download figure:
Standard image High-resolution imageIn our data (but also in those of Geisler et al. 2012, see Section 4.3), Na seems anticorrelated with temperature, i.e., with evolutionary phase: the less evolved stars have lower Na content. The effect is ≃0.1 dex in NGC 6791 from the MSTO to the RGB. However, an evolutionary effect, with Na brought to the surface by some extra-mixing episode, probably can be excluded. The work by Gratton et al. (2000) showed that O and Na do not change on the RGB, at least for field old and metal-poor stars. Furthermore, recent models by Lagarde et al. (2012) computed for different metallicities, both with standard prescriptions and including thermohaline convection and rotation-induced mixing, do not prescribe any change in Na abundance for masses smaller than about 1.5 M☉, well above those of our stars.
Is the Na abundance anticorrelation with temperature an indication that we are seeing the sign of multiple populations, with Na enhanced but only in some of the stars? If this is the case, it stands in contrast to trends in GCs, where star-to-star variations in Na are seen at any given magnitude (i.e., evolutionary phase) from the MS to the RGB tip. The only known GC where a small evolutionary effect (extra-mixing added to self-pollution) may have occurred is possibly M 13 (Johnson & Pilachowski 2012), but in that cluster, an evolutionary signature is only apparent in the brightest giants.
There are two possible explanations for this trend. First, the Na lines might be affected by blends that are not properly accounted for in our analysis. Since lines are saturated, even weak contaminants may lead to significant errors in the abundances for such metal-rich stars; such contaminants are most likely to be important in cool stars than in hot ones. In addition to the blending with the Ca i lines mentioned in Section 2.3 and 3.1, the Na i lines are also contaminated by CN lines, as illustrated by Figure 6, where CN is responsible for the residual absorption at the wavelength of the Na lines in synthetic spectra computed without Na and Ca contributions. While these contaminants are considered in our analysis, there might be others that we neglected. Second, there might be problems with the 1D model atmospheres in reproducing the Na i lines, especially for the coolest giants. The three-dimensional (3D) models (e.g., Ludwig & Kučinskas 2012) predict steeper temperature gradients than 1D model atmospheres, the difference being larger for giants than for dwarfs, and this could also possibly explain the about 0.1 dex difference we find in Na abundance between the MSTO and RGB/RC.
4.2. O and Na
The most important result of our analysis is that we find no abundance dispersion exceeding the associated errors for Na and O. We also do not see any indication of the presence of a Na–O anticorrelation. In Figure 9, we show a plot of the O and Na abundances derived in this work for NGC 6791. For comparison, we also include the Na and O abundances derived in our FLAMES survey of GCs (Carretta et al. 2009). At variance from the GC data, Na and O abundances seem even to show a slight positive correlation in NGC 6791 (however, the Pearson coefficient is not significant for this sample). The rms scatters of both O and Na are compatible with their associated errors, especially considering the Hydra and HIRES samples separately.

Figure 9. Na (NLTE) and O values for our sample in NGC 6791. These are shown as blue squares and are only from the HIRES sample. Typical error bars are shown on the lower left of the panel. For reference, we show as gray points the Na and O values from our FLAMES survey of GCs (Carretta et al. 2009, G09).
Download figure:
Standard image High-resolution imageThe abundance of Na have been discussed in Section 4.1. The mean O abundance in NGC 6791 ([O/Fe] = −0.2) lies between the values found by Origlia et al. (2006) and Carretta et al. (2007), and is definitely lower than the values for both sub-populations (Na-rich and Na-poor) in Geisler et al. (2012). In absence of any self-pollution like that seen in GCs, a sub-solar ratio is expected for the high metallicity of this OC, see, e.g., Bensby et al. (2004).
However, should have we expected a large effect even under the self-pollution hypothesis? There are observational indications that O variations are smaller for higher-metallicity GCs. Consider in particular the bulge GC NGC 6553. Meléndez et al. (2003) derived an overall metallicity of [Fe/H] = −0.20 and found [O/Fe] = +0.20 (σ = 0.065) for five RGB stars observed in the H band in this cluster. Cohen et al. (1999) studied five red HB stars in NGC 6553, deriving a similar metallicity and higher O abundance ([O/Fe] = +0.50), but with a scatter small enough (σ = 0.13) and comparable to the star-to-star variations found for the other elements that have relatively constant [X/Fe] abundance ratios.
Assume for the moment that the present O and Na abundances reflect the nucleosynthesis contributions of multiple generations. If the original polluters (i.e., the stars that lost the material that produced the second generation of stars) are asymptotic giant branch (AGB) stars, the lack of significant star-to-star O abundance scatter in NGC 6553 and NGC 6791 could be due to the efficiency of the hot bottom burning (HBB) mechanism. At high metallicity, the envelope temperatures are lower, hence the ON cycle is not activated (F. D'Antona 2010, private communication). Indeed, the AGB models by Ventura & D'Antona (2009) have O yields that do not show any depletion at the high-metallicity end. Of course, these models still suffer from many uncertainties and are furthermore computed for metallicities much lower than the one of NGC 6791 (their higher-metallicity model is for Z = 0.004 or [Fe/H] ≃ −0.7), but the trend of the yields with metallicity is clear (see their Table 2).
4.3. Comparison with Geisler et al.'s (2012) Results
In the Geisler et al. (2012) study of NGC 6791, a significant trend of Na abundance with Teff was noted but no explanation was provided. They instead concentrated on the bimodality seen in their abundances. In Figure 10, we contrast our Na abundances with their results. In panel (b), one can see two groups of Na abundances separated by ∼0.5 dex in their results that is obviously not apparent in our data from panel (a). However, trends of Na with Teff are visible in both of their [Na/Fe] subsamples. In Figure 11, we show similar plots but for oxygen. This is less significant, though, since O does not vary a lot in either sample.

Figure 10. Comparison of our results for Na with those of Geisler et al. (2012). The left-hand panels (a) and (c) are repeats of those panels in Figure 8, while right-hand panels are results from Geisler et al. (2012, G12).
Download figure:
Standard image High-resolution image
Figure 11. Comparison of our results for O with those of Geisler et al. (2012); symbols are the same as in the previous figure.
Download figure:
Standard image High-resolution image
We notice that the large differences obtained between our analyses and those of Geisler et al. (2012) cannot be attributed to the atmospheric parameters, which are similar (Section 3.4). We note that the microturbulent velocities they adopt for the stars in the lower RGB are unusually low, but the impact of ξt on Na or O abundance is too small to significantly affect the [Na/Fe] trends. A more promising candidate is the different way we accounted for nearby contaminating lines in the line syntheses, in particular the CN and Ca lines that are quite strongly temperature sensitive. Dr. Sandro Villanova kindly provided us with the list of lines used in their spectral synthesis of the region, including the Na lines. They used different values from those adopted by us; when used in the synthesis, their values produced much weaker contamination for cool stars, while the effect was much smaller for the hot ones.
Finally, while there seems to be a sort of Na–O anticorrelation in Geisler et al. (2012, see their Figure 4), it is different from what found in GCs. First, it seems only present (if at all) for the Na-rich stars. Second, the Na-poor and Na-rich sub-samples seem to have very similar O content. Third, there seems to be a correlation such that Na-rich stars are also O-rich, at variance with the case of GCs. If the effect is real, this may be the manifestation of the different O production in high-metallicity stars (Section 4.2).
5. SUMMARY
We studied possible light abundance anomalies and spreads in NGC 6791, analyzing a sample of 36 MSTO, RGB, and RC stars. About one half of the stars were observed with WIYN/Hydra and one half retrieved from the Keck HIRES archive. This is the largest sample examined up to now in this cluster.
We concentrated on determining abundances of N, O, and Na using spectrum synthesis and EW measurements. We did not find any significant dispersion in O and Na, nor did we find an anticorrelation between them. We did, however, find a small dependence of Na abundance on temperature (i.e., evolutionary status) only partially removed when NLTE corrections are applied.
Based on both the available photometric (from literature data) and spectroscopic (mainly the present work) information, NGC 6791 can still be considered a bona fide OC. In other words, it is a very homogeneous aggregate formed with a different mechanism with respect to the multi-population GCs. However, further observations and maybe a different analysis method (e.g., using 3D model atmospheres) could help in definitely pinning down the cluster's elusive properties.
We thank Kyle Cudworth for his valuable information on membership based on proper motions and Andrea Miglio for providing information on the Kepler targets in advance of publication. We thank Sandro Villanova for having kindly provided us the line list they used in the synthesis of the Na line region and one of their spectra in this same region. The help of the WIYN telescope personnel is acknowledged, as are fruitful discussions with Franca D'Antona. This research has made use of the Keck Observatory Archive (KOA), which is operated by the W. M. Keck Observatory and the Exoplanet Science Institute (NExScI), under contract with the U.S. National Aeronautics and Space Administration (NASA). We acknowledge the use of Keck data obtained by the following PIs: Boesgaard, Bresolin, and Marcy. This research makes use of the SIMBAD database, operated at CDS, Strasbourg, France, of NASA's Astrophysics Data System, and of the WEBDA open cluster database. This publication makes use of data products from the Two Micron All Sky Survey, which is a joint project of the University of Massachusetts and the Infrared Processing and Analysis Center/California Institute of Technology, funded by NASA and the U.S. National Science Foundation (NSF).
This work was supported by PRIN INAF 2011 "Multiple populations in globular clusters: their role in the Galaxy assembly" (PI E. Carretta), by PRIN MIUR 2010–2011 "The chemical and Dynamical Evolution of the Milky Way and Local Group Galaxies (PI F. Matteucci), and by the U.S. NSF under grants AST-0908978 and AST-1211585. The paper was completed while C.S. was on a University of Texas Faculty Research Assignment, in residence at the Department of Astronomy and Space Sciences of Ege University. Financial support from the University of Texas and The Scientific and Technological Research Council of Turkey (TBITAK, project No. 112T929) is greatly appreciated. The research at the University of York has been supported by funds from the Leverhulme Trust (UK). Some funding was also provided by the NASA laboratory astrophysics program.
Facilities: WIYN (Hydra) - Wisconsin-Indiana-Yale-NOAO Telescope, Keck:1 (HIRES) -
Footnotes
- 8
The model proposed by Bastian et al. (2013), based on accretion on low-mass, pre-main-sequence stars from massive stars, does not actually require multiple generations but a large cluster mass is still needed.
- 9
- 10
- 11
Available at http://www.as.utexas.edu/~chris/moog.html.
- 12
- 13
- 14
- 15
IRAF is distributed by the National Optical Astronomy Observatory, which is operated by the Association of Universities for Research in Astronomy, Inc., under cooperative agreement with the National Science Foundation.
- 16
Stars contributing to this average were 3712, 4482, 7540, 7912, 8395, 9462, 10695, 11938, 12333, and 12823; see Section 3.2 for additional use of the RC mean spectrum.