


ABSTRACT
Planets such as 55 Cancri e orbiting stars with a high carbon-to-oxygen ratio may consist primarily of silicon and carbon, with successive layers of carbon, silicon carbide, and iron. The behavior of silicon–carbon materials at the extreme pressures prevalent in planetary interiors, however, has not yet been sufficiently understood. In this work, we use simulations based on density functional theory to determine high-pressure phase transitions in the silicon–carbon system, including the prediction of new stable compounds with Si2C and SiC2 stoichiometry at high pressures. We compute equations of state for these silicon–carbon compounds as a function of pressure, and hence derive interior structural models and mass–radius relationships for planets composed of silicon and carbon. Notably, we predict a substantially smaller radius for SiC planets than in previous models, and find that mass radius relationships for SiC planets are indistinguishable from those of silicate planets. We also compute a new equation of state for iron. We rederive interior models for 55 Cancri e and are able to place more stringent restrictions on its composition.
Export citation and abstract BibTeX RIS
1. INTRODUCTION
The chemical diversity of stars in the universe has been suggested to result in an even greater chemical diversity among the planets which they host. According to condensation models (Bond et al. 2010; Kuchner & Seager 2005), a key variable determining the chemical makeup of planets is the carbon-to-oxygen ratio of the disk. In stellar nebulae with carbon–oxygen ratios in excess of 0.8 (Bond et al. 2010), condensation models propose that solid bodies within the ice line would consist primarily of silicon carbide and carbon rather than the silicate materials of our own solar system, leading to the formation of solid planets consisting of silicon, carbon, and possibly iron with minimal oxygen (Bond et al. 2010). Recent work on carbon-based planets has been particularly motivated by the detection of planets in the 55 Cancri system, whose C/O ratio is particularly high. In particular, the planet 55 Cancri e, whose mass–radius relationship suggests that it may be insufficiently dense to have a silicate composition (Demory et al. 2011), has been modeled as consisting of layers of carbon, SiC, and iron (Madhusudhan et al. 2012). Recent interpretations of spectroscopic data Nissen (2013), however, have called into question whether stars with C/O ratios over 0.8 indeed exist. With this in mind, it is important to compute accurate interior models and mass–radius relationships for carbide planets to assist in resolving the controversy of the composition of planets such as 55 Cancri e.
The accuracy of interior models of carbon-based planets has been hampered by a lack of experimental or theoretical data on the behavior of silicon–carbon materials at high pressures. The best available equations of state (EOSs) for high-pressure silicon carbide are based on the extrapolation of experimental data (Aleksandrov et al. 1989; Seager et al. 2007). Although the high-pressure phase diagram of carbon and the EOS have been extensively studied up to extremely high pressures of 100 Mbar using ab initio theory (Martinez-Canales et al. 2012), the phase diagrams of silicon carbide and pure silicon have not been studied at multi-megabar pressures. Furthermore, as we will show, the assumption that SiC remains the sole stable stoichiometry of the silicon–carbon binary system at extreme pressures is not justified, analogous to the anomalous stoichiometries seen at high pressures in materials such as MgSiO3 (Umemoto et al. 2006) and H2O (Zhang et al. 2013; Pickard et al. 2013). In order to build accurate interior models of silicon–carbon-rich planets, and hence to determine the expected mass–radius relationships for silicon–carbon planets as a function of composition, it is thus necessary to model more accurately the high-pressure behavior of these materials.
In this work, we compute the high-pressure phase diagram and EOSs of the silicon–carbon binary system up to pressures of 40 Mbar. We use an ab initio random structure search algorithm to find relevant high-pressure phases of silicon, carbon, silicon carbide, and SinCm compounds of alternative stoichiometries. We predict new high-pressure phases of silicon carbide and silicon, and new stable high-pressure compounds with Si2C and SiC2 stoichiometry. We compute EOSs for each relevant material and derive mass–radius relationships for silicon–carbon planets with interior pressures up to 40 Mbar. Our EOS for SiC is 12% denser than that used by Seager et al. (2007) leading to substantially smaller radii for silicon–carbon planets than had previously been suggested. We derive layered models for planets which take the novel Si2C and SiC2 phases into account. In addition, we revise earlier EOSs for high-pressure iron. Our new results allow a refinement of the interior models of 55 Cancri e derived by Madhusudhan et al. (2012), which allows us to place stronger constraints on possible compositional models for this planet; in particular, we eliminate the possibilities of pure SiC or SiC–iron compositions.
2. PHASE DIAGRAM OF THE SILICON–CARBON SYSTEM
For pressures higher than 4 Mbar that cannot be reached with diamond anvil cell experiments, our understanding of planetary materials relies primarily on theoretical methods. In order to compute the EOSs of silicon and carbon containing materials at high pressure, it is first necessary to know the phase diagram of the silicon–carbon binary system including the onset of phase transitions and the stoichiometric relationships, which requires a search through the space of possible structures to find the ground-state phase and stoichiometry as a function of pressure. The Ab Initio Random Structural Search (AIRSS) algorithm (Pickard & Needs 2006) has emerged as a successful method for finding stable crystal structures of materials, particularly at high pressures, with an efficiency comparable to more algorithmically complex methods such as genetic algorithms. In the AIRSS methodology, randomly generated cell geometries are filled with randomly positioned atoms. Efficient geometry relaxation procedures are used to find the nearest local minimum. Although most randomly generated structures do not lead to the absolute ground-state structure, it is found that a sufficiently large portion do so to allow the identification of ground state. Consistently and repeatedly finding a single structure to be lower in enthalpy than all competing structures may be considered to be reasonable evidence that it is the true lowest-enthalpy structure at that pressure. Although no optimization scheme can be guaranteed to find the lowest-enthalpy structure, the past success of AIRSS (Pickard & Needs 2011) gives us reasonable confidence in its ability to produce ground-state structures.
Here, ab initio random structure searches were undertaken at 10, 20, and 40 Mbar. For each set of pressure and stoichiometry (C, Si, SiC, and SimCn structures detailed below), we begin by generating at least 800 random structures of between 1 and 4 stoichiometric units. All density functional theory (DFT) simulations in this paper used the VASP code (Kresse & Furthmüller 1996), pseudopotentials of the projector augmented wave type (Blöchl 1994), and the exchange-correlation functional of Perdew et al. (1996). The positions are initially optimized using a conjugate gradient algorithm until the difference between successive energies is less than 0.001 eV, using a plane wave cutoff of 500 eV and a grid of 4 × 4 × 4 k points to sample the Brillouin zone. Following the initial runs, the 50 structures lowest in enthalpy are subjected to a second, more accurate minimization which uses a denser 12 × 12 × 12 k-point grid and a 1200 eV cutoff energy for the plane wave expansion. Finally, to obtain accurate enthalpy–pressure curves, we recompute the stablest few structures using a 1200 eV cutoff and 32 × 32 × 32 k points to ensure accurate and comparable enthalpies between structures with different cells. As a sole exception, a 24 × 24 × 24 k-point grid was used for the SiC rocksalt structure due to memory constraints; however, this should not have an appreciable effect on our results.
High-pressure phases of elemental carbon have been the study of a multiplicity of previous studies (Yin 1984; Grumbach & Martin 1996; Correa et al. 2008), and most recently an AIRSS study (Martinez-Canales et al. 2012) which predicted zero-temperature phases of carbon up to 100 Mbar. We find an identical progression of ground-state structures, shown in Figure 1. Our transition pressures match those of previous calculations, with carbon in the diamond phase transitioning to the BC8 phase at 10.0 Mbar and then to the simple cubic structure at 28.9 Mbar, compared to 9.9 and 29.0 Mbar in Martinez-Canales et al. (2012).
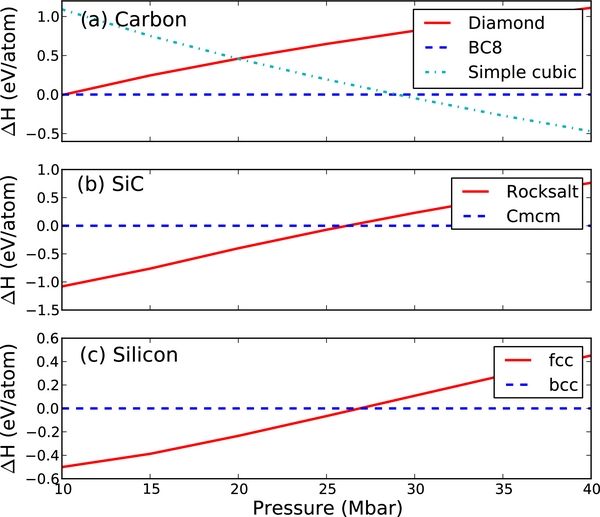
Figure 1. Pressure vs. enthalpy plot for the examined structures at zero temperature for (a) carbon, (b) SiC, and (c) silicon. Only structures that represent the thermodynamic ground state at some pressure between 10 and 40 Mbar are shown.
Download figure:
Standard image High-resolution imagePure silicon has been the study of fewer high-pressure theoretical studies. A transition from the hexagonal close packed (hcp) to the face-centered cubic (fcc) structure was predicted and experimentally confirmed to occur at 0.78 Mbar by Duclos et al. (1987). Using AIRSS, we confirm that the fcc structure remains the ground-state structure at 10 and 20 Mbar. However, at 40 Mbar, we find the body centered cubic (bcc) structure to be more stable. From a plot of enthalpy versus pressure (Figure 1), we find a transition from bcc to fcc at 27 Mbar.
Although silicon carbide exhibits a complex phase diagram at lower pressures, the high-pressure phase diagram is relatively simple. At 10.5 kbar, silicon carbide is known experimentally to transform into the rocksalt phase (Sekine & Kobayashi 1997). No other structure has been predicted at higher pressures. Our calculations find the rocksalt phase to remain stable at pressures as high as 10 and 20 Mbar. At 40 Mbar, however, we find a new SiC structure with Cmcm symmetry to be the stablest geometry. This structure is found to be structurally identical to the B33 structure of CrB, and is a layered structure in which each C or Si atom has five equally near neighbors of the opposite species within one layer unit, and two slightly further neighbors of the opposite species in the next layer. The structural parameters of the Cmcm SiC structure are given in Table 1. The transition from the rocksalt to the Cmcm structure is found to occur at 27 Mbar.
Table 1. Lattice Vectors and Atomic Positions for the Cmcm SiC Structure at 40 Mbar
| SiC Cmcm | x | y | z |
|---|---|---|---|
| Lattice vectors (Å) | |||
| a1 | 2.1351 | 0.1690 | −1.5335 |
| a2 | −0.0882 | 2.4599 | −0.9668 |
| a3 | −0.5811 | 0.0249 | 3.6518 |
| Atomic positions (relative) | |||
| C | 0.6968 | 0.8015 | 0.0786 |
| C | 0.1964 | 0.4908 | 0.2504 |
| C | 0.6966 | 0.8016 | 0.5783 |
| C | 0.1965 | 0.4908 | 0.7506 |
| Si | 0.6962 | 0.3475 | 0.7145 |
| Si | 0.1965 | 0.9449 | 0.1141 |
| Si | 0.6967 | 0.3474 | 0.2149 |
| Si | 0.1969 | 0.9449 | 0.6144 |
Download table as: ASCIITypeset image
We now turn our attention to the search for silicon–carbon structures with alternative stoichiometries. Here, we restrict our attention to structures with simple integer ratios of atomic species—C:Si = 1:2, 1:3, 1:4, 2:3, 2:1, 3:1, 4:1, and 3:2—since these ratios account for the overwhelming majority of known binary compounds. The space of compounds with each of these stoichiometries up to four functional units per cell was searched at 40 Mbar, and the enthalpy of the stablest compounds at each stoichiometry plotted as a function of elemental ratios in a convex hull diagram as seen in Figure 2. The convex hull diagram depicts the stability of material phases as a function of their chemical composition. If a point lies below the line joining two adjacent compositions, then this structure is stable relative to an (unmixed) combination of the adjacent phases. At 40 Mbar, we find that two new stoichiometries have become stable relative to the combination of other compounds: SiC2 (stabler than SiC + C) and Si2C (stabler than SiC + Si).
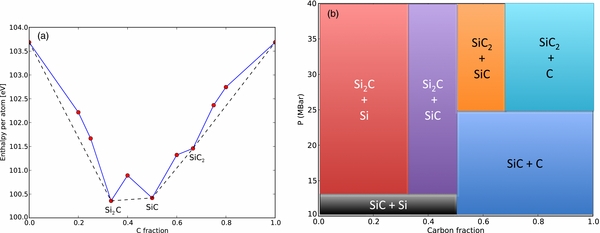
Figure 2. (a) Convex hull diagram depicting enthalpy vs. carbon fraction for compounds in the silicon–carbon binary system at 40 Mbar. (b) Phase diagram showing the stable mixture of phases formed for silicon–carbon stoichiometries as a function of composition and pressure from 10 to 40 Mbar.
Download figure:
Standard image High-resolution imageThe SiC2 structure found at 40 Mbar is a structure with Cmmm symmetry. The Cmmm structure consists of alternating rows of silicon atoms which are bonded to four silicon atoms in a planar configuration, and a second class of carbon atoms which are bonded to six silicon atoms. We are not aware of any other compound displaying this crystal structure. The structural parameters of the Cmmm structure are given in Table 2. Subsequent AIRSS searches at 20 and 10 Mbar found this structure to remain the ground-state stoichiometry at these lower pressures.
Table 2. Lattice Vectors and Atomic Positions for the Cmmm SiC2 Structure at 40 Mbar
| SiC2 Cmmm | x | y | z |
|---|---|---|---|
| Lattice vectors (Å) | |||
| a1 | 3.6247 | 1.2835 | −0.1061 |
| a2 | −0.3351 | 2.0508 | −1.4277 |
| a3 | 0.1642 | −0.3192 | 1.7582 |
| Atomic positions (relative) | |||
| C | 0.4788 | 0.5500 | 0.8103 |
| C | 0.8888 | 0.8451 | 0.1057 |
| C | 0.2987 | 0.1399 | 0.4007 |
| C | 0.8888 | 0.3450 | 0.1056 |
| Si | 0.1713 | 0.7037 | 0.4644 |
| Si | 0.6062 | 0.9862 | 0.7467 |
Download table as: ASCIITypeset image
For Si2C, a structure with I4/mcm symmetry was found to be the ground state at 40 Mbar. Examination of this structure reveals it to be identical to the C16 structure of Al2Cu. In this structure, carbon atoms form close-packed linear chains with each carbon atom equidistantly spaced from eight Si atoms. The structural parameters of this structure are given in Table 3. Similar to the SiC2 case, AIRSS searches at 20 and 10 Mbar found this structure to remain the ground-state stoichiometry at these lower pressures.
Table 3. Lattice Vectors and Atomic Positions for the I4/mcm Si2C Structure at 40 Mbar
| Si2C I4/mcm | x | y | z |
|---|---|---|---|
| Lattice vectors (Å) | |||
| a1 | 2.1800 | −0.2998 | −1.4105 |
| a2 | −0.5306 | 2.9222 | −1.4388 |
| a3 | 0.0467 | −0.5678 | 2.613 |
| Atomic positions (relative) | |||
| C | 0.3254 | 0.6211 | 0.9416 |
| C | 0.8247 | 0.6211 | 0.9415 |
| Si | 0.4163 | 0.1209 | 0.6241 |
| Si | 0.7339 | 0.1213 | 0.2590 |
| Si | 0.2335 | 0.4383 | 0.2585 |
| Si | 0.9166 | 0.8039 | 0.6245 |
Download table as: ASCIITypeset image
Next, we computed the EOSs of each of the SiC2 and Si2C structures and the formation energy relative to SiC + Si or SiC + C. Figure 3 shows the enthalpy of the Si2C and SiC2 phases relative to separate phases of SiC and C/Si. We find that SiC + Si will form the I4/mcm Si2C phase at 13 Mbar, with the formation enthalpy continuing to increase with pressure. The Cmmm SiC2 structure becomes stable at a higher pressure of 23 Mbar relative to SiC + C. The phase transition to the simple cubic structure of carbon, however, results in the formation enthalpy of SiC2 decreasing above 29 Mbar. Although SiC2 remains stable relative to SiC + C at 40 Mbar, the highest pressure studied here, a transition back to SiC + C stability is possible at higher pressures but lies beyond the scope of this work.
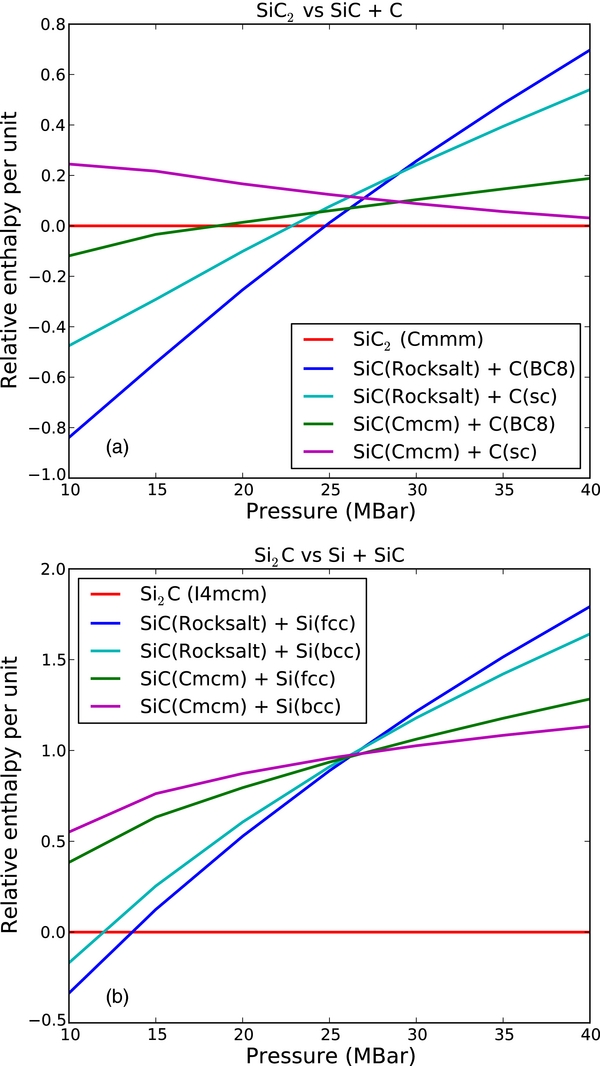
Figure 3. Pressure vs. enthalpy graphs showing the relative enthalpy of (a) combined SiC and C structures compared to the Cmmm SiC2 and (b) combined SiC and Si structures compared with the I4mcm Si2C structure.
Download figure:
Standard image High-resolution image3. EQUATION OF STATE RESULTS AND MASS–RADIUS RELATIONSHIP
Having established the phase diagram of the silicon–carbon system, we now compute the volume and enthalpy results as a function of pressure. Since our goal is to determine mass–radius relationships on a planetary scale, for the purpose of this calculation we ignore low-pressure phases such as graphite and the many phases of SiC existing below 10 kbar, which affect only the first few tens of kilometers of the planet; this leads to an underestimate of the planetary volume on the order of 10 km for an Earth-sized planet. EOS data for all silicon-carbon structures are shown in Table 4.
Table 4. Equation of State Data Including Density and Enthalpy per Atom for Silicon–Carbon Material Phases
| Species | Structure | Pressure | Density | Enthalpy |
|---|---|---|---|---|
| (Mbar) | (g cc−1) | (eV atom−1) | ||
| C | Diamond | 1.0 | 4.1426 | −5.8554 |
| C | Diamond | 2.0 | 4.6079 | −3.0188 |
| C | Diamond | 3.0 | 5.0240 | −0.4400 |
| C | Diamond | 4.0 | 5.3709 | 1.9546 |
| C | Diamond | 5.0 | 5.6865 | 4.2046 |
| C | Diamond | 6.0 | 5.9734 | 6.3385 |
| C | Diamond | 7.0 | 6.2415 | 8.3749 |
| C | Diamond | 8.0 | 6.4960 | 10.3284 |
| C | Diamond | 9.0 | 6.7340 | 12.2096 |
| C | Diamond | 10.0 | 6.9604 | 14.0268 |
| C | Diamond | 11.0 | 7.1741 | 15.7870 |
| C | Diamond | 12.0 | 7.3839 | 17.4964 |
| C | Diamond | 13.0 | 7.5829 | 19.1591 |
| C | Diamond | 14.0 | 7.7756 | 20.7795 |
| C | Diamond | 15.0 | 7.9613 | 22.3609 |
| C | Diamond | 16.0 | 8.1328 | 23.9063 |
| C | Diamond | 17.0 | 8.3161 | 25.4182 |
| C | Diamond | 18.0 | 8.4859 | 26.8992 |
| C | Diamond | 19.0 | 8.6534 | 28.3510 |
| C | Diamond | 20.0 | 8.8121 | 29.7756 |
| C | Diamond | 25.0 | 9.5705 | 36.5412 |
| C | Diamond | 30.0 | 10.2607 | 42.8134 |
| C | Diamond | 35.0 | 10.8991 | 48.6925 |
| C | Diamond | 40.0 | 11.4956 | 54.2475 |
| C | BC8 | 5.0 | 5.8732 | 4.5184 |
| C | BC8 | 10.0 | 7.1824 | 14.0330 |
| C | BC8 | 15.0 | 8.2055 | 22.1157 |
| C | BC8 | 20.0 | 9.0754 | 29.3157 |
| C | BC8 | 22.5 | 9.4708 | 32.6710 |
| C | BC8 | 25.0 | 9.8458 | 35.8926 |
| C | BC8 | 27.5 | 10.2027 | 38.9965 |
| C | BC8 | 30.0 | 10.5449 | 41.9959 |
| C | BC8 | 32.5 | 10.8719 | 44.9013 |
| C | BC8 | 35.0 | 11.1826 | 47.7221 |
| C | BC8 | 40.0 | 11.7922 | 53.1367 |
| C | sc | 5.0 | 6.1418 | 6.0218 |
| C | sc | 10.0 | 7.5009 | 15.1244 |
| C | sc | 15.0 | 8.5423 | 22.8679 |
| C | sc | 20.0 | 9.4457 | 29.7732 |
| C | sc | 25.0 | 10.2435 | 36.0862 |
| C | sc | 30.0 | 10.9662 | 41.9489 |
| C | sc | 32.5 | 11.3106 | 44.7409 |
| C | sc | 35.0 | 11.6362 | 47.4525 |
| C | sc | 37.5 | 11.9506 | 50.0899 |
| C | sc | 40.0 | 12.1622 | 52.6657 |
| SiC | Rocksalt | 1.0 | 5.0817 | −2.2463 |
| SiC | Rocksalt | 2.0 | 5.7612 | 1.5787 |
| SiC | Rocksalt | 3.0 | 6.3364 | 5.0081 |
| SiC | Rocksalt | 4.0 | 6.8246 | 8.1638 |
| SiC | Rocksalt | 6.0 | 7.6553 | 13.9003 |
| SiC | Rocksalt | 7.0 | 8.0183 | 16.5516 |
| SiC | Rocksalt | 8.0 | 8.3380 | 19.0894 |
| SiC | Rocksalt | 9.0 | 8.6729 | 21.5284 |
| SiC | Rocksalt | 10.0 | 8.9794 | 23.8815 |
| SiC | Rocksalt | 11.0 | 9.2668 | 26.1583 |
| SiC | Rocksalt | 12.0 | 9.5408 | 28.3667 |
| SiC | Rocksalt | 13.0 | 9.8064 | 30.5134 |
| SiC | Rocksalt | 14.0 | 10.0632 | 32.6039 |
| SiC | Rocksalt | 15.0 | 10.3100 | 34.6429 |
| SiC | Rocksalt | 16.0 | 10.5489 | 36.6347 |
| SiC | Rocksalt | 17.0 | 10.7793 | 38.5825 |
| SiC | Rocksalt | 18.0 | 11.0035 | 40.4896 |
| SiC | Rocksalt | 19.0 | 11.2231 | 42.3587 |
| SiC | Rocksalt | 20.0 | 11.4365 | 44.1922 |
| SiC | Rocksalt | 25.0 | 12.4322 | 52.8943 |
| SiC | Rocksalt | 30.0 | 13.3344 | 60.9563 |
| SiC | Rocksalt | 35.0 | 14.1631 | 68.5109 |
| SiC | Rocksalt | 40.0 | 14.9340 | 75.6493 |
| SiC | Cmcm | 10.0 | 9.1215 | 24.9617 |
| SiC | Cmcm | 15.0 | 10.7121 | 35.4056 |
| SiC | Cmcm | 20.0 | 11.8882 | 44.5932 |
| SiC | Cmcm | 25.0 | 12.9173 | 52.9655 |
| SiC | Cmcm | 27.5 | 13.3928 | 56.9134 |
| SiC | Cmcm | 30.0 | 13.8407 | 60.7266 |
| SiC | Cmcm | 32.5 | 14.2806 | 64.4197 |
| SiC | Cmcm | 35.0 | 14.6951 | 68.0041 |
| SiC | Cmcm | 37.5 | 15.0985 | 71.4900 |
| SiC | Cmcm | 40.0 | 15.4883 | 74.8858 |
| Si | fcc | 1.0 | 5.0745 | 1.9484 |
| Si | fcc | 2.0 | 5.9749 | 7.2012 |
| Si | fcc | 3.0 | 6.6483 | 11.8067 |
| Si | fcc | 4.0 | 7.2212 | 16.0004 |
| Si | fcc | 5.0 | 7.7143 | 19.8961 |
| Si | fcc | 6.0 | 8.1534 | 23.5609 |
| Si | fcc | 7.0 | 8.5695 | 27.0385 |
| Si | fcc | 8.0 | 8.9486 | 30.3586 |
| Si | fcc | 9.0 | 9.2956 | 33.5467 |
| Si | fcc | 10.0 | 9.6443 | 36.6189 |
| Si | fcc | 11.0 | 9.9552 | 39.5890 |
| Si | fcc | 12.0 | 10.2541 | 42.4682 |
| Si | fcc | 13.0 | 10.5431 | 45.2657 |
| Si | fcc | 14.0 | 10.8236 | 47.9890 |
| Si | fcc | 15.0 | 11.0940 | 50.6447 |
| Si | fcc | 16.0 | 11.3505 | 53.2382 |
| Si | fcc | 17.0 | 11.5983 | 55.7744 |
| Si | fcc | 20.0 | 12.3085 | 63.0787 |
| Si | fcc | 25.0 | 13.3673 | 74.4149 |
| Si | fcc | 30.0 | 14.3139 | 84.9295 |
| Si | fcc | 35.0 | 15.1764 | 94.7971 |
| Si | fcc | 40.0 | 15.9766 | 104.1368 |
| Si | bcc | 5.0 | 7.7133 | 19.8943 |
| Si | bcc | 10.0 | 9.6918 | 37.1199 |
| Si | bcc | 15.0 | 11.2153 | 51.0325 |
| Si | bcc | 20.0 | 12.4740 | 63.3130 |
| Si | bcc | 25.0 | 13.5778 | 74.4802 |
| Si | bcc | 30.0 | 14.5602 | 84.8214 |
| Si | bcc | 35.0 | 15.4580 | 94.5157 |
| Si | bcc | 40.0 | 16.2821 | 103.6850 |
| Si2C | I4mcm | 10.0 | 9.6143 | 28.4635 |
| Si2C | I4mcm | 11.0 | 7.3242 | 34.2719 |
| Si2C | I4mcm | 12.0 | 8.2958 | 34.9181 |
| Si2C | I4mcm | 13.0 | 10.4987 | 35.4821 |
| Si2C | I4mcm | 14.0 | 10.7799 | 37.6943 |
| Si2C | I4mcm | 15.0 | 11.0457 | 39.8521 |
| Si2C | I4mcm | 16.0 | 11.3001 | 41.9598 |
| Si2C | I4mcm | 17.0 | 11.5455 | 44.0213 |
| Si2C | I4mcm | 18.0 | 11.7847 | 46.0399 |
| Si2C | I4mcm | 19.0 | 12.0179 | 48.0185 |
| Si2C | I4mcm | 20.0 | 12.2461 | 49.9598 |
| Si2C | I4mcm | 22.5 | 12.7836 | 54.6642 |
| Si2C | I4mcm | 25.0 | 13.2938 | 59.1794 |
| Si2C | I4mcm | 27.5 | 13.7768 | 63.5289 |
| Si2C | I4mcm | 30.0 | 14.2369 | 67.7320 |
| Si2C | I4mcm | 32.5 | 14.6785 | 71.8039 |
| Si2C | I4mcm | 35.0 | 15.1003 | 75.7578 |
| Si2C | I4mcm | 37.5 | 15.5097 | 79.6042 |
| Si2C | I4mcm | 40.0 | 15.9022 | 83.3526 |
| SiC2 | Cmmm | 5.0 | 7.0230 | 10.0434 |
| SiC2 | Cmmm | 10.0 | 8.7326 | 21.4377 |
| SiC2 | Cmmm | 15.0 | 10.0603 | 31.0094 |
| SiC2 | Cmmm | 20.0 | 11.1627 | 39.4868 |
| SiC2 | Cmmm | 22.5 | 11.6592 | 43.4307 |
| SiC2 | Cmmm | 25.0 | 12.1212 | 47.2148 |
| SiC2 | Cmmm | 27.5 | 12.5706 | 50.8590 |
| SiC2 | Cmmm | 30.0 | 12.9951 | 54.3792 |
| SiC2 | Cmmm | 32.5 | 13.4098 | 57.7884 |
| SiC2 | Cmmm | 35.0 | 13.7925 | 61.0970 |
| SiC2 | Cmmm | 37.5 | 14.1736 | 64.3142 |
| SiC2 | Cmmm | 40.0 | 14.5414 | 67.4479 |
In Figure 4, we compare our DFT-based SiC EOS calculations with two EOSs that were previously constructed for SiC. First, we show a Birch–Murnaghan fit that was constructed from the high-pressure diamond anvil cell experiments by (Aleksandrov et al. 1989). The density of SiC was determined with X-ray diffraction measurements up to a pressure of 0.425 Mbar. Results were fit to a third order Birch–Murnaghan equation (Birch 1947). Even though this equation was constructed to describe the compression of materials, significant uncertainties are introduced when one extrapolates this EOS fit by two orders in pressure. It is therefore not too surprising that our DFT calculations predict densities for SiC that are between 20 and 35% higher. Seager et al. (2007) combined the experimental results by Aleksandrov et al. with the predictions from the Thomas–Fermi–Dirac theory (Salpeter & Zapolsky 1967) in order to construct a modified polytrope EOS for SiC for the purpose of planetary interior modeling, which was later also used by Madhusudhan et al. (2012). The densities derived from the modified polytrope EOS are approximately 12% lower than we obtained with DFT calculations. This correction directly implies that the radii of SiC planets have previously been significantly overestimated (Seager et al. 2007; Madhusudhan et al. 2012). Since DFT has been validated for a wide range of materials and thermodynamic conditions (Tuckermann 2002; Kirchner et al. 2012; Parrinello 1997), and the Thomas–Fermi–Dirac theory only becomes valid at ultra-high pressures where chemical bonds can no longer exist, we consider our DFT results significantly more reliable in the megabar regime under consideration.
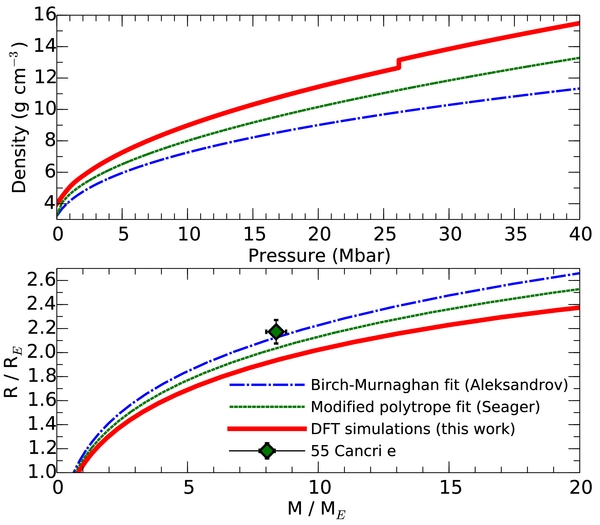
Figure 4. Upper panel compares the density of SiC as a function of pressure predicted from our DFT calculations with the Birch–Murnaghan fit to the experimental data (Aleksandrov et al. 1989) and modified polytrope EOS by Seager et al. (2007). The discontinuity of the DFT curve marks the phase transition from the rocksalt to the Cmcm structure. Since our DFT calculations predict SiC to be more dense at megabar pressures, we predict the radii of SiC planets to be significantly smaller, which is illustrated in the lower panel. Thus, 55 Cancri e can no longer be composed purely of SiC. A lighter outer layer, e.g., one made of carbon, is needed to explain the observed mass and radius.
Download figure:
Standard image High-resolution imageFollowing Seager et al. (2007), we solve the equations of hydrostatic equilibrium and mass conservation to derive the mass–radius relationship of different planets:


We start the integration in the planet's center with r = 0, m = 0, and a central pressure, P = Pc, and then integrate outward until the pressure decreases to zero. m(r) indicates the mass that is enclosed in radius r. The second equation describes how m(r) changes when a new mass shell is added. The first equation characterizes the change in pressure that balances the difference in gravitational potential that an additional layer introduces. For efficiency reasons, we solve these equations with a fourth-order Runge–Kutta method using a fixed step size of dr = 50 km. Alternatively a simple Euler integration with dr = 1 km may also be used. The EOS only enters through ρ = ρ(P). We neglect temperature effects, which were estimated by Seager et al. (2007) to increase the radius of planets by only  . For each material's phase, we construct a separate spline function, ρ = ρ(P), to interpolate our DFT results. When a phase transition occurs at a certain pressure, we switch discontinuously from one spline function to the next.
We integrated Equations (1) and (2) for pure SiC planets to learn how differences in the EOS affect the mass–radius relationship. Figure 4 shows that our DFT results imply that SiC planets are approximately 5% smaller than predicted by Seager et al. (2007) and Madhusudhan et al. (2012). Because of this correction, it is no longer valid to model 55 Cancri e as a pure SiC planet, which was one possible scenario that was recently proposed by Madhusudhan et al. (2012) among other interior models. Our DFT results instead predict 55 Cancri e to have another light outer layer in addition to the SiC core. A likely candidate would be a carbon layer.
Following Madhusudhan et al. (2012), we constructed a suite of ternary interior models with an iron core, an SiC mantle, and an outer carbon layer. The central pressure, Pc, and the pressures where we switch from iron to SiC, P1, and from SiC to carbon, P2, are free parameters. We constructed a fine three-dimensional grid ranging from 6.5 ⩽ Pc ⩽ 24.5 Mbar and 0 ⩽ P1/Pc ⩽ 1 and 0 ⩽ P2/P1 ⩽ 1. We selected models where the sum of the χ2 deviations in mass and radius from the observed values were less than two. We adopted a radius value of 2.173 that combined Spitzer and Microvariability and Oscillations of STars observations (Gillon et al. 2012) rather than constructing interior models for each radius measurement separately. A mass of M = 8.39 ± 0.38 ME (Endl et al. 2012) was assumed. All valid models are summarized in the compositional diagram in Figure 5. When we performed this analysis with a modified polytrope EOS for SiC, our results are consistent with those by Madhusudhan et al. (2012) and a planet of pure SiC would be consistent with observations. However, when we switch to using our more accurate DFT EOS for SiC, maximum SiC fraction drops to only 52%. Because we predict SiC to be a denser material, a thick outer carbon layer must compensate for this change.
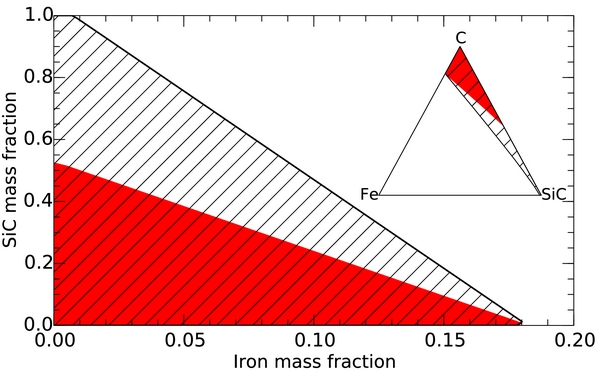
Figure 5. SiC vs. iron mass fraction for three-layer iron–SiC–C planet models that were constructed to match the observed mass and radius of 55 Cancri e, M = 8.39 ± 0.38 ME and 2.173 . The hatched area shows valid models based on a modified polytrope EOS of SiC (Seager et al. 2007). Using the our DFT SiC EOS, the permitted SiC fraction shrinks significantly (red filled area). The inset shows the same information in a conventional ternary compositional diagram where each corner corresponds to a planet made of only one material. The DFT results imply that 55 Cancri e is composed of 48% carbon or more.
Download figure:
Standard image High-resolution imageIn Figure 5, we compare the iron and SiC mass fractions from our Fe–SiC–C models that match the observed mass and radius. In the inset, we display the same information in a ternary composition diagram, as in Valencia et al. (2007), where each corner corresponds to a planet of one material only. When we compared the effects of using our DFT EOS for SiC with the modified polytrope EOS from Seager et al. (2007), all other model parameters were kept constant. Both EOSs consistently predict that 55 Cancri e can only contain up to 18% iron. This limit appears to be insensitive to changes in the SiC and Fe EOSs because the density of iron is so much higher than that of the other materials. Based on our DFT results, we predict 55 Cancri e to be consistent with a carbon-rich planet with a carbon fraction of 48% or more. All permitted models fall into a triangle in composition space that is spanned by three limiting cases: (1) pure carbon planet, (2) an iron-free SiC–C planet with 48% carbon, and (3) an SiC–free iron–carbon planet with 82% carbon. It is not possible to resolve this degeneracy with the existing constraints on mass and radius. In principle, additional information can be obtained from in situ simulations (Bond et al. 2010).
4. INTERIOR STRUCTURE OF Si–C PLANETS
In this section, we explore how the formation of the novel compounds, SiC2 and Si2C, will affect the interior structure of Si–C planets. It is our goal to determine under which conditions these compounds form, what layers emerge in the planet's interior, and how much of each compound is produced over time. As it turns out, the mass–radius relation is not affected very much because SiC2 and Si2C form at relatively high pressures, but we address these interior questions here so that a planetary model can readily be constructed for other classes of materials. From our DFT simulations, we derived the compositional phase diagram in Figure 3. This diagram describes which minerals would form from a Si–C mixture at a certain pressure. For example, a carbon-rich Si–C mixture would split into SiC and carbon for pressures up to 25 Mbar. For higher pressures, this mixture would split into SiC2 and SiC or, for carbon fractions larger than 67%, would form SiC2 and carbon. For silicon-rich assemblages, a similar change is triggered by the formation of Si2C at 13.6 Mbar.
First, we will discuss the formation of a carbon-rich planet with a carbon atom fraction of 95%. We assume homogeneous accretion of SiC and carbon in fixed proportions. Materials in the planetary interior differentiate and form separate layers that are sorted by density Turcotte & Schubert (2014). Each layer is assumed to be homogeneous but have distinct chemical composition and be fully convective.
For an accreting carbon-rich planet, these assumptions and the phase diagram in Figure 3 imply the formation of a two-layer planet with a SiC core and carbon mantle until the planet exceeds a critical size. For a carbon fraction of 95%, this critical size corresponds to a planet with a radius of 2.886 RE and a mass of 24.92 ME as illustrated in Figure 6(a). The SiC core would be comprised of only 2.77 ME and have a radius of 1.04 RE. If the pressure at the core–mantle boundary exceeds 25 Mbar, then SiC2 will form from SiC and carbon. Since SiC2 has an intermediate density, this new layer will form between the SiC core and carbon layer. If additional SiC–C material is accreted onto the surface of the planet, then the increased gravitational force will temporarily increase the pressure at the SiC2–C boundary beyond 25 Mbar. When the sinking SiC material arrives at the bottom of the carbon layer, it will react with the carbon present to form additional SiC2. Assuming that plenty of SiC is available, this implies the existence of a feedback mechanism that stabilizes the pressure at the SiC2–C boundary at 25 Mbar during accretion.

Figure 6. Interior models for Si–C planets with carbon fraction of 95%. The left panel (panel (a)) illustrates the largest size such a planet can reach before an intermediate SiC2 layer forms. The middle panel (panel (b)) shows a planet in chemical equilibrium with such a layer. The right panel (panel (c)) displays an alternative, dynamic interior model for the same total mass where the SiC core was not permitted to be absorbed into the forming SiC2 layer.
Download figure:
Standard image High-resolution imageHowever, determining whether sufficient SiC is available at the SiC2–C boundary is not straightforward. If one grows the planet assuming a constant total composition and that the SiC2–C boundary remains at the critical pressure of 25 Mbar, then some reactant SiC material has to come from the SiC core. Assuming that the core provides sufficient SiC, the planet will assume the state of chemical equilibrium shown in Figure 6(b). As the planet mass increases from 27.68 to 29.00 ME during accretion, the SiC core would shrink from 2.77 to only 1.32 ME in such a model. This would require a significant amount of gravitational energy and it is not obvious which mechanism could provide that. However, planetary interiors are complex and the equilibrium model is certainly one that needs to be considered. The scenario of a shrinking SiC core would share some similarities with the core erosion that has been proposed to occur in giant planets (Guillot et al. 2004; Wilson & Militzer 2012a, 2012b; Wahl et al. 2013).
In the absence of any obvious energy source that would be needed to shrink the SiC and bring the whole planet into chemical equilibrium, we also wish to discuss an alternative dynamic scenario, where no mass is removed from the SiC core. We assume that the SiC core would grow to the maximum size that is reached when the pressure at the SiC2–C boundary attains 25 Mbar. From that point on, the SiC2 layer would only grow from newly accreted SiC material sinking through the carbon layer. As the planet mass increases from 27.68 to 29.00 ME, the SiC core would only be more compressed and its radius would shrink from 1.04 to 1.02 RE. A comparatively thin SiC2 layer would form that comprises only 0.20 ME compared to 2.37 ME in the equilibrium scenario. The SiC2 layer would be starved for SiC and the pressure at the SiC2–C boundary would reach 26.2 Mbar (Figure 6(c)). This exceeds the 25 Mbar needed for SiC2 formation but there is insufficient SiC available. This condition is also consistent with the phase diagram in Figure 3.
For a fixed planet mass and carbon fraction, the deviations in the predicted radii between the equilibrium and the dynamic scenario are very small. For a planet of 29 ME, we obtained 2.892 and 2.895 RE, respectively. We conclude that either model can be use to compare with observations in the future.
For a silicon-rich planet with a carbon atom fraction of 45%, the differences between the equilibrium and the dynamic scenario are a bit more pronounced because the Si2C already forms 13.6 Mbar. A planet may accrete up to 11.62 ME and reach a radius of 2.091 RE before the Si2C layer forms (Figure 7(a)). According to the equilibrium model, the SiC core would then be completely absorbed into the growing Si2C layer (Figure 7(b)) as the planet reaches a total mass of 16.15 ME. An amount of 4.84 ME of Si2C would be formed according to the equilibrium picture, while in the dynamic scenario one would predict an intermediate Si2C layer of only 1.36 ME to form. Figure 7 shows that the predicted planet radii are again very similar.
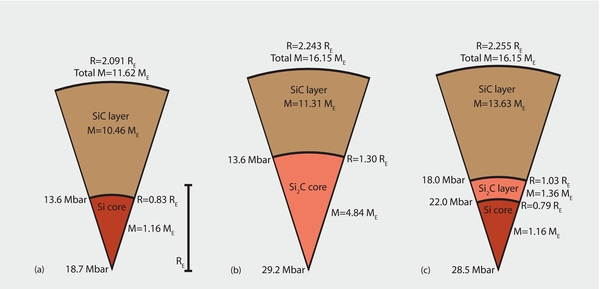
Figure 7. Interior models for Si–C planets with carbon fraction of 45%. Similar to Figure 6, the left panel (panel (a)) shows the largest possible planet without an intermediate Si2C layer. The middle panel (panel (b)) displays a planet in chemical equilibrium where the SiC core has been absorbed completely into the Si2C layer with such a layer. The right panel (panel (c)) shows an alternative, dynamic interior model where the SiC core was not permitted to shrink.
Download figure:
Standard image High-resolution imageIn Figure 8, we summarize the mass–radius relationships of different types of planets. For this purpose, we also revisited the accuracy of the iron EOS used in Seager et al. (2007) by performing DFT calculations of the relevant bcc and hcp phases. Our computed EOS data for iron are shown in Table 5. We identified a modest correction. At 10 and 40 Mbar, we predict densities 2.2% and 4.7% higher. The predicted radii of pure iron planets with 5 and 10 Earth masses would shrink by 1% and 2%, respectively.
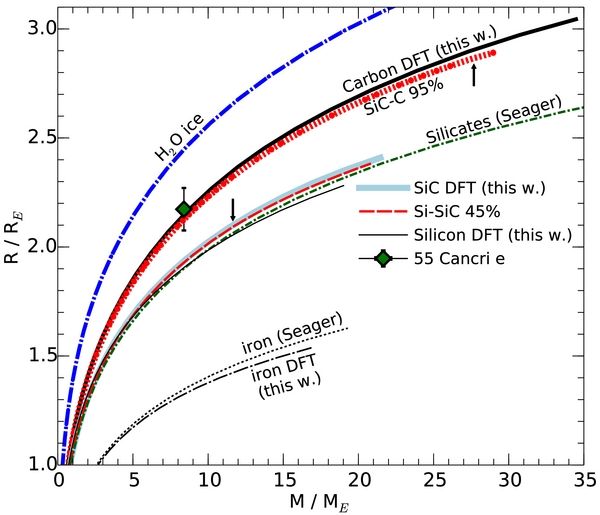
Figure 8. Mass–radius relationship for different types of planets in Earth units. The arrows indicate the minimum mass that is required for carbon- and silicon-rich planets to form intermediate layers of SiC2 and Si2C, respectively. The mass percentage of carbon is indicated in the caption when appropriate.
Download figure:
Standard image High-resolution image
Table 5. Equation of State Data Including Density and Enthalpy per Atom for Iron Phases
| Species | Structure | Pressure | Density | Enthalpy |
|---|---|---|---|---|
| (Mbar) | (g cc−1) | (eV atom−1) | ||
| Fe | bcc | 0.01391 | 8.182839 | −8.35683 |
| Fe | bcc | 0.03448 | 8.270199 | −8.21149 |
| Fe | bcc | 0.05611 | 8.358808 | −8.06053 |
| Fe | bcc | 0.08061 | 8.448687 | −7.89181 |
| Fe | bcc | 0.10821 | 8.539859 | −7.70367 |
| Fe | bcc | 0.13809 | 8.632347 | −7.502 |
| Fe | bcc | 0.16915 | 8.726176 | −7.29448 |
| Fe | bcc | 0.20034 | 8.821370 | −7.08826 |
| Fe | bcc | 0.23143 | 8.917954 | −6.88488 |
| Fe | bcc | 0.26156 | 9.015952 | −6.68991 |
| Fe | bcc | 0.2911 | 9.115392 | −6.50123 |
| Fe | bcc | 0.32414 | 9.216300 | −6.2928 |
| Fe | bcc | 0.36147 | 9.318702 | −6.05975 |
| Fe | bcc | 0.40234 | 9.422627 | −5.80725 |
| Fe | bcc | 0.44599 | 9.528103 | −5.54044 |
| Fe | bcc | 0.49285 | 9.635160 | −5.25717 |
| Fe | bcc | 0.54237 | 9.743826 | −4.96109 |
| Fe | bcc | 0.59418 | 9.854132 | −4.65468 |
| Fe | bcc | 0.64755 | 9.966110 | −4.34239 |
| Fe | hcp | −0.05944 | 8.862207 | −8.76171 |
| Fe | hcp | 0.0001 | 9.050161 | −8.37696 |
| Fe | hcp | 0.02166 | 9.122843 | −8.23894 |
| Fe | hcp | 0.11463 | 9.393801 | −7.65712 |
| Fe | hcp | 0.34582 | 9.968777 | −6.2743 |
| Fe | hcp | 0.48708 | 10.273923 | −5.46578 |
| Fe | hcp | 0.64798 | 10.591651 | −4.5723 |
| Fe | hcp | 0.8323 | 10.922616 | −3.57983 |
| Fe | hcp | 1.04156 | 11.267516 | −2.48742 |
| Fe | hcp | 1.27955 | 11.627091 | −1.28317 |
| Fe | hcp | 1.55108 | 12.002130 | 0.047882 |
| Fe | hcp | 1.85678 | 12.393473 | 1.49897 |
| Fe | hcp | 2.20624 | 12.802017 | 3.10511 |
| Fe | hcp | 2.59825 | 13.228717 | 4.84903 |
| Fe | hcp | 3.04297 | 13.674591 | 6.7634 |
| Fe | hcp | 3.54628 | 14.140731 | 8.85877 |
| Fe | hcp | 4.11476 | 14.628300 | 11.1471 |
| Fe | hcp | 4.75869 | 15.138545 | 13.6519 |
| Fe | hcp | 5.48213 | 15.672798 | 16.3703 |
| Fe | hcp | 6.30191 | 16.232489 | 19.3449 |
| Fe | hcp | 7.23062 | 16.819149 | 22.598 |
| Fe | hcp | 8.28052 | 17.434424 | 26.1466 |
| Fe | hcp | 9.45438 | 18.080079 | 29.9736 |
| Fe | hcp | 10.7696 | 18.758013 | 34.1072 |
| Fe | hcp | 12.2673 | 19.470268 | 38.642 |
| Fe | hcp | 13.9755 | 20.219044 | 43.6245 |
| Fe | hcp | 15.892 | 21.006712 | 49.0066 |
| Fe | hcp | 18.0594 | 21.835830 | 54.8622 |
| Fe | hcp | 20.5019 | 22.709162 | 61.2107 |
| Fe | hcp | 23.2418 | 23.629694 | 68.0552 |
| Fe | hcp | 26.3366 | 24.600658 | 75.4824 |
| Fe | hcp | 29.8175 | 25.625557 | 83.5108 |
| Fe | hcp | 33.714 | 26.708186 | 92.1264 |
| Fe | hcp | 37.9519 | 27.852670 | 101.117 |
| Fe | hcp | 42.6806 | 29.063490 | 110.737 |
Download table as: ASCIITypeset image
We added the different types of Si–C planets to Figure 8. As expected, Si–C planets with 45% and 95% carbon closely track the results of the pure SiC and pure carbon planets, respectively. The formation of intermediate Si2C and SiC2 layers does not significantly affect the mass–radius relationship. More surprising is that the radii of pure SiC planets are very similar to those of rocky planets made of 100% silicates. Our revision of the SiC EOS put this material much closer to silicate rocks. Therefore, SiC cannot serve as a low-density material to explain the interior structure when observations suggest a radius larger than that of pure silicate planets.
5. CONCLUSIONS
We have conducted extensive simulations of the phase diagram and EOS of the silicon–carbon system at pressures up to 40 Mbar. Using ab initio random structure search methods, we predicted a new phase of silicon carbide and a bcc to fcc transition in silicon. In addition, we find two phases, SiC2 and Si2C, which are formed at high pressures for carbon-rich or silicon-rich stoichiometries, respectively. Our newly calculated EOS for silicon carbide is approximately 5% denser at high pressures than the extrapolated EOS used in previous works, leading to a significant downwards revision of predicted mass–radius relationships for SiC–C planets and eliminating the possibility of a 55 Cancri e model made of pure SiC. We also present a revised EOS for iron.
At present, 55 Cancri e remains the sole identified candidate for a silicon–carbon dominated exoplanet, however, its C/O ratio remains the subject of controversy. Future work to identify and characterize additional carbon planet candidates may be able to resolve the question of the existence and composition of carbon-based planets.