


ABSTRACT
We investigate the dynamics and magnetic properties of orphan penumbrae observed in the solar photosphere to understand the formation process of such structures. We observed two orphan penumbrae in active region NOAA 11089 during a coordinated observing campaign carried out in 2010 July, involving the Hinode/Solar Optical Telescope (SOT) and Dutch Open Telescope (DOT), benefiting also from continuous observations acquired by the SDO satellite. We follow their evolution during about three days. The two structures form in different ways: one seems to break off the penumbra of a nearby sunspot, the other is formed through the emergence of new flux. Then they fragment while evolving. The SDO Helioseismic and Magnetic Imager measurements indicate the presence of strong line-of-sight motions in the regions occupied by these orphan penumbrae, lasting for several hours and decreasing with time. This is confirmed by SOT spectro-polarimetric measurements of the Fe i 630.2 nm pair. The latter also show that Stokes parameters exhibit significant asymmetries in the orphan penumbral regions, typical of an uncombed filamentary structure. The orphan penumbrae lie above polarity inversion lines, where peculiar plasma motions take place with velocities larger than ±3 km s−1. The vector magnetic field in these regions is highly inclined, with the average magnetic field strength decreasing with time. The DOT observations in the Hα line and SDO Atmospheric Imaging Assembly measurements in the He ii 30.4 nm line indicate that there is no counterpart for the orphan penumbrae at midchromospheric heights or above. Our findings suggest that in at least one of the features investigated the emerging flux may be trapped in the low atmospheric layers by the overlying pre-existing fields, forming these filamentary structures.
Export citation and abstract BibTeX RIS
1. INTRODUCTION
Penumbrae are the regions that usually surround the umbra of sunspots, often with annular, radial symmetry. When observed with sufficient angular resolution, they appear to be formed of dark filaments, where the magnetic field is quite inclined or almost horizontal and parallel to the photosphere, interspersed by bright regions. Such a magnetic topology in this area is referred to as the "uncombed" structure of the penumbra (Solanki & Montavon 1993; see Thomas & Weiss 2008 for a schematic drawing).
Very rare observations of the photosphere show that there are features, the so-called orphan penumbrae (Zirin & Wang 1991), that are not close or clearly connected to umbral regions. They appear to have many characteristics of normal penumbrae, such as the filamentary structure. They usually have a lifetime of a few days, shorter than regular penumbrae.
Zirin & Wang (1991) reported that the horizontal motions in an orphan penumbra were similar to those in the regular penumbra. Analyzing the same data set with the local correlation technique, Denker et al. (1997) found outward motions in the outer part of the structure both in white light images and in Ca ii K filtergrams. Moreover, Hα filtergrams showed that the orphan penumbra did not possess a counterpart in the chromosphere.
The origin of orphan penumbrae is as yet undetermined. The dearth of observations does not allow us to clearly distinguish if these structures form independently or if they are the remnants of sunspot penumbrae that separate from their sunspot and are observed detached. Thus, the investigation of orphan penumbrae is quite interesting because the study of their evolution, dynamics, and magnetic properties could give us important information to understand the physical processes responsible for their formation and also for the formation of normal penumbrae in solar active regions (ARs).
1.1. The Penumbral Formation Problem
The formation process of the penumbrae and of their magnetic fields is poorly understood. Although the penumbral formation occurs frequently in ARs, there are few observations of this phenomenon with high spatial, spectral, and temporal resolution. This is a complex phenomenon involving velocity and magnetic fields and can be considered a manifestation of small-scale dynamics (Schlichenmaier 2009; Borrero & Ichimoto 2011; Rempel & Schlichenmaier 2011).
The penumbral formation seems to be closely related to flux emergence. Leka & Skumanich (1998) discussed various scenarios of penumbral formation. In particular, they suggested that an emerging horizontal field could be trapped and form a penumbra rather than continuing to rise to higher layers. However, it remains unclear how the emerging field could be trapped near the photosphere. Elongated photospheric granules with fibrillar structure, associated with magnetic bipoles aligned with the horizontal component of the emerging fields, are a signature of flux emergence (Bray & Loughhead 1964; Strous & Zwaan 1999; Cheung et al. 2007, 2008; Guglielmino et al. 2010; Guglielmino 2012). Similar bipolar structures were seen joining a sunspot while its penumbra was forming in observations carried out by Schlichenmaier et al. (2010a, 2010b) and Rezaei et al. (2012). In this case, flux emergence actually seemed to suppress the penumbral formation. The authors found that penumbra formed in segments and that penumbral filaments developed mostly on the side opposite the ongoing flux emergence, while filamentary structures in the flux emerging region rapidly disappeared. Thus, the role played by flux emergence in penumbral formation remains unclear.
Another unsolved issue involves the Evershed flow observed along the penumbra filaments (Evershed 1909), which has been interpreted as a Doppler shift corresponding to a horizontal outflow within the penumbra. The connection between the large-scale outflows and the intensity structure as well as the evolution of this flow are not clear. The Evershed flow is often explained in terms of a plasma flow channeled by penumbral fibrils. The pressure difference between the inner and outer footpoints of the fibrils would lead to a siphon flow along the magnetic field lines (Montesinos & Thomas 1997). High-resolution imaging, together with vector field measurements, show that the Evershed flow is confined to penumbral dark lanes, characterized by a weaker and more horizontal magnetic field, which are interspersed with regions characterized by stronger and more vertical field lines (Rimmele & Marino 2006). Schlichenmaier et al. (2012) showed that the early stages of the penumbral formation seem to be associated with a plasma flow that moves in the opposite direction of the typical Evershed flow.
Some observations seem to show that the magnetic canopy overlying the region surrounding a sunspot at the chromospheric level might also play an important role in the formation of the penumbra in the photosphere. Shimizu et al. (2012) and Romano et al. (2013) found in the chromospheric Ca ii H 396.8 nm and Ca ii 854.2 nm lines, respectively, the presence of an annular zone of 3''–5'' width around pores before the formation of their penumbra. Shimizu et al. (2012) noticed this annular zone in Ca ii H intensity, whereas Romano et al. (2013) found that the magnetic field in this region has an average inclination of about |60°|. These studies interpreted this annular zone as evidence that the magnetic canopy already existing at a higher level in the solar atmosphere may evolve into the highly inclined penumbral fields at the photospheric level. Furthermore, Romano et al. (2014) noticed in the photospheric Fe i 630.25 nm line the presence of several patches at the edge of the annular zone around a pore with a typical size of about 1'' and a polarity opposite that of the pore. These patches show upward motions of about −0.5 km s−1 and exhibit displacements radially outward with horizontal velocities up to 1.5 km s−1. Romano et al. (2014) suggested that these features are the footpoints of the magnetic field lines that from the forming penumbra return beneath the photosphere and that are progressively stretched and pushed down by the overlying magnetic field.
The importance of the magnetic field topology and velocity fields in the lower atmosphere for the penumbral formation was shown in the numerical simulations carried out by Rempel et al. (2009) and Rempel (2011, 2012). These models consist of three-dimensional (3D) MHD simulations of radiative magneto-convection in inclined fields (see also Rempel & Schlichenmaier 2011 for a review on existing penumbral models). In particular, Rempel (2012) demonstrated that the penumbral fine structure depends on the upper boundary condition for the magnetic field. A more extended penumbra formed under the condition in which the horizontal field component was enhanced at the top of the computational domain. This finding implies that a key condition for the penumbral formation lies in the horizontal canopy fields in the lower atmosphere.
1.2. Observations of Orphan Penumbrae
Recent, high-resolution observations are now providing new insights for solving the long-standing puzzle of orphan penumbrae. Kuckein et al. (2012a, 2012b) carried out a multiwavelength, multiheight analysis of the vector magnetic field and of the velocities of an orphan penumbra observed in AR NOAA 10781 during its decay phase. They found that this structure, observed in the Si i 1082.7 nm line center and in the adjacent continuum, formed below a dark AR filament observed in the He i 1083.0 nm triplet core, when an opening and closing of adjacent regions with opposite polarities on both sides of the polarity inversion line (PIL) occurred. They detected a strongly sheared magnetic field in the region of the orphan penumbra, with the horizontal component of the field pointing along the PIL in the photosphere and a normal polarity configuration in the chromosphere. The horizontal fields exhibited upward motions of about −0.15 km s−1, being embedded in a generalized chromospheric downflow of 1.6 km s−1 in the facular region surrounding the filament. They suggested that orphan penumbrae are formed along photospheric PILs of compact ARs and that these features are the photospheric manifestations of flux ropes trapped in the photosphere (see Figure 1, top panel, for a schematic representation of this scenario). Whether the photospheric orphan penumbra is part of the filament flux rope or another independent emerging magnetic field trapped by the filament field is still uncertain.
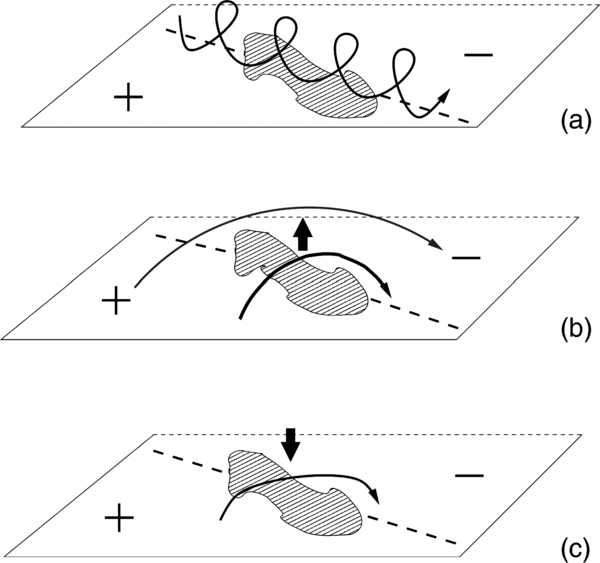
Figure 1. (a) Schematic representation of the region hosting the orphan penumbra (shaded area), with a flux rope lying above it following the scenario proposed by Kuckein et al. (2012a, 2012b). The dashed line indicates the PIL. (b) Representation of the orphan penumbra as the upper horizontal part of an emerging Ω-loop (Lim et al. 2013), trapped in the photosphere by an overlying canopy field. (c) Schematic picture of the orphan penumbra as submerging horizontal fields, according to the scenario proposed by Jurčák et al. (2014).
Download figure:
Standard image High-resolution imageLim et al. (2013) reported on the presence of an orphan penumbra near a mature sunspot in AR NOAA 11391. High-resolution (0 11), broadband TiO images acquired at the New Solar Telescope revealed that the orphan penumbra was actually connecting two tiny dark points. Filtergrams taken in the blue wing of the Hα line (−75 pm) showed low-lying chromospheric fibrils over the orphan penumbra, with one of the TiO dark points appearing as a bright patch in Hα images. There was no evidence that the overlying chromospheric field was a flux rope. Relying on these observations, the authors interpreted the orphan penumbra as the upper horizontal part of an emerging Ω-loop, still trapped in the photosphere by the overlying canopy fields (see Figure 1, middle panel).
Jurčák et al. (2014) interpreted orphan penumbrae as submerging, horizontal fields (see Figure 1, bottom panel). They used Hinode data to determine the properties of orphan penumbrae observed in AR NOAA 10960 and AR NOAA 11089. They studied the evolution of these structures by analyzing the vector magnetic field and line-of-sight (LOS) velocities in the photosphere using spectro-polarimetric measurements in the Fe i pair at 630.2 nm, magnetograms in the Na i D1 line referring to the upper photospheric layers, and G-band and Ca ii H filtergrams to investigate their brightness and apparent horizontal motions. Jurčák et al. (2014) found that orphan penumbrae formed between regions of opposite polarity and were characterized by very horizontal magnetic fields, with an inclination of |75°|. In this sense, their magnetic configuration was similar to that of flattened Ω-shaped flux ropes. The opposite-polarity regions approached each other with time, and the whole structure submerged as the penumbral filaments disappeared. They also found the presence of intense plasma flows, which might be caused by the siphon flow mechanism (Montesinos & Thomas 1997). Strong similarities were found between orphan and normal penumbrae, the main differences between them being the absence of a background magnetic field in orphan penumbrae and their more intense brightness in the upper atmospheric layers.
1.3. The Present Work
Three scenarios for orphan penumbra formation have been proposed. They are schematically shown in Figure 1.
- 1.
- 2.The middle panel displays the picture proposed by Lim et al. (2013), i.e., the orphan penumbra as the result of an emerging Ω-loop trapped in the photosphere by overlying canopy fields (scenario 2, S2).
- 3.The bottom panel shows the drawing of the orphan penumbra interpretation provided by Jurčák et al. (2014), that is, a submerging horizontal field (scenario 3, S3).
In this work, we study in detail the two orphan penumbrae present in AR NOAA 11089, which were already analyzed by Jurčák et al. (2014). We focus on their evolution and topology to determine the formation mechanism behind orphan penumbrae. To this purpose, we use multiwavelength, high-resolution observations. The imaging and spectro-polarimetric data sets acquired by the Hinode satellite help us to follow the photospheric evolution of the orphan penumbrae and of their magnetic structure. Data taken at the Dutch Open Telescope (DOT) contribute to the analysis of the photospheric morphology of the orphan penumbrae and help to characterize the chromospheric regions above them. We also benefit from continuous observations of the SDO satellite, which allow us to identify the different formation mechanisms of the two structures observed since their first appearance. The paper is organized as follows: in Section 2, we describe the data sets, Section 3 reports on the evolution of the orphan penumbrae and on the analysis of spectro-polarimetric data; in Section 4, we discuss our findings; and in Section 5, we draw our conclusions.
2. OBSERVATIONS
Active region NOAA 11089 was observed for about 72 hr in 2010 July during a joint observing campaign involving ground-based telescopes, the DOT, and the Swedish 1 m Solar Telescope in La Palma (Canary Islands, Spain), and the Hinode and SDO satellites.
Active region NOAA 11089 appeared at the East solar limb on 2010 July 20. It was a recurrent AR being observed for about four months; it was numbered NOAA 11089 during Carrington rotation 2099, during which the AR appeared for the first time. Later it was labeled as NOAA 11100 (2010 August), NOAA 11106 (2010 September), NOAA 11112 (2010 October), and NOAA 11121 (2010 November) during the subsequent Carrington rotations. In 2010 December only large areas of opposite-polarity, diffuse fields could be observed in SDO magnetograms. Thus it can be considered as an active complex (Bumba & Howard 1965).
2.1. SDO Data Set
We use full-disk data acquired by the Helioseismic and Magnetic Imager (HMI; Schou et al. 2012) on board the SDO satellite (Pesnell et al. 2012), in the interval between 00:00:10 UT on July 21 and 12:00:10 UT on July 24. In particular, we have studied a data set of continuum filtergrams, magnetograms, and Dopplergrams acquired in the Fe i 617.3 nm line, in a partial field of view (FOV) of 200'' × 150'' centered on the AR NOAA 11089. The cadence of these data is 12 minutes. An SDO/HMI continuum map of AR NOAA 11089 acquired on July 23 is displayed in Figure 2.

Figure 2. Map of the continuum intensity of AR NOAA 11089 acquired by SDO/HMI. The white contours indicate the umbrae in the SOT/FG G-band filtergram (I = 0.5). The black-line boxes indicate the subFOV of SDO/HMI (solid line), the SOT BFI/FG FOV (dashed line), and the Hinode SOT/SP FOV (dotted line). The DOT FOV is not indicated because there are no simultaneous measurements with the Hinode satellite at the acquisition time of this SDO/HMI continuum image.
Download figure:
Standard image High-resolution imageThe continuum filtergrams have been normalized by using the average continuum intensity (Ic) of a region of quiet Sun placed at centrally symmetric heliographic coordinates. The velocities inferred by the Dopplergrams have been calibrated assuming that plasma in sunspot umbrae (Ic < 0.5) is globally at rest.
Additional information is provided by full-disk filtergrams in the He ii 30.4 nm line, taken by the Atmospheric Imaging Assembly (AIA; Lemen et al. 2012) aboard the SDO mission. We have extracted a subFOV that covers 240'' × 180'' in the interval between 00:10 UT on July 23 and 00:10 UT on July 27, with a cadence of 12 minutes.
2.2. DOT Data Set
The DOT (Rutten et al. 2004) observed AR NOAA 11089 on July 22 for about 40 minutes, from 07:48:29 UT until 08:27:29 UT, when the acquisition stopped because of the worsening of seeing conditions. Note that on July 23, the DOT did not operate due to poor seeing conditions. Filtergrams were acquired in the G band (430.5 ± 1 nm), with a spatial sampling of 0071 pixel−1 and a FOV of about 83'' × 68''. The DOT also performed spectroscopic scans along the profile of the Hα line at 656.3 nm, using a Lyot filter with a passband of 25 pm. Spectral images were acquired every 30 pm, from −90 pm to +90 pm with respect to the line center. These Hα observations have a spatial sampling of 0109 pixel−1 and cover a FOV of about 88'' × 93''. The cadence of all these DOT data is 30 s.
The DOT data sets have been processed with despeckle algorithms, reaching a spatial resolution of about 02. LOS velocities have been deduced from Doppler shifts estimated by a Gaussian fit to the Hα line profile, obtained by using the IDL MPFIT routine (Markwardt 2009). We have calibrated the LOS velocity values by taking the average line profile in the FOV as zero reference.
2.3. Hinode Solar Optical Telescope Data Set
The Solar Optical Telescope (SOT; Tsuneta et al. 2008) aboard the Hinode satellite (Kosugi et al. 2007) performed 18 raster scans over AR NOAA 11089 with the spectropolarimeter (SP), with a cadence of about 90 minutes from 22:16:19 UT on July 22 to 02:03:05 UT on July 24. The duration of each scan was 24 minutes. Full Stokes parameters I, Q, U, and V were acquired along the Fe i line pair at 630.2 nm, with a pixel size of 032 pixel−1 (fast map mode) and a FOV of about 123'' × 123''.
Simultaneously, the SOT Broadband Filter Imager (BFI/FG) acquired some series of filtergrams in the G band (430.5 ± 0.8 nm) and in the core of the Ca ii H line (396.85 ± 0.3 nm), covering a FOV of 1883 × 1156 without a regular cadence (about 3 hr for the G-band images and time intervals of some hours with a cadence of 5 minutes for the Ca ii H line filtergrams). The pixel size of these SOT BFI/FG data is 0109 pixel−1. The FOVs of the simultaneous SOT G-band image and SOT/SP raster scan, drawn over the SDO/HMI map of AR NOAA 11089, are also indicated in Figure 2.
All of the SOT/SP and SOT/FG data have been corrected for dark current, flat field, and cosmic rays obtaining level 1 data by using the standard IDL SolarSoft routines sp_prep and fg_prep, respectively.
The SOT/SP measurements in the continuum of the Fe i 630.2 nm pair have been normalized for the average intensity in the large quiet Sun region placed in the upper part of the SOT/SP FOV. All of the Stokes profiles have also been normalized to this value.
Maps of the physical parameters have been obtained from the standard Milne–Eddington (M-E) CSAC inversions (Hinode SOT/SP level 2 data), using the MERLIN inversion code. The least-squares fitting of the Stokes profiles retrieves the magnetic field strength |B|, inclination γ, and azimuth ϕ angles, LOS velocity vLOS, line strength η0, line broadening ΔλD, and magnetic fill fraction f. All of these parameters are considered constant along the line of sight.
The LOS velocities resulting from the M-E inversion have been calibrated assuming that plasma in sunspot umbrae (Ic < 0.5) is globally at rest. The 180° azimuth ambiguity has been solved by applying the Non-Potential Field Calculation (NPFC; Georgoulis 2005) code over the entire FOV of SOT/SP. We have supplied the code with each component of the vector magnetic field weighted by the magnetic fill fraction, where


calculated according to Landi Degl'Innocenti (1992). We have used uncertainties  and
and  , with a significance of 3σ, which correspond to the detection thresholds with the SOT/SP polarimetric sensitivity in the Fast Map Mode (103). The NPFC code also performs the transformation of the components of the vector magnetic field into the Local Solar Frame, providing the disambiguated azimuth and the longitudinal and horizontal components of B, i.e., Bz and Bh. The total magnetic field strength has thus been obtained from
2.4. Coalignment between Instruments
The precise coalignment of the different data sets is a critical point for multi-instrument observations. All of the 200'' × 150'' images (continuum filtergrams, magnetograms, and Dopplergrams) taken with SDO/HMI have been at first aligned with respect to a reference time image (23:58:26 UT on July 21) by taking into account the drift of the image center due to the solar differential rotation using the IDL SolarSoft package.
To coalign the SDO and the DOT images, we used a DOT G-band filtergram and a simultaneous SDO/HMI continuum image from those acquired with 45 s cadence, using the IDL SolarSoft mapping routines to take into account the different pixel sizes. The displacement between them has been obtained with cross-correlation techniques.
An analogous procedure has been used to coalign SOT/FG G-band filtergrams and SDO/HMI continuum images. The SOT/FG filtergrams in the Ca ii H line have been aligned to the G-band filtergrams, according to the information provided by Shimizu et al. (2007) about the SOT internal offset. The SOT/SP continuum maps have been aligned to each other, using the first one taken at 22:16 UT on July 22 as reference. Then, the SOT/SP sequence of continuum images has been cross-correlated with the SOT/FG G-band aligned filtergrams. We estimate the accuracy of this procedure to be on the order of ±02.
3. RESULTS
3.1. The Evolution of Orphan Penumbrae
The large-scale evolution of AR NOAA 11089 from July 21 to July 24 during its emergence phase is clearly visible in SDO data. A subFOV of 80'' × 80'', encompassing the central part of the AR, has been selected to study in more detail the zone where the orphan penumbrae are located, as shown in Figure 2.
Figures 3(a) and (b) display a sequence of the SDO/HMI continuum images (left panels) and the cospatial magnetograms (right panels) in this subFOV, for different times between 18:10 UT on July 21 and 18:10 UT on July 23. These sequences reveal the photospheric configuration of the AR (see also the SDO movies in the online version of this paper). Two orphan penumbrae are found in the FOV, between the main sunspots of the AR: an eastern orphan penumbra (EOP) and a western orphan penumbra (WOP), which are located at [−610'', −445''] and at [−595'', −450''], respectively, at 00:10 UT on July 22 (see Figure 3(a), middle-left panel).
Figure 3. (a) Left panels: sequence of SDO/HMI continuum filtergrams for the subFOV indicated in Figure 2, from 12:10 UT on July 21 to 08:10 UT on July 22. Boxes (dotted line) indicate the eastern orphan penumbra (EOP) and the western orphan penumbra (WOP). The box (solid line) over the image acquired at 08:10 UT on July 22 frames the FOV of the simultaneous DOT observations displayed in Figure 5. Right panels: simultaneous sequence of SDO/HMI magnetograms, with LOS velocity isocontours. Images are saturated at ±1000 G. Color contours refer to different values of LOS velocity: −3, −1.5 km s−1 (upward motions, blue colors); +1.5, +3 km s−1 (downward motions, red colors). (b) Same as in (a), from 22:10 UT on July 22 to 18:10 UT on July 23.
(An animation of this figure is available in the online journal.)
Download figure:
Video Standard image High-resolution imageThe history of the EOP and the WOP is quite different. The EOP is being formed while the main, opposite-polarity sunspots of AR NOAA 11089 are separating from each other during the emergence phase of the AR and are losing part of their own penumbra. The WOP, on the other hand, appears to form independently at around 16:00 UT on July 21 at the west side of the EOP at [-640'', −440''], as clearly shown in the SDO/HMI continuum movie in the online version of this paper. Later, the WOP grows in size while migrating westward.
Both of these orphan penumbrae appear to fragment during their evolution until they disappear. On July 23, the WOP occupies an area of about 23'' × 5''. Eventually, the EOP fades at around 22:00 UT on July 23, while the WOP disappears at around 06:00 UT on July 24. During the fragmentation of the WOP some pores are formed at its edges, surviving its disappearance.
The SDO/HMI LOS velocity contours are displayed over the magnetic field maps in Figures 3(a) and (b), (right panels). The SDO/HMI magnetograms movie in the online version of this paper shows what is summarized in the following description. The sequence shows that the areas covered by orphan penumbrae are characterized by plasma motions that are on average comparable in magnitude with the Evershed flow seen at the western edge of the sunspot south of the FOV, stronger than those found in the other regions of the AR (see Figure 3(a), top right and middle right panels). However, these motions locally become even more intense. In particular, the WOP shows strong upward motions, up to −3 km s−1, during the first phase of its development, when its filaments appear to be linked with the EOP (Figure 3(a), bottom panels). However, we cannot exclude that these generalized upflows belong to a transient structure formed by penumbral filaments along a negative polarity patch connecting the EOP and the WOP as they separate. It is very difficult to distinguish this structure from the WOP, where a small, westernmost part exhibits downflow motions. Later, when the WOP detaches from the EOP and moves westward, upflows are found only in its central part, while downward motions, reaching up to +3 km s−1, are established at both its eastern and western sides (Figure 3(b), top right panel). Meanwhile, the EOP, which had not shown significant motions before, exhibits moderate upflow motions, up to −2 km s−1, which could be attributed to a flux emergence episode and the structure fragments (see Figure 3(b), top and middle panels). Such peculiar motions decrease in time in both the EOP and the WOP. In the latter, the upward motions vanish well before the downflows at its sides, which are observed until the disappearance of the structure (compare Figure 3(b), middle and bottom panels).
Because of the projection effects in longitudinal magnetograms in these SDO/HMI observations far from the disk center, the analysis of the detailed magnetic configuration of the EOP and the WOP shown in Figures 3(a) and (b), right panels, during their evolution is not obvious. It is hard to say whether the orphan penumbrae are single-polarity structures or are placed over a mixed-polarity region. This information has been provided from Hinode SOT/SP full spectro-polarimetric measurements, as will be discussed in Section 3.5.
3.2. Analysis of the Upper Atmospheric Layers
We have also investigated whether the upper atmospheric layers were affected in some way by the presence of orphan penumbrae. Figure 4 (top) shows a map of AR NOAA 11089 taken by AIA in the He ii 30.4 nm line. The He ii 30.4 nm line is one of the strongest lines in the EUV observed in the solar spectrum, providing information on the upper chromosphere or lower transition region (Andretta et al. 2003, 2012). We see that there is a filament on the north side of the AR that does not lie near the orphan penumbrae.

Figure 4. Top: map of AR NOAA 11089 acquired by SDO/AIA in the He ii 30.4 nm line at 06:10 UT on July 23. Color contours refer to photospheric isophotes in the simultaneous SDO/HMI continuum intensity maps. The dotted line box frames the SDO/HMI FOV shown in Figure 3. Bottom: time sequence of images acquired by SDO/AIA in the He ii 30.4 nm line, showing the evolution of AR NOAA 11089 at low coronal heights from 06:10 UT on July 23 to 06:10 UT on July 26, with a cadence of 24 hr. The FOV is the same as indicated within the dotted line box in the image on the top. The boxes (dotted line) over the image acquired on July 23 indicate the EOP and the WOP, as in Figure 3.
Download figure:
Standard image High-resolution imageIn Figure 4 (bottom), we also display four maps taken by AIA in the He ii 30.4 nm line, every 24 hr during four days from July 23 onward. It appears clear from the sequence shown in this figure that there is no signature of the presence of filaments lying above the orphan penumbrae in the upper atmosphere during the days that follow the appearance of these structures in the photosphere.
3.3. DOT Observations
DOT observations allow us to study in more detail the fine structure of the EOP and WOP with better spatial resolution than SDO/HMI measurements. The DOT observed the AR about 14 hr after the appearance of the WOP, at around 08:00 UT on July 22. The orphan penumbrae structure is clearly visible at the photospheric level in the continuum of the Hα line, as displayed in Figure 5 (top panel). The DOT images in the Hα line core (see Figure 5, bottom panel) show that at the chromospheric level there is no evidence of a well-defined counterpart of the photospheric orphan penumbrae. The area occupied by them appears to be covered by chromospheric fibrils, being embedded in a large-scale arch filament system (AFS; Bruzek 1967; Spadaro et al. 2004; Zuccarello et al. 2005) connecting the main sunspots in the chromosphere. There are fibrils that start on the edge of the orphan penumbrae and connect to regions that are about two to three times their size away. Those starting in the EOP seem to connect this structure to the pore group with partial penumbra at the center of the FOV. The fibrils starting on the edge of the WOP might go to the small pores found northwest of the orphan penumbra.

Figure 5. Top: DOT map showing an image of AR NOAA 11089 in the Hα continuum. The rectangle frames the portion of the FOV displayed in Figure 6. Bottom: simultaneous DOT intensity map in the Hα line core. Contours represent isophotes in the photosphere of the orphan penumbrae intensity from the simultaneous DOT G-band filtergram.
Download figure:
Standard image High-resolution imageA chain of granules with enhanced emission is seen at the southern boundary of the WOP, delineating its border (see Figure 5, top panel). This is clearly evident in the simultaneous G-band filtergrams, as shown in Figure 6 (top panel). At that time, the WOP seems to be linked by filamentary structures with the EOP (Figure 6, top panel at [−560'', −450'']). The latter, in turn, appears to be connected with the upper part of the penumbra of the southern spot of the AR (Figure 6, top panel at [−565'', −460'']). Whereas the fibrils of the EOP extend across its semimajor axis, the fibrils of the WOP are highly inclined with respect to this direction. Note that, at this time, some penumbral filaments of the WOP might belong to the transient structure discussed in Section 3.1. The extent of each one of the orphan penumbrae is comparable with the area covered by regular penumbrae, spreading over an area even larger than umbral regions, as also shown in SDO/HMI continuum images.

Figure 6. DOT maps relevant to the data acquired at 07:50:59 UT. Top panel: G-band image showing the two orphan penumbrae. Second panel: intensity map in the Hα blue wing (−90 pm). Third panel: intensity map in the Hα line center. Bottom panel: Doppler velocity map inferred from DOT measurements along the Hα profile. Contours represent isophotes in the photosphere from the simultaneous DOT G-band filtergram. The FOV shown in these images is indicated with a box in Figures 3 (third row, first column) and 5 (top panel).
Download figure:
Standard image High-resolution imageA large number of Ellerman bombs (Ellerman 1917; Georgoulis et al. 2002; Watanabe et al. 2011; Vissers et al. 2013) are found in the wings of the Hα line throughout the entire FOV during these DOT observations. A clear example is visible in the map taken in the blue wing of the line (−90 pm) displayed in Figure 6 (second panel) at [−572'', −442'']. Other brightenings are distributed around the edges of the orphan penumbrae. This is an indication that vigorous flux emergence is occurring in the AR (see, e.g., Archontis & Hood 2009). Figure 6 (second panel) also shows the presence of fibrillar structures over the orphan penumbrae elongating across them, similar to that found in the G-band filtergrams (compare with Figure 6, top panel).
The third panel of Figure 6 shows the regions of the orphan penumbrae in the Hα line center. The dark fibrils in these images correspond to a formation height higher than regions with enhanced intensity (Leenaarts et al. 2012), such as those found to the south and east of the map. It seems quite clear that in the chromosphere the fibrils extend well beyond the orphan penumbrae encompassing them, whereas their southern extremities are anchored close to the southern borders of these structures. The chromospheric fibrils do not have a close morphological resemblance to the photospheric orphan penumbrae.
In the EOP, the LOS velocity shown in Figure 6 (bottom panel) exhibits a complex pattern: the northern part of the structure is characterized by upflows, like the neighboring fibrils forming the central part of the AFS. The other parts of the EOP show a more complicated behavior, with localized patches of both upflows and downflows, stronger at the edge. Upward motions are found in correspondence with the central zone of the WOP at [−554'', −454''], with an average value of ∼ − 5 km s−1 and a maximum of about −9 km s−1, whereas downflows are observed at both sides of the structure (Figure 6, bottom panel). These downward motions are on average of ∼ + 2 km s−1, reaching values up to +7 km s−1.
There are no significant changes in the structures during the 40 minutes covered by these observations. Unfortunately, the DOT did not follow the successive evolution of the EOP and WOP in the chromosphere. However, although these measurements lack information about the magnetic configuration of the orphan penumbrae, such DOT observations represent for us a unique possibility to have information about the morphology and dynamics of these structures in fine detail in the chromosphere.
3.4. SOT Imaging Observations
Hinode G-band and Ca ii H filtergrams provide some more information at high spatial resolution about the photospheric evolution of the orphan penumbrae. They refer to different heights in this atmospheric level. According to Jess et al. (2012), the formation height of the G band with respect to τ500nm = 1 would be at around 100 km, a value comparable with the results of Shelyag et al. (2004). Because of the large width of the SOT/BFI Ca ii H filter, Hinode Ca ii H images mainly include contributions from the upper photospheric layers at around 300 km (see Carlsson & Stein 1997; Carlsson et al. 2007). Contributions from the chromospheric level are present in correspondence with regions with strong magnetic activity.
Figures 7 and 8 display two partial FOVs of these SOT/BFI filtergrams containing the EOP and the WOP, respectively. Spectro-polarimetric data from these regions will be analyzed in detail in Section 3.5. The images show that the extent of the EOP and the WOP is, more or less, the same in the G band and in the Ca ii H line.

Figure 7. Left: Hinode maps showing the EOP in SOT/BFI G-band filtergrams, with a time interval of about 14 hr. Right: simultaneous, cospatial Hinode images of the EOP in the SOT/BFI Ca ii H filtergrams.
Download figure:
Standard image High-resolution image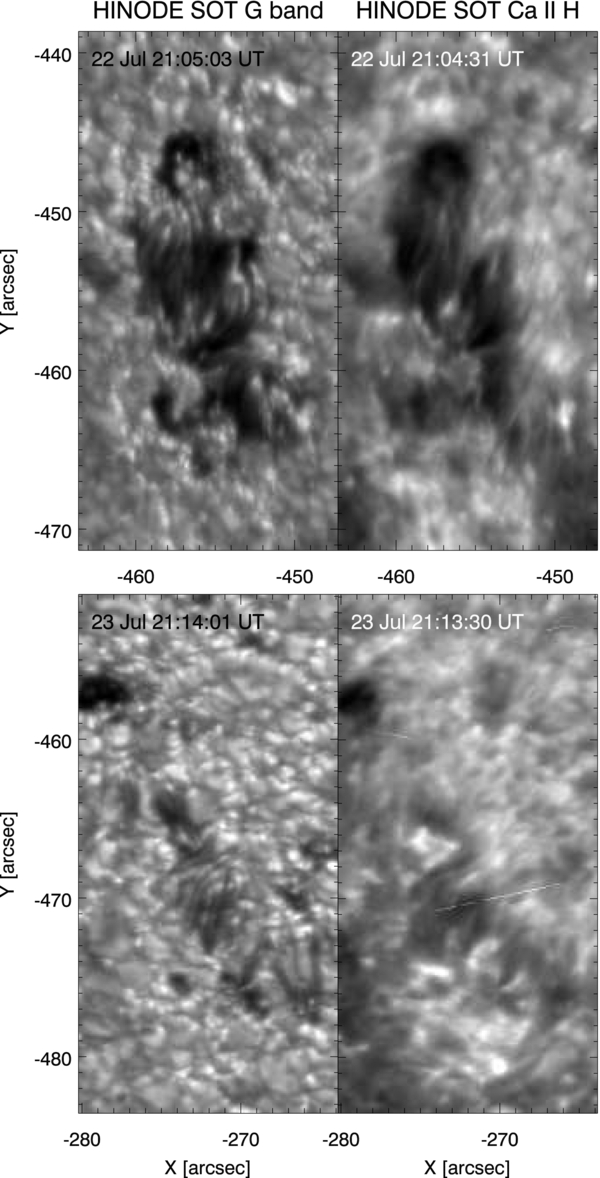
Figure 8. Same as in Figure 7, for the WOP, with a time interval of about 24 hr.
Download figure:
Standard image High-resolution imageFigure 7 indicates that areas of quiet Sun between the photospheric filaments of the EOP are covered by fibrils at higher atmospheric levels (see, e.g., the region at [−482'', −440''] on July 22). However, on July 23, some Ca ii H fibrils of the EOP appear slightly shorter than the filaments observed in the G band: note, e.g., the length of the fibrils at [−365'', −462''] and at [−376'', −460''].
Figure 8 shows that on July 22, in the upper photosphere, fibrillar structures connect the pores at the edges of the WOP over the bright granules at the top of the feature with parts of that same structure at [−458'', −449'']. These connections vanish in the following hours, and on July 23 the filaments appear the same in the two bands. At that time, small regions along the southeastern edge of the WOP show local brightenings in the Ca ii H line, indicating an enhancement of the magnetic activity in the low chromosphere: see, e.g., the triangle-shaped feature centered at [−275'', −467'']. Penumbral filaments of the WOP, which get shorter and shorter as time goes by, are seen until the end of these Hinode SOT/BFI observations.
3.5. Analysis of the Spectro-polarimetric Data
Hinode started acquiring SP raster scans some hours after the DOT observations. It began its measurements at 22:16 UT on July 22, more than one day after the appearance of the WOP. A partial view of the SOT/SP FOV is shown in Figure 9 (top panel). This figure shows the intensity map in the continuum of the Fe i line at 630.2 nm, centered over the AR. The EOP and the WOP are clearly visible at [−435'', −455''] and at [−410'', −460''], respectively. We can see that at the northern and southern edges of the WOP there are some pores, whereas the EOP has small pores in the southeastern and southwestern parts. Figure 9 (bottom panel) clearly points out that these orphan penumbrae are cospatial with regions of opposite polarity within the inner part of the AR.

Figure 9. Top: SOT/SP image of the continuum intensity in the Fe i 630.2 nm line. The boxes frame the EOP (left) and the WOP (right), within a subFOV of about 24'' × 305 used in Figure 11 and of about 24'' × 37'' used in Figures 12–14, respectively. The colored crosses indicate the pixels whose Stokes profiles are displayed in Figure 10. The FOV shown here is also indicated in Figure 2. Bottom: simultaneous SOT/SP map of the longitudinal magnetic field.
Download figure:
Standard image High-resolution imageWe have investigated in some detail the shape of the Stokes profiles in the orphan penumbrae, finding some peculiarities. The importance of having a complete interpretation of line profiles has been shown, for instance, by Viticchié et al. (2011) for the analysis of quiet Sun regions. Figure 10 displays a sample of the Stokes profiles acquired by SOT/SP emerging from the pixels indicated in Figure 9 (top panel) with colored crosses, compared with three profiles coming from pixels in an umbra, a regular penumbra, and a quiet Sun network point in the same FOV.
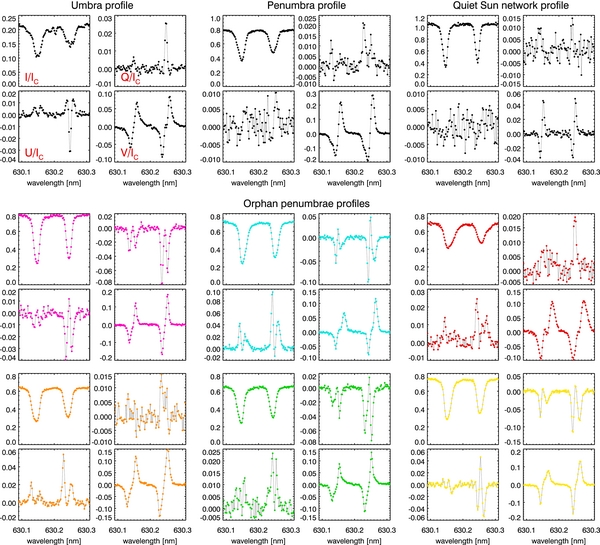
Figure 10. Stokes I, Q, U, and V profiles acquired by SOT/SP in typical magnetized areas of the photosphere (umbra, penumbra, network) and in individual points of both the EOP (Column 1) and WOP (Columns 2 and 3). Colors identify the profiles of the pixels indicated with crosses in Figure 9.
Download figure:
Standard image High-resolution imageStokes I profiles show that in the orphan penumbrae the continuum intensity ranges between 65% (e.g., orange and green profiles) and 80% (e.g., purple profile) with respect to that of the quiet Sun, as in regular penumbrae (Schlichenmaier 2003). In some points, Stokes I profiles are broadened (yellow profile), asymmetric with a wing steeper than the other one (blue and green profiles) or both of the effects (orange and red profiles).
Stokes Q, U, and V components show asymmetric profiles in individual points of the EOP and WOP. We are able to estimate the asymmetry by calculating the ratio between areas bounded under each Stokes profile, ΔS, according to Landi Degl'Innocenti & Landolfi (1983). In Table 1 we report the ΔS values calculated in the Fe i 630.15 nm and Fe i 630.25 nm lines.
Table 1. ΔS Values
| λ 630.15 nm | λ 630.25 nm | |||||
|---|---|---|---|---|---|---|
| Color | ΔQ | ΔU | ΔV | ΔQ | ΔU | ΔV |
| Yellow | −0.08 | −0.02 | 0.08 | 0.05 | 0.27 | 0.08 |
| Blue | −0.07 | −0.04 | 0.21 | 0.02 | −0.09 | 0.30 |
| Orange | −0.26 | −0.27 | 0.03 | −0.35 | −0.25 | 0.06 |
| Red | −0.11 | −0.15 | 0.14 | −0.65 | 0.03 | 0.17 |
Note. Colors refer to the profiles shown in Figure 10.
Download table as: ASCIITypeset image
The green and purple profiles do not show significant asymmetries in the Stokes magnetic components. The yellow profile exhibits moderate asymmetries in Stokes Q and U, on the same order as those found in the blue profile. The latter shows more pronounced asymmetries in Stokes V. Larger ΔU and ΔQ are found in the orange profile. Very large asymmetries are found in the red profile. In the same point, we have already noticed that the Stokes I components are highly broadened. Furthermore, Stokes V components exhibit a strong separation between the lobes, which corresponds to a magnetic field strength of about 1300 G along the line of sight. We also note the presence of secondary lobes, which are the signature of the magneto-optical effect in the Fe i 630.2 nm pair (Beckers 1969; Wittmann 1971). We notice that in the majority of the points analyzed above, the values of ΔV are smaller than those of ΔQ and ΔU, but the red and blue peaks of Stokes V profiles are often very different in amplitude from each other.
These asymmetries indicate the presence of a multicomponent magnetic atmosphere in the pixels (e.g., Schlichenmaier & Collados 2002; Bellot Rubio et al. 2004; Franz & Schlichenmaier 2013). Thus, our findings point out that these features have differently oriented magnetic components and velocity shifts along the line of sight. The small sample shown here suggests that orphan penumbrae also have the typical "uncombed" magnetic topology found in normal sunspot penumbrae (Solanki & Montavon 1993; Thomas & Weiss 2008). A more sophisticated analysis, with the use of an M-E inversion with two magnetic components or with a full radiative transfer approach, could provide some more information about the field strengths and velocities that cause these asymmetries.
To further study the plasma properties and dynamics in these regions, we focused our attention on the EOP and WOP, by analyzing in detail the evolution of the physical parameters retrieved by the M-E inversion in the subFOVs shown in Figure 9.
Figure 11 (top panels) displays the sequence of SOT/SP maps with the evolution of the plasma motions in the EOP and of the magnetic flux concentrations nearby. The figure shows the contours of LOS velocities overplotted on the continuum intensity maps. A movie with this sequence is provided in the online version of this paper. We find that the EOP exhibits upward motions that are stronger than −3 km s−1 in its central part at [−468'', −450''] at 22:16 UT. These flows are also observed at this time in SDO observations (see Figure 3, 22:10 UT at [−470'', −450'']). Twelve hours after the beginning of Hinode observations, downflows establish at the eastern part of the structure, within an area that expands with time (see Figure 11, 12:55 UT top panels at [−363'', −460'']). In the meantime, the EOP shrinks and finally is no longer visible from 19:40 UT on.
Download figure:
Video Standard image High-resolution imageFigure 11. Top row: sequence of SOT/SP maps showing the continuum intensity of the EOP. White (black) contours indicate the magnetic flux concentrations above a threshold of +(−)1200 G. Color contours refer to different values of LOS velocity: −3, −1.5 km s−1 (upward motions, blue colors); +1.5, +3 km s−1 (downward motions, red colors). Bottom row: simultaneous sequence of cospatial SOT/SP maps showing the longitudinal magnetic field. Red contours indicate the magnetic PILs; arrows indicate the horizontal magnetic field, above a threshold of 100 G. The lengths of the arrows are proportional to the intensity of Btran, with their direction pointing according to the azimuth angle.
(Animations (a and b) and a color version of these figures are available in the online journal.)
Download figure:
Video Standard image High-resolution imageFigures 12 and 13 (top panels) display a similar sequence of SOT/SP maps relevant to the evolution of the plasma motions in the WOP. A movie with this sequence is also provided in the online version of this paper. Peculiar plasma motions are found in the WOP. At the beginning of SOT/SP observations (22:16 UT), there are three patches with LOS velocities larger than ±3 km s−1. These patches cover the area occupied by the WOP in the continuum map. In particular, the central patch at [−442'', −458''] exhibits upflows, whereas the others are placed at the eastern ([−445'', −458'']) and southern ([−441'', −464'']) part of the WOP and are characterized by downward motions. These LOS motions do not occur near the small flux concentrations located at the extremities of the orphan penumbra but only along the filaments of the structure.
Download figure:
Video Standard image High-resolution imageDownload figure:
Video Standard image High-resolution imageDownload figure:
Video Standard image High-resolution imageDownload figure:
Video Standard image High-resolution imageSuch peculiar motions, also seen in SDO observations, last for at least ∼12 hr in Hinode observations. From a comparison between Figure 3(b) (left panels) and Figures 12 and 13 (top panels), it appears evident that these plasma motions were already present when Hinode observations began.
The plasma motions decrease in intensity as time goes by. The central, upflowing patch diminishes in size and vanishes in ∼12 hr. We notice that the fragmention of the WOP occurs exactly where the upflowing patch was seen before (compare the maps at 07:59 UT and 12:55 UT). The downflowing patches also decrease in size, whereas the maximum values of LOS velocities remain above +3 km s−1. These downward motions are observed in the maps until the end of the observations, when they are cospatial with a small, filamentary remnant of the WOP still visible in the southernmost part of the FOV.
The simultaneous sequences of maps of the longitudinal and horizontal components of the vector magnetic field are shown in Figure 11 (bottom panels) for the EOP and in Figures 12 and 13 (bottom panels) for the WOP. These figures allow us to follow the evolution of the magnetic configuration of the orphan penumbrae, which would not be possible from longitudinal SDO/HMI magnetic field measurements. The sequences reveal that the WOP straddles the PIL until the end of SOT/SP observations. The EOP shows a different topology, as it also lies close to a PIL, but only a small part of its northern region hangs out of the opposite polarity region.
In the WOP, the horizontal magnetic field is almost orthogonal to the PIL and has a normal-polarity configuration (Kippenhahn & Schlüter 1957): the magnetic field lines are mainly directed from the positive to the negative region in the longitudinal field map throughout the observations. However, some field lines show shearing, as they are quite inclined or nearly parallel to the PIL: see, e.g., the arrows located at [−404'', −472''] on July 23 at 03:04 UT (Figure 12, middle bottom panel), and those located at [−330'', −474''] on July 23 at 12:55 UT (Figure 13, left bottom panel). The horizontal field component decreases in strength as the WOP evolves. At the beginning there are points with horizontal field larger than 1500 G, up to ∼1800 G, whereas at the end of the sequence of SOT/SP raster scans, very few points reach a horizontal field of about 1000 G.
The EOP, in contrast, shows a sheared configuration at the beginning of the SOT/SP observations, the arrows pointing almost parallel to the PIL (see, e.g., Figure 11, bottom panel at 22:16 UT at [−471'', −451'']). This severe shear seems to decrease with time, with the horizontal field becoming more and more orthogonal to the PIL (see Figure 11, bottom panels at 03:04 UT and 12:55 UT). Moreover, the horizontal field component decreases in strength as the EOP becomes smaller in a less dramatic manner than in WOP.
Figure 14 shows the SOT/SP maps of the physical parameters of the WOP, retrieved by the M-E inversion, relevant to the raster scan acquired at 03:04 UT. The total magnetic field is stronger within the flux concentrations coinciding with the pores seen in the continuum map, reaching a maximum of ∼1800 G, but it is also significantly high along the PIL present in the region. The WOP has an average magnetic field strength of ∼1000 G, calculated within the continuum contours without taking into account the pores.
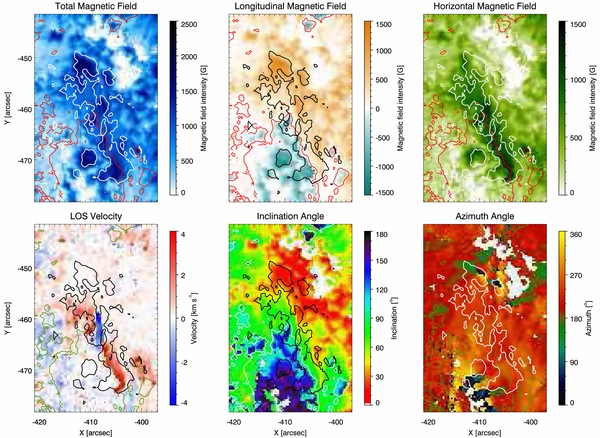
Figure 14. SOT/SP maps relevant to the data acquired by Hinode during the raster scan begun at 03:04 UT on July 23. The maps show the physical parameters of the WOP. Top row: (from left to right) total, longitudinal, and tranversal magnetic field. Bottom row: (from left to right) LOS velocity, inclination, and azimuth angles. The FOV is the same as the box shown in Figure 9. White (black) contours represent isophotes in the photosphere of the WOP from the Fe i 630.2 nm line continuum intensity map. Red (green over LOS velocity and azimuth angle maps, white over inclination angle map) lines represent PILs. The white background represents pixels with total polarization <1%, which are not considered.
Download figure:
Standard image High-resolution image
The average longitudinal magnetic field strength (550 G) is lower than the average horizontal component (800 G). The latter has a maximum value of about 1300–1400 G in proximity to the PIL. In the WOP, the inclination of the vector magnetic field is on average close to |60°| with respect to the normal to the photosphere, and the azimuth angle is quite homogeneous, with a value of about 240° measured counterclockwise with respect to the direction of solar west, and a standard deviation of ∼18°. The angle between the average magnetic field azimuth and the PIL is about 110°.
In the SOT/SP maps of LOS velocity shown in Figure 14 we find a central upflow with a maximum value of −4 km s−1, and downflows up to ∼6 km s−1 at the edges of the structure. It is worth noting that these peculiar plasma flows are exactly located along the PIL. This does not mean that the flows in the WOP are perpendicular to the magnetic field because we can only measure the LOS component of the velocity vector. Note also that the strongest upward motions in the EOP are cospatial with the PIL (compare Figure 11, top and bottom panels).
4. DISCUSSION
We have studied two orphan penumbrae that appeared in AR NOAA 11089 on 2010 July 22. The SDO/HMI observations have allowed us to investigate the evolution of these structures since their formation. These orphan penumbrae show a different origin. The EOP seems to be formed by the remnants of the penumbral filaments left behind by the main sunspots of the AR during their separation, while the AR is emerging. The WOP appears on the west of the EOP as a result of flux emergence. Both the EOP and the WOP remain in the solar photosphere for about three days, after which they fragment and finally disappear.
The SDO/HMI measurements of the LOS velocities indicate that persistent peculiar plasma motions were cospatial with these orphan penumbrae. In particular, the central part of the WOP is characterized by velocities up to −3 km s−1, whereas we have found downflows at both edges of the structure of the same order of magnitude. These velocities are comparable to those found in the sunspot penumbrae nearby, with a few exceptions where they are even larger.
The DOT data show that in the G-band and Hα continuum, the EOP appears to be linked by fibrils with the southern spot of the AR. A chain of bright points is seen at the southern border of the WOP. The observed orphan penumbrae have no chromospheric counterpart in the Hα line core, whereas in the lower chromosphere there are fibrils above them. Moreover, the orphan penumbrae are embedded in a large-scale AFS connecting the main sunspots of the AR. They also show some peculiar motions at this atmospheric level: there are upflows in the central part of the WOP and downflows at both of its sides.
The SOT/BFI filtergrams in the G band and in the Ca ii H line show that the extent of the EOP and the WOP is similar in the two bands. In the upper photosphere, fibrillar connections are present between different parts of the WOP, which disappear with time.
Spectro-polarimetric measurements performed by the Hinode SOT/SP show that asymmetries in the Stokes Q, U, and V components are present in some points of the orphan penumbrae. This suggests that such structures have an uncombed magnetic topology, as regular penumbrae have.
The maps of the physical parameters, obtained from an M-E inversion of these data, indicate that the penumbral filaments of the orphan penumbrae connect regions of opposite magnetic polarity. The WOP lies above a neutral line (see the inclination and longitudinal field maps in Figure 14) and has a strong horizontal field, up to ∼1800 G, that decreases with time (see the sequence shown in Figures 12 and 13 and the movie in the online version of this paper). Peculiar plasma flows are also found in the LOS velocity maps deduced from the inversion: a central upflow up to −4 km s−1 that lasts for ∼8 hr and strong downflows of ∼4–6 km s−1 toward the ends of the structure (see the LOS velocity map in Figure 14), which persist with time even if they slightly decrease in intensity. These strong plasma motions occur along the PIL.
At the beginning of the SOT/SP observations, the EOP shows a sheared configuration of the field lines along the PIL. The shearing of the magnetic field and the horizontal field component slightly decrease with time. Upflows stronger than −3 km s−1 initially fill the area of the EOP, whereas in subsequent times downflows are found at the eastern part of the structure while it is shrinking. Also, in the EOP the strong plasma motions occur along the PIL.
Our findings can be interpreted in the context of the scenario of penumbral formation. As already mentioned, Leka & Skumanich (1998) proposed that the penumbra forms from emerging flux that is trapped at the photosperic level, when the magnetic pressure from the pre-existing horizontal field in the chromosphere acts in suppressing the flux emergence. Shimizu et al. (2012) and Romano et al. (2013, 2014) supported this scenario because they detected penumbra-like Ca ii structures before the photospheric penumbra appeared. The importance of the overlying horizontal field for the development of the penumbra was also demonstrated in the numerical simulations carried out by Rempel (2012).
Our observations show that the analyzed orphan penumbrae form during the emergence phase of the AR, when an AFS overlies the region between the main sunspots of the AR. We can argue that new emerging flux could find an obstacle in continuing its rise, remaining trapped in the low atmospheric layers. The emerging flux system, being mostly horizontal, would form filamentary structures as a result of magnetoconvection in inclined fields (see, e.g., Thompson 2005; Kitiashvili et al. 2010, 2011). Thus, the AFS might represent the physical structure able to trap the emerging flux (the missing link in the scenario proposed by Leka & Skumanich 1998) for the penumbral formation in a magnetic configuration like the one we found in these observations.
In order to determine whether our findings allow us to interpret our observations within one of the scenarios described in the Introduction (see also Figure 1), we will examine each scenario separately.
- 1.S1. Kuckein et al. (2012a, 2012b) suggested that orphan penumbrae observed inside ARs are related to AR filaments lying in the upper atmospheric layers. They found an inverse magnetic configuration in the photosphere, representing the bottom part of the flux rope. In our data, we find a normal configuration in correspondence with the PIL near both the EOP and the WOP. For the sake of completeness, we note the EOP shows a sheared configuration, slowly decreasing with time. However, Figure 4 clearly shows the absence of any filament in the upper chromosphere above the orphan penumbrae during the days following our observations. Only after a complete Carrington rotation, AR NOAA 11100 exhibits a filament, which appears tilted at 90° with respect to the direction of the PIL of the WOP found in our analysis, so the relation with the previous emergence of the orphan penumbrae is hard to prove.This result rules out the scenario S1 proposed by Kuckein et al. (2012a, 2012b) to explain the origin of all kinds of orphan penumbrae, even if this may apply in some cases, as in the one studied by those authors. Note that they observed the orphan penumbra during the decaying phase of AR NOAA 10781, when it is reasonable to suppose that magnetic fields connecting the opposite polarities of the AR had decreased in intensity. This could allow the "sliding doors" effect (Okamoto et al. 2008; MacTaggart & Hood 2010), which occurs when the opposite polarities of a long arcade structure move apart and then come together and, at the same time, the orientations of upflowing horizontal magnetic fields along the PIL gradually evolve from a normal-polarity configuration to an inverse-polarity one. These are signatures of the emergence of a twisted flux rope from the subphotospheric layers, which can surface into the photosphere in an easier manner when the overlying, preexisting fields of the AR decrease in intensity.
- 2.S2. Lim et al. (2013) interpreted the orphan penumbra observed in monochromatic images of the photosphere and chromosphere as the upper horizontal part of emerging fields, supporting the scenario suggested by Leka & Skumanich (1998). They stated that these fields belong to an Ω-loop rising from the subphotospheric layers that remains trapped in the photosphere by the overlying canopy fields. However, due to the lack of any spectroscopic or spectro-polarimetric measurements from which one could infer the dynamics and the magnetic configuration of the region analyzed by Lim et al. (2013), it is quite difficult to consider this result to be settled.The scenario S2 seems to be the one that best fits our observations, at least as far as the WOP is concerned: the clear phase of flux emergence in this area, as well as the several Ellerman bombs recorded, are in agreement with such a scenario. More questionable is the interpretation of the EOP within S2 because the evolution of this feature indicates that it forms as a consequence of penumbral filaments separating from a sunspot. However, we observe flux emergence episodes that modify the intensity, magnetic, and velocity structure of the EOP with a continual emergence and spreading of flux in this area. Note also that both the EOP and the WOP show regions where the Stokes profiles are anomalous, indicating an uncombed configuration of the penumbral filaments. This characteristic, coupled with the persistent and strong upflows and downflows observed in both penumbrae, provides a quite complex scenario that, even when fitting in S2, needs to be further investigated, as explained in the following section.
- 3.S3. Jurčák et al. (2014) suggested that orphan penumbrae are the manifestation of submerging Ω-loops. As we analyzed the same two orphan penumbrae they studied in AR NOAA 11089, we can affirm that Jurčák et al. (2014) correctly reported their findings, but this is only part of the history. Indeed, Hinode observations covered only the late stages of these orphan penumbrae because they began more than one day after the appearance of the structures (see Figure 3(b), left panels).Indeed, there are a few points supporting scenario S3: we observe fibrillar connections over the WOP in the upper photosphere that disappear with time. Moreover, we detect upflows that initially fill the central part of the EOP and the WOP and that decrease with time, whereas downflows are found at the edge of the structures while the latter shrink. Nevertheless, our analysis of SDO/HMI measurements shows that the orphan penumbrae emerged while the main sunspots were separating from each other, so the orphan penumbral fields cannot just be submerging Ω-loops. The SDO movie definitely shows that there are several episodes of flux emergence before Hinode observations that coincide with the formation of the orphan penumbrae.
5. CONCLUSIONS
It remains unclear why orphan penumbrae are so rarely observed if the mechanism that leads to their formation is the trapping of new emerging flux in the low atmosphere. It is possible that the conditions that cause the onset of magnetoconvection in these inclined, rather horizontal fields are satisfied only for particular values that balance the buoyancy force of the emerging structures and the magnetic pressure above them, as with floating objects on a liquid. Note also that AR NOAA 11089 is highly complex, surviving many solar rotations. The large amount of emerged flux with an intricate magnetic configuration may contribute to the trapping of new emerging flux near the photosphere. This could suggest that adequately complex ARs may be required for such structures to form.
The results of our analysis indicate that, at least for the WOP, the most plausible interpretation is that emerging flux is trapped in the low atmosphere by the overlying canopy field (i.e., within S2). Less straightforward is the interpretation of the formation of the EOP: this seems to be the result of a process able to separate penumbral filaments from the sunspot umbracombined with flux emergence. Although the structures do not maintain the same magnetic identity over the course of time, the continual flux emergence and spreading in these regions suggest that we do not observe a unique, persistent but evolving Ω-loop trapped beneath the chromosphere. Rather, we think that a repeated, complex surfacing of emerging flux tubes belonging to the main flux strand that forms the AR occurs in these areas.
With regard to the peculiar plasma motions found in these structures, our results at first blush support the findings of Jurčák et al. (2014), who suggested that the LOS velocities observed in the orphan penumbrae were similar to the Evershed flow found in regular penumbrae, likely due to a siphon flow mechanism (see, e.g., Thomas 1988; Montesinos & Thomas 1997). Such persisting flows have to be attributed to horizontal motions projected along the LOS.
Nevertheless, we have noticed in SDO/HMI data that the plasma motions in the orphan penumbrae are in some regions stronger than the Evershed flow observed in the near sunspots (see, e.g., Figure 3(b), left panels). This cannot be due to projection effects because the orphan penumbrae are closer to the disk center than the sunspot south of the AR, even if we cannot exclude a dependence on the real orientation of the penumbral filaments. Moreover, the Hinode maps show that the strongest plasma motions occur along the PIL. In regard to this, Cristaldi et al. (2014) reported a similar behavior along the PIL of a δ spot, in correspondence to highly sheared penumbral filaments. Thus, some other mechanism could also act in the region of interface between opposite polarities, provoking these motions.
Field extrapolations could give some information about the magnetic connectivity of the different orphan penumbral features present in the AR. A nonlinear force-free field method, for instance using a technique similar to that described by Barnes et al. (2005), could provide some insight on the structures overlying the orphan penumbrae, in order to determine if the latter are pushed down with the magnetic canopy. Given the fairly large effort necessary to apply these extrapolation methods, we reserve such a study for a separate work.
Numerical simulations of 3D MHD magnetoconvection and flux emergence should explore these possibilities in order to explain the properties of orphan penumbrae. Also, a careful data mining of the existing databases and fortuitous high-resolution observations of orphan penumbrae near the disk center with full spectro-polarimetric measurements may shed light on the physical processes behind their appearance. Higher temporal and spatial resolution observations, carried out in the future with larger aperture telescopes, like the European Solar Telescope (Collados et al. 2010) and the Advanced Technology Solar Telescope (Keil et al. 2010), will undoubtedly provide new contributions to determine the nature of these intriguing and elusive solar features.
We thank V. Martínez Pillet, L.R. Bellot Rubio, and G. Barnes for useful discussions. S.L.G. thanks D.L. Distefano for his help in editing the movies. We would like to thank an anonymous referee for valuable comments and suggestions. The SDO/HMI data used in this paper are courtesy of NASA/SDO and the HMI science team. The Dutch Open Telescope is operated by Utrecht University at the Spanish Observatorio del Roque de Los Muchachos of the Instituto de Astrofísica de Canarias. We acknowledge the DOT science team, especially F. Bettonvil for his help. Hinode is a Japanese mission developed and launched by ISAS/JAXA, with NAOJ as domestic partner and NASA and STFC (UK) as international partners. It is operated by these agencies in cooperation with ESA and NSC (Norway). SOT/SP Inversions were conducted at NCAR under the framework of the Community Spectro-polarimetric Analysis Center (CSAC; http://www.csac.hao.ucar.edu/). The authors thank for financial support the International Space Science Institute (Bern). This research has received funding from the EC 7th Framework Programme FP7/2007-2013 under the grant agreements eHEROES (project No. 284461) and SOLARNET (project No. 312495). This study was partially supported by the Istituto Nazionale di Astrofisica (PRIN-INAF-2010) and Università di Catania. Use of NASA's Astrophysical Data System is gratefully acknowledged.
Facilities: SDO - Solar Dynamics Observatory, DOT - Dutch Open Telescope, Hinode (SOT) - Hinode (Solar-B)