


ABSTRACT
The Canada–France Brown Dwarfs Survey is an i'- and z'-band survey realized with MegaCam at the Canada–France–Hawaii Telescope that covers a surface area of 780 deg2. Image analysis is now completed while J-band follow-up campaigns are ∼90% done. The survey identified about 70 T dwarf candidates, of which 43 now have near-infrared spectra obtained with NIRI and GNIRS at Gemini and ISAAC at the Very Large Telescope. Six of these were previously published and we present here the 37 new discoveries, all T dwarfs. They range from T0 to T8.5 with four being of type T7 or later. Both newly identified T8 dwarfs are possibly high log (g) massive brown dwarfs of thin disk age. One T4.5 dwarf shows signs of sub-metallicity. We present proper motions and near-infrared photometry, and discuss about the most peculiar/interesting objects in some details.
Export citation and abstract BibTeX RIS
1. INTRODUCTION
Fifteen years of brown dwarf (BD) discoveries have led to spectacular advances in understanding their galactic distribution and number density (Chabrier 2003), the mechanisms involved in their formation (Kroupa & Bouvier 2003; Reipurth & Clarke 2001), the physics of their atmosphere (Allard et al. 2001; Burrows et al. 1997; Marley et al. 2002), and their evolution (Chabrier et al. 2000). Large-scale near-infrared (NIR) and optical surveys such as the Two Micron All Sky Survey (2MASS; Skrutskie et al. 2006), DENIS (Epchtein 1997), and Sloan Digital Sky Survey (SDSS; York et al. 2000) were instrumental in this success by providing a large sample of bright BDs of different temperatures and masses over the high galactic latitude sky. These surveys in particular identified enough BDs to define classification schemes for two new spectral types: the GD 165-1-like L dwarfs (Kirkpatrick et al. 1999; Martín et al. 1999) and the GJ229B-like T dwarfs (Burgasser et al. 2002).
A second generation of surveys with more limited sky coverage but much improved sensitivities—the UKIDSS LAS (4000 deg2 to J = 20.0) and this survey, the Canada–France Brown Dwarfs Survey (CFBDS—780 deg2 to z' = 22.5)—has started probing more distant and cooler BDs. Two of their major objectives are (1) to study the galactic distribution of BDs in the thick disk or the halo and (2) to discover objects cooler than the latest known T dwarf objects to study the physics of their atmosphere. Models predict that the NIR spectra of BDs cooler than T8 should display ammonia (NH3) absorption (Burrows et al. 2003; Saumon et al. 2006; Hubeny & Burrows 2007), and be different enough to require a new spectral type for which the letter Y has been reserved (Leggett et al. 2007). Prior to these new surveys the effective temperature at which this transition occurs was unclear. Evidence for a NIR NH3 band at 1.57 μm was found in the spectrum of CFBDS J005910.90−011401.3 (hereafter CFBDS0059; Delorme et al. 2008a), and with hindsight in the spectrum of ULAS J003402.8−005205.7 (hereafter ULAS0034; Warren et al. 2007) and 2MASS J041519.5−093506.6 (hereafter 2M0415; Burgasser et al. 2002). With estimated effective temperatures of, respectively, 620 K and 670 K (possibly 100 K less; Burningham et al. 2009), CFBDS0059 and ULAS0034 probably represent T/Y transition objects, although their exact position relative to the transition remains a matter of minor controversy. Burningham et al. (2008) suggest that these and possibly cooler objects, ULAS J133553.45+113005.2 and Wolf 940B (Burningham et al. 2009), should be assigned spectral type T9 rather than Y0. A recent discovery of an even cooler dwarf at 500 K, UGPS J072227.51−054031.2 (Lucas et al. 2010), shows very similar NIR spectral features as the other T9 dwarfs but is 1 mag intrinsically fainter, beyond the T9 type in the luminosity versus spectral type relation. In light of that discovery, it may be more natural to extend the T classification to T10 rather than require a new spectral type.
According to the DwarfArchives.org compiled by Chris Gelino, there were about 120 known T dwarfs that had been spectroscopically confirmed (as opposed to just photometry) discovered in the era of first-generation large area surveys. Together, the UKIDSS LAS survey with 80 (Lodieu et al. 2007; Warren et al. 2007; Pinfield et al. 2008; Burningham et al. 2008, 2009, 2010a, 2010b) and CFBDS surveys with 41 (the present paper and Delorme et al. 2008a, 2008b) have now doubled that figure and brought the total number of known T dwarfs to more than 240. We present here the NIR spectra of 43 of the ∼70 T dwarf candidates identified in the analysis of the 780 deg2 survey. Six of these were published elsewhere: SDSS J151114+060742 (Chiu et al. 2006) for which we present a revised spectral type; CFBDS0059, which is one of the coolest few BDs known (Delorme et al. 2008a); three that were briefly presented in the CFBDS description paper (Delorme et al. 2008b); and ULAS J145935.30+085751.5, which was independently discovered by the ULAS team (Burningham et al. 2010b). The other 37 spectra represent new discoveries. We also present J-band photometry, used to confirm initial i' − z' candidates, for all candidates, as well as WIRCam NIR photometry in the Mauna Kea Observatories (MKO) system for 25 of them. Section 3.1 presents astrometry and spectral typing indices, Section 3.2 presents proper motion measurements while Sections 3.3 and 3.4, respectively, present color diagrams and binarity follow-ups. A detailed analysis of the CFBDS completeness and space density is the subject of a separate paper (Reylé et al. 2010).
2. OBSERVATIONS
The CFBDS is a ≈780 deg2 survey in the i' and z' filters conducted with MegaCam (Boulade et al. 2003) at the Canada–France–Hawaii Telescope (CFHT). An in-depth description of its observing and data analysis strategies can be found in Delorme et al. (2008b).
In summary, BDs initially selected on the basis of their red i' − z' color. We require a 10σ detection in the detection band (z') and a color i' − z' ⩾ 1.7 (note that several of the latest T dwarfs only have upper limits in i'). We rely on two existing surveys, the Very Wide Component of the CFHT Legacy Survey (Cuillandre & Bertin 2006,CFHTLS hereafter) in the i' band and the Red-sequence Cluster Survey (Yee et al. 2007, hereafter RCS-2) in the z' band which we complement with new MegaCam data in, respectively, the z' band and i' band. These two surveys together contribute a total of 707 MegaCam fields or, after accounting for the loss in the gaps between CCDs, 594 deg2 of i' and z' coverage. We also use the significantly deeper i' and z' images from the CFHTLS-Wide and CFHTLS-Deep surveys, which cover 190 deg2 for a total of ≈780 deg2.
The reddest sources are followed-up with pointed J-band imaging (at ESO-NTT, NOT, Kitt Peak 2.1 m, Mac Donald Observatory 2.7 m) to discriminate actual BDs from instrumental artifacts and astrophysical contaminants, such as high-redshift quasars. The latter have similar i' − z' colors to T dwarfs but their z' − J colors are approximately 1 mag bluer. Willott et al. (2007, 2009, 2010) published an analysis of the first 19 high-redshift quasars found in our survey. Figure 1 summarizes the photometric properties of the BD candidates with follow-up spectroscopy. Ten sources lacking spectroscopic observations have sufficient additional photometry in the Y, H, or K bands to allow a rough estimate of their spectral type.
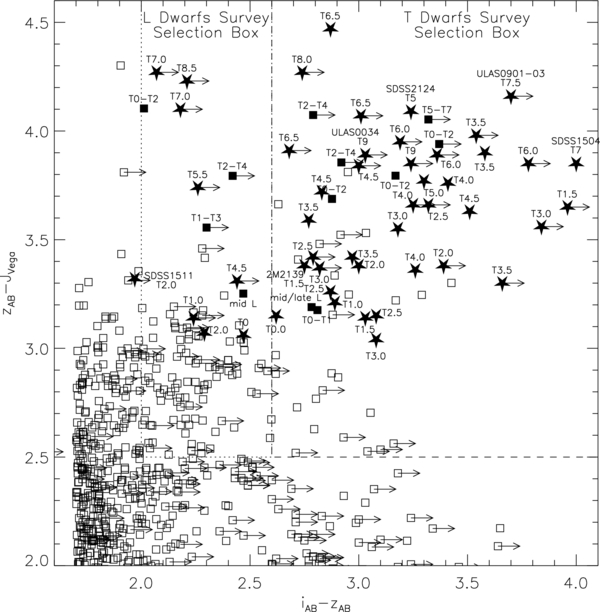
Figure 1. Color–color diagram of all candidates with J-band follow-up. Arrows indicate lower limits. The spectroscopically confirmed T dwarfs are plotted as black stars annotated with their spectral type. Sources with additional NIR photometry allowing a rough spectral type estimate are plotted as filled squares. Regions of the color–color diagram used as our selection criteria to split T dwarf and L dwarf populations in this survey are outlined.
Download figure:
Standard image High-resolution imageFollow-up spectroscopy of T dwarf candidates with very red i'AB − zAB' ⩾2.5 and z'AB − JVega ⩾3.15 colors was then carried out at Gemini and the Very Large Telescope (VLT; see Delorme et al. 2008b for the color selection). Before the unfortunate incident that put it out of commission, GNIRS at Gemini-South was our instrument of choice since its cross-dispersed mode provides continuous 0.9–2.4 μm spectral coverage. We afterward modified our observing strategy to using NIRI at Gemini-North, first obtaining an H-band spectrum to determine spectral types, and later securing additional coverage in the J band, and occasionally the K band, for selected targets (mostly later than T6). ISAAC was used at the VLT to obtain H-band spectra and, for a few targets, J and K bands as well. The spectroscopic observations generally focused on the candidates with the reddest z' − J color in our constantly expanding list of candidates at the time when we prepared the queue observations. Finder charts can be found in Figure 2.

Download figure:
Standard image High-resolution image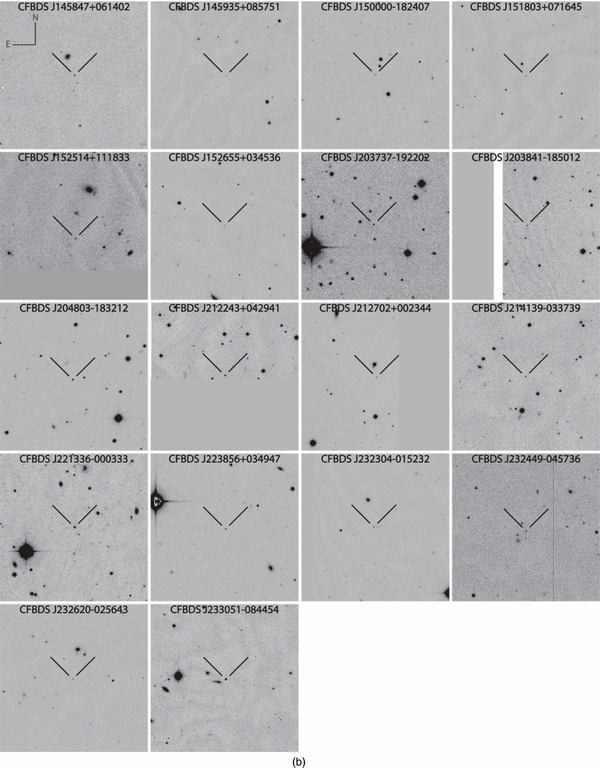
Figure 2. z'-band finding charts for the 37 new CFBDS T dwarfs. Images are 90'' on a side. North is pointing up and east is pointing left. Note that CFBDS 1459+08 was recently published by Burningham et al. (2010b).
Download figure:
Standard image High-resolution imageThroughout this paper, we consistently use Vega magnitudes for the NIR photometry (Y, J, H, Ks) and AB magnitudes for the i' and z' optical photometry. In spite of its internal inconsistency, this mixed system is commonly used when discussing BD photometry, and therefore convenient for comparisons to the literature. Also, we abbreviate the CFBDS denominations to CFBDS hhmm±dd to ease reading when no confusion is possible and refer to Table 1 for full names.
Table 1. Spectroscopic Observations at Gemini and the VLT
| Designation | Instrument | Queue | Date | Grism | Integration | Dithers |
|---|---|---|---|---|---|---|
| Time | ||||||
| CFBDS J005910.83−011401.3 | NIRI | GN-2007A-Q-201 | 2007 Jul 30 | H | 16 × 300 s | 6 |
| ... | NIRI | GN-2007B-Q-3 | 2007 Sep 2 | J | 9 × 300 s | 8 |
| ... | NIRI | GN-2007B-Q-3 | 2007 Sep 2 | K | 9 × 300 s | 8 |
| CFBDS J013302.27+023128.4 | NIRI | GN-2009B-DD-6 | 2009 Dec 13 | J | 8 × 300 s | 8 |
| ... | NIRI | GN-2009B-DD-6 | 2009 Dec 13 | H | 15 × 300 s | 15 |
| ... | NIRI | GN-2009B-DD-6 | 2009 Dec 14 | K | 9 × 300 s | 9 |
| CFBDS J022638.96−072831.8 | ISAAC | 081.C-0615(A) | 2008 Sep 23 | H | 28 × 140 s | 15 |
| ... | ISAAC | 081.C-0615(A) | 2008 Oct 1 | J | 12 × 190 s | 7 |
| ... | ISAAC | 081.C-0615(A) | 2008 Oct 1 | K | 16 × 130 s | 9 |
| CFBDS J022644.65−062522.0 | ISAAC | 081.C-0615(A) | 2008 Sep 19 | H | 14 × 140 s | 8 |
| CFBDS J025053.33+162050.7 | ISAAC | 082.C-0701(A) | 2008 Oct 8 | H | 9 × 140 s | 5 |
| CFBDS J025401.67−182529.2 | NIRI | GN-2007B-Q-3 | 2008 Jan 12 | H | 17 × 285 s | 11 |
| ... | NIRI | GN-2007B-Q-3 | 2008 Jan 14 | J | 17 × 285 s | 11 |
| ... | NIRI | GN-2007B-Q-3 | 2008 Feb 21 | K | 11 × 285 s | 11 |
| ... | NIRI | GN-2007B-Q-3 | 2008 Feb 23 | K | 6 × 285 s | 6 |
| CFBDS J025558.46−173020.2 | ISAAC | 082.C-0701(A) | 2008 Oct 8 | H | 12 × 140 s | 7 |
| CFBDS J025718.08−124853.1 | ISAAC | 082.C-0701(A) | 2008 Oct 12 | H | 12 × 140 s | 8 |
| CFBDS J025805.92−145534.3 | ISAAC | 080.C-0802(A) | 2007 Nov 24 | H | 6 × 140 s | 4 |
| ... | ISAAC | 080.C-0802(A) | 2007 Nov 24 | J | 6 × 190 s | 4 |
| ... | ISAAC | 080.C-0802(A) | 2007 Nov 24 | K | 14 × 130 s | 8 |
| CFBDS J025840.60−182648.3 | ISAAC | 082.C-0701(A) | 2008 Oct 8 | H | 5 × 140 s | 3 |
| CFBDS J030130.53−104504.3 | ISAAC | 081.C-0615(A) | 2008 Sep 3 | H | 14 × 140 s | 8 |
| ... | ISAAC | 081.C-0615(A) | 2008 Sep 4 | H | 11 × 140 s | 5 |
| CFBDS J030135.11−161418.0 | ISAAC | 082.C-0701(A) | 2008 Oct 12 | H | 7 × 140 s | 4 |
| CFBDS J030225.88−144125.4 | NIRI | GN-2007B-Q-3 | 2008 Jan 7 | H | 9 × 285 s | 8 |
| CFBDS J030226.67−143719.2 | NIRI | GN-2007B-Q-2 | 2008 Jan 12 | H | 9 × 285 s | 8 |
| ... | NIRI | GN-2007B-Q-2 | 2008 Jan 10 | J | 6 × 285 s | 6 |
| CFBDS J030922.29−161426.1 | ISAAC | 082.C-0701(A) | 2008 Oct 12 | H | 23 × 140 s | 9 |
| CFBDS J090139.82+174051.3 | ISAAC | 080.C-0802(A) | 2007 Dec 23 | H | 24 × 140 s | 13 |
| ... | ISAAC | 080.C-0802(A) | 2008 Jan 1 | H | 10 × 140 s | 6 |
| CFBDS J090449.60+165347.0 | NIRI | GN-2007B-Q-3 | 2008 Jan 25 | H | 17 × 285 s | 11 |
| CFBDS J092250.12+152741.4 | ISAAC | 080.C-0802(A) | 2007 Dec 24 | H | 28 × 140 s | 15 |
| CFBDS J095914.80+023655.2 | GNIRS | GS-2006A-Q-16 | 2006 Mar 15 | JHK | 10 × 600 s | 2 |
| ... | GNIRS | GS-2006A-Q-16 | 2006 Mar 19 | JHK | 10 × 600 s | 2 |
| CFBDS J100113.05+022622.3 | GNIRS | GS-2006A-Q-16 | 2006 Mar 15 | JHK | 8 × 600 s | 2 |
| CFBDS J102841.01+565401.9 | NIRI | GN-2007B-Q-2 | 2007 Nov 17 | H | 12 × 300 s | 2 |
| ... | NIRI | GN-2007B-Q-3 | 2008 Feb 21 | H | 9 × 285 s | 8 |
| ... | NIRI | GN-2007B-Q-3 | 2008 May 3 | H | 7 × 285 s | 7 |
| ... | NIRI | GN-2007B-Q-2 | 2008 Jan 27 | J | 10 × 285 s | 10 |
| CFBDS J104209.98+580856.6 | NIRI | GN-2007B-Q-2 | 2007 Nov 16 | H | 6 × 300 s | 2 |
| ... | NIRI | GN-2007A-Q-201 | 2008 Jan 7 | H | 9 × 285 s | 8 |
| ... | NIRI | GN-2007B-Q-2 | 2008 Jan 13 | J | 9 × 285 s | 8 |
| ... | NIRI | GN-2007B-Q-3 | 2008 Feb 21 | J | 9 × 285 s | 8 |
| ... | NIRI | GN-2007B-Q-3 | 2008 Jan 25 | K | 9 × 285 s | 8 |
| CFBDS J145044.96+092108.7 | NIRI | GN-2008A-Q-106 | 2008 Jun 16 | H | 17 × 285 s | 11 |
| CFBDS J145847.93+061402.8 | NIRI | GN-2008A-Q-106 | 2008 Jun 17 | H | 4 × 285 s | 4 |
| ULAS J145935.30+085751.5 | NIRI | GN-2007B-Q-3 | 2007 Aug 13 | H | 7 × 300 s | 2 |
| CFBDS J150000.50−182407.3 | GNIRS | GS-2007A-Q-1 | 2007 Apr 4 | JHK | 4 × 600 s | 2 |
| SDSS J151114.59+060742.3 | GNIRS | GS-2007A-Q-1 | 2007 Mar 20 | JHK | 8 × 100 s | 2 |
| CFBDS J151803.64+071645.9 | NIRI | GN-2007B-Q-2 | 2007 Jul 25 | H | 3 × 300 s | 2 |
| ... | NIRI | GN-2007B-Q-2 | 2007 Jul 29 | H | 12 × 300 s | 4 |
| ... | ISAAC | 080.C-0802(A) | 2008 Feb 20 | H | 26 × 140 s | 14 |
| CFBDS J152514.82+111833.1 | ISAAC | 081.C-0615(A) | 2008 Jun 20 | H | 14 × 140 s | 8 |
| ... | ISAAC | 081.C-0615(A) | 2008 Jul 2 | H | 19 × 140 s | 10 |
| CFBDS J152655.80+034536.2 | GNIRS | GS-2007A-Q-1 | 2007 Apr 4 | JHK | 8 × 600 s | 2 |
| CFBDS J193430.36−214221.0 | GNIRS | GS-2006A-Q-16 | 2006 Jul 20 | JHK | 6 × 300 s | 2 |
| CFBDS J203737.07−192202.9 | ISAAC | 080.C-0802(A) | 2008 Jun 27 | H | 14 × 140 s | 8 |
| ... | ISAAC | 080.C-0802(A) | 2008 Jul 16 | H | 14 × 140 s | 8 |
| CFBDS J203841.41−185012.3 | NIRI | GN-2008A-Q-106 | 2008 Jun 27 | H | 6 × 285 s | 6 |
| ... | NIRI | GN-2008A-Q-106 | 2008 Jun 28 | H | 9 × 285 s | 7 |
| CFBDS J204803.61−183212.7 | NIRI | GN-2007A-Q-201 | 2007 Jun 21 | H | 3 × 300 s | 2 |
| CFBDS J212243.69+042941.9 | NIRI | GN-2008A-Q-106 | 2008 Jun 4 | H | 10 × 285 s | 10 |
| ... | NIRI | GN-2008A-Q-106 | 2008 Jun 11 | H | 2 × 285 s | 2 |
| CFBDS J212702.19+002344.7 | NIRI | GN-2007A-Q-201 | 2007 Jul 17 | H | 14 × 300 s | 2 |
| CFBDS J214139.77−033739.0 | NIRI | GN-2008A-Q-106 | 2008 Jun 28 | H | 13 × 285 s | 11 |
| CFBDS J221336.00−000333.0 | NIRI | GN-2008A-Q-106 | 2008 Jun 4 | H | 17 × 285 s | 11 |
| ... | NIRI | GN-2008A-Q-106 | 2008 Jun 11 | H | 4 × 285 s | 3 |
| ... | NIRI | GN-2008A-Q-106 | 2008 Jun 29 | H | 14 × 285 s | 11 |
| CFBDS J223856.30+034947.0 | NIRI | GN-2007A-Q-201 | 2007 Jul 18 | H | 16 × 300 s | 2 |
| CFBDS J232304.41−015232.3 | NIRI | GN-2007A-Q-201 | 2007 Jul 24 | H | 12 × 300 s | 2 |
| CFBDS J232449.19−045736.5 | ISAAC | 082.C-0701(A) | 2008 Oct 10 | H | 10 × 140 s | 6 |
| CFBDS J232620.21−025643.7 | NIRI | GN-2007A-Q-201 | 2007 Jul 25 | H | 14 × 300 s | 10 |
| CFBDS J233051.24−084454.6 | NIRI | GN-2008A-Q-106 | 2008 Jun 24 | H | 8 × 285 s | 7 |
2.1. Gemini-South GNIRS Spectroscopy
Spectroscopic campaigns with GNIRS (Elias et al. 2006) on Gemini-South were conducted during semesters 2006A and 2007A in queue service mode (Table 1), using the cross-dispersed mode. The six candidates observed with GNIRS were confirmed as T dwarfs. CFBDS J095914+023655 (T3.5 ± 0.5), CFBDS J100113+022622 (T5.0 ± 0.5), and CFBDS J193430−214221 (T3.5 ± 0.5) were previously published with less accurate spectral types in Delorme et al. (2008b) while CFBDS J151114+060742 (drawn from an RCS-2 field) is an independent rediscovery of SDSS J151114.66+060742.9 (T0 ± 2; Chiu et al. 2006) for which we provide an improved spectrum and a more accurate spectral type of T2.0 ± 0.5. CFBDS J152655+034536 and CFBDS J150000−182407 are new discoveries, and were, respectively, uncovered from CFHTLS (Very Wide) and RCS-2 fields.
The 0 68 slit width, the short camera, and the 31.7 l mm−1 grating, together result in a resolving power of 900, with full wavelength coverage between 0.9 and 2.4 μm. A–B (not ABBA) sequences were used, with individual 100 s exposures for SDSS J151114.66+060742.9 and 10 minute exposures for CFBDS J152655+034536 and CFBDS J150000−182407. The total on-source integration times are, respectively, 13.33, 80, and 40 minutes. An early A-type (ideally A0) star was observed immediately before each sequence for relative flux calibration and telluric absorption correction. We used our own IDL procedures to extract and calibrate the spectra, as described in Delorme et al. (2008a). The sequence of spectral images is flat-fielded using observation of an internal flat-field lamp obtained immediately after the science frames. The five useful cross-dispersed orders are then extracted into five separate images, which are each corrected for order curvature. The trace of most targets disappears at some wavelengths (e.g., in the methane and water absorption troughs), and we therefore determine the curvature of the orders from the matching telluric reference star spectrum. The straightened order frames are then pair subtracted, removing most of the sky, dark current and hot pixels contributions. Each frame is collapsed along the spectral dimension to determine the positions of the positive and negative traces, and the spectrum is then extracted using positive and negative extraction boxes that we force to have opposite integrals; this minimizes the contamination by sky line residuals that survived the pair subtraction. The spectra derived from the individual image pairs are then median combined into one spectrum for each object. The spectra of the A0 telluric calibration stars are identically processed, interpolated over the hydrogen recombination lines, corrected for interstellar reddening, and divided by a 10,000 K blackbody spectrum to produce a spectrum of the telluric absorption. Each target spectrum is then divided by the derived telluric transmission spectrum. A first-order wavelength calibration is obtained from an argon-lamp spectrum, and fine tuned by registering the bright OH− lines detected in the sum (rather than the difference) of the pair of images of interest.
2.2. Gemini-North NIRI Spectroscopy
Following the failure of GNIRS, our spectroscopic follow-up program was moved to Gemini-North and NIRI (Hodapp et al. 2003), where we observed 23 candidates during semesters 2007A, 2007B, 2008A, and 2009B. All were found to be T dwarfs, and all are new discoveries except CFBDS J005910−011401, a T–Y transition object which we previously discussed in Delorme et al. (2008a), and ULAS J145935+085751 codiscovered by Burningham et al. (2010b). For nine targets which turned out to have early/mid-T spectral types, we limited our spectroscopic follow-up to the H band. For those where the H-band CH4 spectral index confirmed a late-T type, we additionally obtained J-band, and sometimes K-band, spectra.
All NIRI observations use the low-resolution f/6 camera, with the centered 6 pixel (075) slit with the H and K grisms and the 6 pixel (0696) blue slit with the J grism. The total integration times varied between 40 and 80 minutes, with individual exposure times of either 285 or 300 s. The processing recipes which we used for the NIRI data closely mirror those described for the GNIRS data, with small modifications to match a different observing strategy: we used multiple dithers (usually six or more) along the slit, separated by typically 2–3 arcsec, which yielded cosmetically cleaner spectra and a better signal-to-noise ratio than simple repeats of an AB pattern. The spectral resolutions (λ/Δλ) of the final spectra are approximately 480, 520, and 520 for the J, H, and K bands.
2.3. VLT ISAAC Spectroscopy
Southern candidates were preferably observed at the VLT using ISAAC (Moorwood et al. 1998) in queue mode during semesters 2007B, 2008A, and 2008B. In total, 15 candidates were observed in the H band with ISAAC of which one (CFBDS J151803+071645) was a reobservation of a NIRI target, so 14 are new discoveries. Two of these targets (CFBDS J025805−145534, a T1.5 dwarf and CFBDS J022638−072831, T6.5) have full JHK coverage with ISAAC.
We used the low-resolution grating for each of the J, H, and K bands with a slit width of 08 and a pixel scale of 0147 which yielded spectral resolutions of 650, 635, and 560, respectively. The observing strategy and data processing recipes followed very closely that used for NIRI.
In total, this paper presents spectra for 43 T-type BDs, of which 37 are new discoveries. Figure 3 presents their H-band spectra, all T-type BDs identified in the CFBDS and followed-up spectroscopically at Gemini and the VLT. Figure 4 presents the 1–2.5 μm spectra of the 14 targets for which we obtained broader NIR spectral coverage. Both figures include previously published CFBDS discoveries.

Figure 3. H-band spectra.
Download figure:
Standard image High-resolution image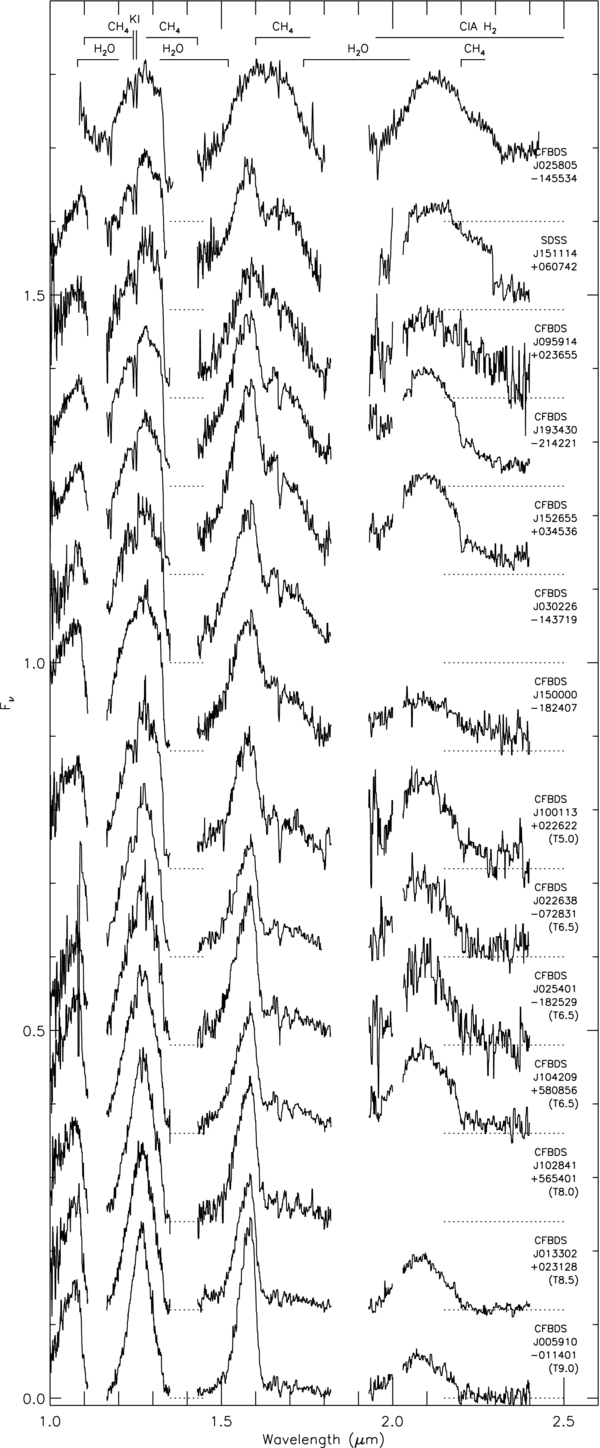
Figure 4. Near-IR spectra for the GNIRS targets and for promising candidates having complementary J and/or K spectra. The spectra were calibrated in Jansky using the WIRCam photometry when available, normalized at 1.27 μm then offset by an additive constant to produce the plot. For SDSS 1511+06 whose flux in the red is more pronounced, an additional offset of −0.1 and −0.15 was applied in the H and K bands.
Download figure:
Standard image High-resolution image2.4. WIRCam Supplemental Photometry
All spectroscopic targets have J-band photometry, since they were selected based on their position in an i' − z' versus z' − J diagram. That J photometry was obtained at several observatories. Most was with SOFI at the NTT, with two different J filters (J and Jshort). The rest was with NOTCam at the NOT and SQIID at Kitt Peak. More details on the J-band follow-up are given in Delorme et al. (2008b). We therefore used WIRCam (Puget et al. 2004) to obtain further Y, J, H, and/or Ks photometry on the MKO system (Simons & Tokunaga 2002) for several targets, to anchor the flux calibration of the spectra, determine spectroscopic parallaxes, measure proper motions, and identify color trends or peculiarities within our sample. The targets were positioned at the center of the northeast detector (array no. 60) and observed at 5–18 dithered positions within a 60'' radius circle. The WIRCam data were preprocessed with the 'I'iwi pipeline at CFHT and stacked using the Bertin software suite (SExtractor, Bertin & Arnouts 1996; Scamp, Bertin 2006; and Swarp, Bertin et al. 2002). We used the FLUX_AUTO method of SExtractor to extract the photometry, which for J, H, and Ks was anchored to a weighted average of the non-saturated 2MASS stars seen on the full mosaic. The Y photometry was calibrated through observation of a few CALSPEC standards, with no color correction. Table 2 summarizes all photometric measurements, including the MegaCam i'- and z'-band photometry as well as SOFI, NOTCam, and SQIID J-band photometry. The MegaCam photometry and the non-WIRCam J-band photometry were extracted with the point-spread function fitting method of SExtractor, as described in Delorme et al. (2008b).
Table 2. Optical and NIR Photometry of the Spectroscopic Sample
| Designation | i' − z' | z' | J | Y | J | H | Ks |
|---|---|---|---|---|---|---|---|
| (AB) | (AB) | (Vega) | (Vega) | (Vega) | (Vega) | (Vega) | |
| MegaCam | MegaCam | Other | WIRCam | WIRCam | WIRCam | WIRCam | |
| ULAS J003402−005205 | >3.03 | 22.11 ± 0.07 | 18.14 ± 0.10a | 19.12 ± 0.03 | 18.22 ± 0.03 | 18.55 ± 0.07 | 18.32 ± 0.05 |
| CFBDS J005910−011401 | >3.24 | 21.93 ± 0.05 | 18.08 ± 0.10a | 18.85 ± 0.02 | 18.08 ± 0.03 | 18.35 ± 0.06 | 18.71 ± 0.06 |
| CFBDS J013302+022312 | >2.21 | 22.43 ± 0.08 | 18.15 ± 0.10a | ... | ... | 18.62 ± 0.10b | 18.64 ± 0.10b |
| CFBDS J022638−072831 | 2.87 ± 0.35 | 22.66 ± 0.06 | 18.19 ± 0.10a | ... | ... | 18.65 ± 0.2b | 18.3 ± 0.2b |
| CFBDS J022644−062522 | >3.84 | 21.36 ± 0.04 | 17.8 ± 0.2a | ... | ... | 17.7 ± 0.2b | 17.5 ± 0.2b |
| CFBDS J025053+162050 | >2.79 | 22.11 ± 0.07 | 18.69 ± 0.10c | ... | ... | ... | ... |
| CFBDS J025401−182529 | >2.68 | 22.18 ± 0.09 | 18.20 ± 0.10a | 19.34 ± 0.04 | 18.27 ± 0.06 | 18.49 ± 0.05 | 18.37 ± 0.04 |
| CFBDS J025558−173020 | 2.89 ± 0.14 | 21.02 ± 0.03 | 17.81 ± 0.10a | ... | ... | ... | ... |
| CFBDS J025718−124853 | 2.97 ± 0.15 | 21.44 ± 0.04 | 18.02 ± 0.10a | ... | ... | ... | ... |
| CFBDS J025805−145534 | >3.96 | 21.23 ± 0.03 | 17.58 ± 0.10a | ... | ... | ... | ... |
| CFBDS J025840−182648 | 2.87 ± 0.13 | 20.96 ± 0.03 | 17.70 ± 0.10d | ... | ... | ... | ... |
| CFBDS J030130−104504 | >3.36 | 21.27 ± 0.03 | 17.38 ± 0.10a | ... | ... | ... | ... |
| CFBDS J030135−161418 | >2.07 | 22.61 ± 0.09 | 18.43 ± 0.10a | 19.38 ± 0.05 | 18.34 ± 0.07 | 18.99 ± 0.10 | 18.07 ± 0.06 |
| CFBDS J030225−144125 | >3.19 | 21.70 ± 0.06 | 17.49 ± 0.10a | 18.92 ± 0.03 | 17.75 ± 0.03 | 17.97 ± 0.04 | 18.15 ± 0.06 |
| CFBDS J030226−143719 | 3.41 ± 0.18 | 21.26 ± 0.04 | 17.44 ± 0.10a | 18.84 ± 0.03 | 17.50 ± 0.03 | 17.41 ± 0.03 | 17.37 ± 0.03 |
| CFBDS J030922−161426 | >2.26 | 22.26 ± 0.06 | 18.52 ± 0.10a | ... | ... | ... | ... |
| ULAS J090116−030635 | >3.70 | 22.04 ± 0.04 | 17.88 ± 0.10a | 18.82 ± 0.05e | 17.90 ± 0.04e | 18.46 ± 0.13e | >18.21e |
| CFBDS J090139+174051 | 2.77 ± 0.13 | 21.57 ± 0.03 | 18.02 ± 0.10f | 19.06 ± 0.03 | 17.98 ± 0.03 | 17.76 ± 0.05 | ... |
| CFBDS J090449+165347 | >3.25 | 21.68 ± 0.03 | 18.06 ± 0.10f | 19.24 ± 0.03 | 18.02 ± 0.03 | 17.93 ± 0.05 | 17.88 ± 0.04 |
| CFBDS J092250+152741 | >2.18 | 22.38 ± 0.06 | 18.81 ± 0.10f | 19.44 ± 0.07 | 18.28 ± 0.04 | 18.81 ± 0.10 | ... |
| CFBDS J095914+023655 | >3.54 | 23.52 ± 0.03 | 19.35 ± 0.20g | 20.79 ± 0.09 | 19.54 ± 0.11 | 19.46 ± 0.15 | 19.39 ± 0.05h |
| CFBDS J100113+022622 | 3.30 ± 0.11 | 22.80 ± 0.02 | 18.75 ± 0.20g | 19.98 ± 0.06 | 19.03 ± 0.06 | 19.25 ± 0.11 | 19.01 ± 0.05h |
| CFBDS J102841+565401 | >2.74 | 22.25 ± 0.08 | 18.20 ± 0.10c | 18.85 ± 0.02 | 17.98 ± 0.04 | 18.38 ± 0.08 | 18.85 ± 0.09 |
| CFBDS J104209+580856 | >3.01 | 21.84 ± 0.04 | 17.66 ± 0.10c | 18.85 ± 0.03 | 17.77 ± 0.03 | 18.21 ± 0.05 | 17.77 ± 0.04 |
| CFBDS J145044+092108 | >2.82 | 22.17 ± 0.07 | 18.80 ± 0.10a | ... | ... | ... | ... |
| CFBDS J145847+061402 | 2.29 ± 0.10 | 21.55 ± 0.06 | 18.48 ± 0.10d | ... | ... | ... | ... |
| ULAS J145935+085751 | 2.83 ± 0.17 | 21.69 ± 0.06 | 17.89 ± 0.10c | 19.23 ± 0.04 | 17.97 ± 0.04 | 17.87 ± 0.03 | 17.82 ± 0.03 |
| CFBDS J150000−182407 | >3.00 | 21.63 ± 0.04 | 18.21 ± 0.10f | 18.80 ± 0.02 | 17.79 ± 0.03 | 17.90 ± 0.03 | 18.18 ± 0.04 |
| SDSS J150411+102717 | 4.00 ± 0.65 | 20.61 ± 0.02 | 16.76 ± 0.10a | ... | 16.49 ± 0.03i | 16.92 ± 0.03i | 17.02 ± 0.03i |
| SDSS J151114+060742 | 1.97 ± 0.01 | 19.20 ± 0.01 | 15.83 ± 0.03i | 17.19 ± 0.01 | 15.88 ± 0.02 | 15.14 ± 0.02 | 14.52 ± 0.10i |
| CFBDS J151803+071645 | 3.08 ± 0.20 | 21.60 ± 0.04 | 18.45 ± 0.10d | 19.39 ± 0.05 | ... | 17.86 ± 0.04 | ... |
| CFBDS J152514+111833 | >3.32 | 21.64 ± 0.07 | 17.98 ± 0.10a | ... | ... | ... | ... |
| CFBDS J152655+034536 | 3.26 ± 0.19 | 21.53 ± 0.05 | 18.17 ± 0.10d | 19.11 ± 0.04 | ... | 17.85 ± 0.03 | ... |
| CFBDS J193430−214221 | 3.58 ± 0.51 | 20.56 ± 0.02 | 16.77 ± 0.15j | 17.98 ± 0.01 | 16.66 ± 0.01 | 16.39 ± 0.06 | 16.31 ± 0.04 |
| CFBDS J203737−192202 | 2.62 ± 0.22 | 21.87 ± 0.05 | 18.82 ± 0.10a | 19.88 ± 0.09 | 18.72 ± 0.04 | 17.80 ± 0.04 | 17.15 ± 0.04 |
| CFBDS J203841−185012 | 3.08 ± 0.35 | 21.98 ± 0.07 | 18.94 ± 0.10d | ... | ... | ... | ... |
| CFBDS J204803−183212 | 3.51 ± 0.10 | 20.30 ± 0.02 | 16.89 ± 0.10d | 17.75 ± 0.02 | 16.67 ± 0.02 | 16.55 ± 0.02 | 16.60 ± 0.02 |
| CFBDS J212243+042942 | 3.00 ± 0.16 | 21.16 ± 0.03 | 17.78 ± 0.10a | ... | ... | ... | ... |
| SDSS J212413+010002 | 3.24 ± 0.08 | 19.91 ± 0.01 | 15.82 ± 0.10a | ... | ... | ... | ... |
| CFBDS J212702+002344 | >3.66 | 21.28 ± 0.04 | 18.13 ± 0.10d | 19.07 ± 0.04 | 17.98 ± 0.03 | 17.53 ± 0.03 | 17.29 ± 0.03 |
| CFBDS J214139−033739 | >2.24 | 21.89 ± 0.06 | 18.75 ± 0.10a | ... | ... | ... | ... |
| CFBDS J221336−000333 | 3.03 ± 0.11 | 21.80 ± 0.05 | 18.66 ± 0.10a | ... | ... | ... | ... |
| CFBDS J223856+034947 | >3.39 | 21.56 ± 0.03 | 18.24 ± 0.10d | 19.23 ± 0.03 | 18.18 ± 0.06 | 17.62 ± 0.03 | 17.30 ± 0.03 |
| CFBDS J232304−015232 | >3.78 | 21.08 ± 0.03 | 17.60 ± 0.10f | 18.30 ± 0.02 | 17.23 ± 0.03 | 17.46 ± 0.04 | 17.30 ± 0.03 |
| CFBDS J232449−045736 | >2.44 | 22.03 ± 0.07 | 18.72 ± 0.10d | ... | ... | ... | ... |
| CFBDS J232620−025643 | 3.18 ± 0.13 | 21.34 ± 0.04 | 17.80 ± 0.10a | 19.26 ± 0.06 | 17.79 ± 0.04 | 17.42 ± 0.03 | 17.10 ± 0.03 |
| CFBDS J233051−084454 | 2.47 ± 0.04 | 20.35 ± 0.02 | 17.31 ± 0.10a | ... | 17.29 ± 0.21j | 15.92 ± 0.16j | 15.37 ± 0.20j |
Notes. The i'-band lower limits are for 5σ significance, and therefore conservative. In accordance with most of the BD literature, the NIR magnitudes are in the Vega system while the optical magnitudes are in the AB system. (The AB to Vega conversion for the MegaCam i' and z' filters are −0.401 and −0.554, respectively, while the Vega to AB conversions for the WIRCam Y, J, H, Ks filters are +0.577, +0.924, +1.352, +1.824, respectively (determined using LEPHARE by Stephane Arnouts).) aPhotometry using the SOFI Js filter at NTT. bPhotometry using SOFI at NTT. cPhotometry using the NOTCAM Js filter at NOT. dPhotometry using the SOFI J filter at NTT. ePhotometry from Lodieu et al. (2007). fPhotometry from SQIID on the 2.1 m at Kitt Peak. gPhotometry using CFHT-IR at CFHT. hWIRCam photometry from the COSMOS field (McCracken et al. 2010). iPhotometry from Chiu et al. (2006) using UFTI at UKIRT. jPhotometry from 2MASS.
Download table as: ASCIITypeset image
3. ANALYSIS
3.1. Spectral Types and Indices
We use the five spectral indices of the Burgasser et al. (2006) unified classification scheme (H2O−J, CH4 − J, H2O−H, CH4 − H, and CH4 − K) to determine spectral types from the full NIR spectra. Additionally, we measure the K/J index, a good gravity probe in late-T dwarfs, the Warren et al. (2007) WJ index, and the Delorme et al. (2008a) NH3 − H index. The latter probes H-band ammonia absorption beyond spectral type T8. To mitigate the influence of bad pixels in cosmetically poor spectra, we measure the indices after application of a 7 pixel wide median filter. We verified on cosmetically clean spectra (observed with multiple dithers) that this smoothing affects the measured indices by at most 10%. Table 3 presents the spectral indices which could be measured for each spectrum. These indices were converted to decimal subtypes using linear interpolation of Table 5 in Burgasser et al. (2006). We adopt as our best estimate the unweighted mean of the spectral types determined from the individual available indices, after experimenting with weighting schemes and finding that they typically affect the end result by at most a few tenths of a subtype. Upper/lower limits are rejected from the mean. Spectral types are rounded to 0.5 subtypes.
Table 3. Spectral Indices for the Unified Scheme of Burgasser et al. (2006) and Spectrophotometric Distances
| Designation | H2O − J | CH4 − J | H2O − H | CH4 − H | CH4 − K | K/J | WJ | NH3 − H | Spectral | SPmetric |
|---|---|---|---|---|---|---|---|---|---|---|
| Type | Dist. (pc) | |||||||||
| CFBDS J005910−011401 | 0.037[T8.66] | 0.175[T8.58] | 0.125[>T8] | 0.086[T8.81] | 0.111[>T6] | 0.101 | 0.257[>T9] | 0.544 | T9.0 | 18 ± 4a |
| CFBDS J013302+023128 | 0.065[T8.10] | 0.219[T7.87] | 0.172[T8.47] | 0.100[T8.62] | 0.042[>T6] | 0.128 | 0.336[T8.20] | 0.662 | T8.5 | 22 ± 5 |
| CFBDS J022638−072831 | 0.167[T6.26] | 0.323[T6.46] | 0.304[T6.26] | 0.241[T7.09] | 0.160[T6.40] | 0.184 | 0.441[<T7] | 0.665 | T6.5 | 40 ± 12 |
| CFBDS J022644−062522 | ... | ... | 0.483[T2.67] | 0.710[T3.45] | ... | ... | ... | 0.841 | T3.0 | 60 ± 8 |
| CFBDS J025053+162050 | ... | ... | 0.550[T1.72] | 0.778[T3.11] | ... | ... | ... | 0.807 | T2.5 | 94 ± 19 |
| CFBDS J025401−182529 | 0.160[T6.40] | 0.350[T6.12] | 0.267[T6.88] | 0.244[T7.06] | 0.163[T6.35] | 0.199 | 0.446[<T7] | 0.712 | T6.5 | 42 ± 10 |
| CFBDS J025558−173020 | ... | ... | 0.580[T1.29] | 0.980[T0.66] | ... | ... | ... | 0.815 | T1.0 | 57 ± 10 |
| CFBDS J025718−124853 | ... | ... | 0.412[T4.30] | 0.774[T3.13] | ... | ... | ... | 0.763 | T3.5 | 65 ± 12 |
| CFBDS J025805−145534 | 0.555[<T2] | 0.642[T2.32] | 0.568[T1.45] | 1.013[<T0] | 0.723[T1.22] | 0.346 | 0.769[<T7] | 0.862 | T1.5 | 54 ± 10 |
| CFBDS J025840−182648 | ... | ... | 0.559[T1.59] | 0.702[T3.49] | ... | ... | ... | 0.840 | T2.5 | 61 ± 11 |
| CFBDS J030130−104504 | ... | ... | 0.325[T5.90] | 0.378[T5.86] | ... | ... | ... | 0.737 | T6.0 | 33 ± 7 |
| CFBDS J030135−161418 | ... | ... | 0.275[T6.75] | 0.219[T7.31] | ... | ... | ... | 0.686 | T7.0 | 36 ± 10 |
| CFBDS J030225−144125 | ... | ... | 0.306[T6.23] | 0.434[T5.38] | ... | ... | ... | 0.760 | T6.0 | 38 ± 10 |
| CFBDS J030226−143719 | 0.381[T3.99] | 0.595[T2.83] | 0.408[T4.37] | 0.563[T4.31] | ... | 0.132 | 0.665[<T7] | 0.789 | T4.0 | 51 ± 10 |
| CFBDS J030922−161426 | ... | ... | 0.341[T5.58] | 0.452[T5.23] | ... | ... | ... | 0.704 | T5.5 | 65 ± 12 |
| CFBDS J090139+174051 | ... | ... | 0.444[T3.55] | 0.630[T3.85] | ... | ... | ... | 0.801 | T3.5 | 66 ± 11 |
| CFBDS J090449+165347 | ... | ... | 0.408[T4.37] | 0.596[T4.03] | ... | ... | ... | 0.766 | T4.0 | 65 ± 12 |
| CFBDS J092250+152741 | ... | ... | 0.279[T6.68] | 0.238[T7.12] | ... | ... | ... | 0.673 | T7.0 | 38 ± 9 |
| CFBDS J095914+023655 | 0.714[<T2] | 0.550[T3.50] | 0.446[T3.35] | 0.730[T3.35] | 0.533[T3.09] | 0.202 | 0.685[<T7] | 0.712 | T3.5 | 150 ± 31 |
| CFBDS J100113+022622 | 0.391[T3.85] | 0.437[T5.14] | 0.333[T5.75] | 0.352[T6.07] | 0.260[T4.81] | 0.215 | 0.548[<T7] | 0.742 | T5.0 | 96 ± 21 |
| CFBDS J102841+565401 | 0.043[T8.53] | 0.257[T7.34] | 0.179[T8.35] | 0.147[T8.04] | ... | ... | 0.336[T8.20] | 0.673 | T8.0 | 25 ± 6 |
| CFBDS J104209+580856 | 0.160[T6.40] | 0.349[T6.16] | 0.248[T7.21] | 0.269[T6.83] | 0.167[T6.25] | 0.197 | 0.448[<T7] | 0.693 | T6.5 | 32 ± 8 |
| CFBDS J145044+092108 | ... | ... | 0.483[T2.68] | 0.690[T3.55] | ... | ... | ... | 0.777 | T3.0 | 101 ± 18 |
| CFBDS J145847+061402 | ... | ... | 0.552[T1.69] | 0.871[T2.41] | ... | ... | ... | 0.808 | T2.0 | 86 ± 18 |
| ULAS J145935+085751 | ... | ... | 0.405[T4.42] | 0.528[T4.60] | ... | ... | ... | 0.782 | T4.5 | 59 ± 10 |
| CFBDS J150000−182407 | 0.335[T4.89] | 0.441[T5.10] | 0.387[T4.72] | 0.485[T4.96] | 0.429[T3.61] | 0.125 | 0.627[<T7] | 0.791 | T4.5 | 58 ± 15 |
| SDSS J151114+060742 | 0.619[<T2] | 0.649[T2.23] | 0.653[T0.12] | 0.802[T2.99] | 0.865[<T0] | 0.533 | 0.655[<T7] | 0.864 | T2.0 | 24 ± 5 |
| CFBDS J151803+071645 | ... | ... | 0.535[T1.93] | 0.788[T3.06] | ... | ... | ... | 0.860 | T2.5 | 81 ± 14 |
| CFBDS J152514+111833 | ... | ... | 0.500[T2.43] | 0.833[T2.73] | ... | ... | ... | 0.808 | T2.5 | 67 ± 18 |
| CFBDS J152655+034536 | 0.464[T2.86] | 0.532[T3.80] | 0.409[T4.35] | 0.574[T4.22] | 0.305[T4.41] | 0.247 | 0.648[<T7] | 0.776 | T4.0 | 66 ± 11 |
| CFBDS J193430−214221 | 0.505[T2.45] | 0.588[T2.91] | 0.477[T2.76] | 0.624[T3.88] | 0.339[T4.10] | 0.291 | 0.679[<T7] | 0.819 | T3.5 | 34 ± 7 |
| CFBDS J203737−192202 | ... | ... | 0.642[T0.29] | 0.998[T0.08] | ... | ... | ... | 0.845 | T0.0 | 76 ± 14 |
| CFBDS J203841−185012 | ... | ... | 0.499[T2.45] | 0.781[T3.10] | ... | ... | ... | 0.998 | T3.0 | 98 ± 14 |
| CFBDS J204803−183212 | ... | ... | 0.381[T4.82] | 0.537[T4.53] | ... | ... | ... | 0.790 | T4.5 | 31 ± 7b |
| CFBDS J212243+042942 | ... | ... | 0.571[T1.42] | 0.864[T2.46] | ... | ... | ... | 0.859 | T2.0 | 62 ± 11 |
| CFBDS J212702+002344 | ... | ... | 0.450[T3.32] | 0.732[T3.34] | ... | ... | ... | 0.820 | T3.5 | 60 ± 12 |
| CFBDS J214139−033739 | ... | ... | 0.529[T2.02] | 0.994[T0.21] | ... | ... | ... | 0.840 | T1.0 | 117 ± 24 |
| CFBDS J221336−000333 | ... | ... | 0.570[T1.43] | 0.913[T1.93] | ... | ... | ... | 0.882 | T1.5 | 84 ± 15 |
| CFBDS J223856+034947 | ... | ... | 0.561[T1.55] | 0.848[T2.60] | ... | ... | ... | 0.846 | T2.0 | 72 ± 13 |
| CFBDS J232304−015232 | ... | ... | 0.293[T6.45] | 0.397[T5.69] | ... | ... | ... | 0.680 | T6.0 | 29 ± 8 |
| CFBDS J232449−045736 | ... | ... | 0.368[T5.03] | 0.554[T4.38] | ... | ... | ... | 0.840 | T4.5 | 82 ± 16 |
| CFBDS J232620−025643 | ... | ... | 0.491[T2.55] | 0.676[T3.62] | ... | ... | ... | 0.837 | T3.0 | 57 ± 12 |
| CFBDS J233051−084454 | ... | ... | 0.656[T0.07] | 1.001[<T0] | ... | ... | ... | 0.875 | T0 | 42 ± 8 |
Notes. Each index translates to a spectral type (between brackets) through linear interpolation of the Burgasser et al. (2006, Table 5) definitions. The adopted spectral type is a straight average of the spectral indices that could be measured (upper limits are rejected). Spectral types are rounded to half integers. The spectrophotometric distance is based on the WIRCam J, H, Ks photometry (when available) using the absolute magnitude versus spectra type fits of Liu et al. (2006). aThe distance of CFBDS 0059−01 is 9.0 ± 0.5 pc based on preliminary trigonometric parallax (L. Albert et al. 2011, in preparation). bCFBDS 2048−18 is a tight binary with rough spectral types of T4 and T6, placing them at ∼40 pc (M. C. Liu 2011, private communication).
For targets possessing multi-band spectra, indices generally agree within ∼1 subtype. Exceptions are CFBDS 1001+02 (T5.0) for which the H2O−J (T3.85) index is >1 subtype early; CFBDS 025814 (T1.5) for which the CH4 − H (<T0) index is >1 subtype early; and SDSS 1511+06 (T2.0) which has discrepant H2O−H, CH4 − H indices by >2 subtypes. For targets with only H-band spectra, the average subtype difference (as defined by [CH4 − H]−[H2O−H]) is −0.2 with a 1σ scatter of 0.8 subtypes. Two targets have differences of +1.90 and −1.81 (discrepant at the 2σ level), i.e., CFBDS 0258−18 (T2.5) and CFBDS 2141−03 (T1.0), respectively.
After ULAS0034 and CFBDS0059, the two latest BDs isolated in this survey are CFBDS 1028+56 (T8.0) and CFBDS 0133+02 (T8.5). The unrounded average of spectral indices for CFBDS 0133+02 is T8.25 so it is intermediate between T8.0 and T8.5. We use the K/J and WJ indices normalized such that 2M0415 has unity and plot them in Figure 6 of Delorme et al. (2008a) to estimate a temperature and surface gravity of Teff = 750–800 K and log (g) = 5.0–5.5. For CFBDS 1028+56, the unrounded average of indices is T8.09. A K-band spectrum is not available but very blue photometry (J − K = −0.87 ± 0.10, H − K = −0.47 ± 0.11—refer to Figure 7) indicates weak K-band flux and possibly a small K/J index. We estimate a temperature and surface gravity of T = 700–800 K and log (g) ≈ 5.5. Those estimates should not be taken at face value, for example, models overestimate temperature by 100 K in the case of Wolf 940B (Burningham et al. 2009). Nevertheless, they are indicative that both CFBDS dwarfs have high surface gravity while their thin disk kinematics indicate intermediate age ((0.5–5) × 109 yr). They are thus probably on the massive side.
If we include all the T dwarfs discovered in the CFBDS or re-identified in our survey, 48 have confirmed spectral types, i.e., SDSS 2124−08 of type T5 (Knapp et al. 2004), SDSS 1504+10 (T7) and SDSS 1511+06 (T2) (Chiu et al. 2006), 2MASS 2139+02 (Burgasser et al. 2006) (T1.5), ULAS0034 (Warren et al. 2007) (T9), ULAS 0901−03 (T7.5) (Lodieu et al. 2007), CFBDS0059 (T9) (Delorme et al. 2008a), CFBDS 0959+02 (T3.5), CFBDS 1001+02 (T5.0) and CFBDS 1934−21 (T3.5) (Delorme et al. 2008b), ULAS 1459+08 (T4.5) (Burningham et al. 2010b), and the 37 presented in this paper. The whole 780 deg2 survey yielded about 70 T dwarf candidates with i' − z' ⩾ 2.6 and z' − J ⩾ 2.5 of which 48 are spectroscopically confirmed.
The spectral type histogram (Figure 5) shows that a majority of the spectroscopically confirmed BDs (25) have types T2.0 to T4.5 while only five have early-T types. The presence of a peak at T2–T3 holds if we include 10 suspected T dwarfs based on additional NIR photometry. Furthermore, to investigate if the drop at T0–T1 is real or a product of incompletion of our spectroscopic follow-up, we broaden our T dwarf selection box. We add sources with z' − J ⩾ 3.0 and i' − z' ⩾ 2.0 (refer to Figure 1). The z' − J ⩾ 3.0 constraint corresponds roughly to the bluest T dwarf in our diagram and is about the color of a T0 dwarf from our empirical spectral type versus z' − J relation (see below). The i' − z' ⩾ 2.0 constraint represents the color above which our survey is complete (cf. Reylé et al. 2010, Figure 3). This larger selection box brings 37 new candidates. A good fraction is probably T dwarfs with peculiar i' − z' colors (low-metallicity and/or high-gravity) but L dwarf contaminants are likely predominant. We use the strong correlation that exists between spectral type and z' − J based on the 48 spectroscopic T dwarfs of our survey. The empirical relation is Tn = −15.93 + 5.55 × (z' − J) with a 1σ residual to the fit of 1.36 subtype (inset of Figure 5). We then applied the relation to the 37 sources lacking classification. If we assume that 100% of the sources are of T type despite their position within or close to the L dwarf box, the distribution peak at T2–T3 persists but the drop toward T0 is shallower. In reality, L dwarfs likely contribute a significant fraction of these 37 sources. That only strengthens the reality of the peak since L dwarfs are likely to contribute more in the T0 bin than in the T3 bin as they are generally bluer in z' − J than T dwarfs.
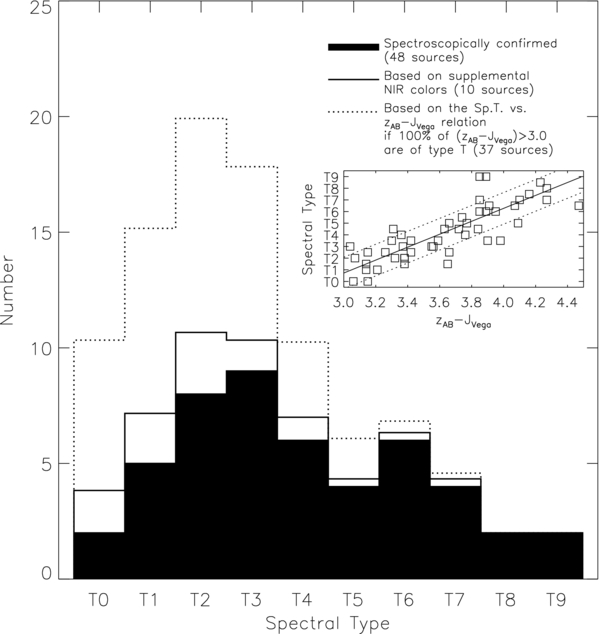
Figure 5. Spectral type histogram for the 48 spectroscopically confirmed T dwarfs discovered or re-identified in the CFBDS. Bins are defined such that Tn.5 dwarfs are counted in the Tn bin. The empirical spectral type vs. z'–J relation determined from these 48 BDs is Tn = −15.93 + 5.55 × (z' − J) with a 1 − σ scatter of 1.36 subtype. To address if the peak near T2–T3 is a product of our incomplete spectroscopic survey, we broaden our selection criteria to i' − z' ⩾ 2.0 but z' − J ⩾ 3.0 and assigned a spectral type to the 37 selected sources using this relation. The peak persists and we conclude that it arises from the larger volume probed for T2–T3 dwarfs (which are brighter than T0–T1 dwarfs).
Download figure:
Standard image High-resolution imageWe conclude that the peak at T2–T3 is not a product of our incomplete spectroscopic follow-up. The cause is instead that our magnitude-limited z'-band imaging survey probes a larger volume for the T2–T3 spectral types than for earlier T types. Indeed, the well-established J-band brightening persists in the z' band at the 0.3 mag level (Reylé et al. 2010) thus our CFBDS samples a volume about 50% bigger for T3 than for T0. That roughly agrees with our measured ratio of  from Figure 5.
Table 3 contains the spectrophotometric distances computed using the absolute magnitude versus spectral type relation of Liu et al. (2006). The uncertainties are about equally dominated by the adopted spectral type uncertainty of 0.5 and by the 0.35–0.40 mag scatter in the Liu relation.
3.2. Proper Motions
It has been argued by Zapatero Osorio et al. (2007) that field BDs belong to a kinematically young population probably because they were discovered in shallow surveys not sensitive to old T dwarfs. They measured velocity dispersions smaller than that of the thin disk and found a high fraction of BDs with Hyades moving group velocities, but used a small sample of only 21 BDs. However, Faherty et al. (2009), using a volume-limited 20 pc sample, conclude that the known field BDs (including T dwarfs) have velocity dispersions consistent with that of the thin disk population. It is informative to know where our CFBDS objects lie.
Our proper motion measurements (Table 4) always use the z'-band MegaCam images as the first epoch; the second epoch image is a WIRCam image (in the band with best-image quality—usually Ks) when available. Except for two exceptions, targets without WIRCam photometry are not included here but will be the subject of a future paper as precision astrometry is more challenging with narrow field-of-view instruments used for the J-band follow-up.
Table 4. Proper Motions of the Spectroscopic Sample
| Designation | PM total | μαcos δ | μδ | Baseline | Tangent. Vel. | Distance | U | V | W |
|---|---|---|---|---|---|---|---|---|---|
| ('' year−1) | ('' year−1) | ('' year−1) | (years) | (km s−1) | (pc) | (km s−1) | (km s−1) | (km s−1) | |
| ULAS J003402−005205 | 0.366 ± 0.024 | +0.011 ± 0.015 | −0.366 ± 0.024 | 2.21 | 21 ± 1a | 12.6 ± 0.6 | −20 | −11 | −2 |
| CFBDS J005910−011401 | 0.869 ± 0.033 | +0.865 ± 0.033 | +0.090 ± 0.036 | 1.91 | 37 ± 2b | 9.0 ± 0.5 | 22 | −12 | 9 |
| CFBDS J013302+023128 | 0.624 ± 0.031 | +0.614 ± 0.031 | −0.109 ± 0.028 | 3.05 | 65 ± 15c | 22 ± 5 | 34 | −41 | 11 |
| CFBDS J022644−062522 | 0.046 ± 0.040 | +0.032 ± 0.041 | −0.033 ± 0.039 | 4.01 | 13 ± 11c | 60 ± 8 | −8 | −7 | 7 |
| CFBDS J025401−182529 | 0.206 ± 0.038 | +0.205 ± 0.038 | +0.017 ± 0.044 | 2.54 | 40 ± 12 | 42 ± 10 | 16 | −19 | 26 |
| CFBDS J030135−161418 | 0.390 ± 0.041 | +0.364 ± 0.043 | +0.138 ± 0.031 | 1.99 | 66 ± 19 | 36 ± 10 | 41 | −18 | 42 |
| CFBDS J030225−144125 | 0.368 ± 0.017 | +0.314 ± 0.019 | −0.192 ± 0.013 | 4.47 | 66 ± 17 | 38 ± 10 | 0 | −57 | 25 |
| CFBDS J030226−143719 | 0.104 ± 0.013 | +0.087 ± 0.012 | −0.057 ± 0.015 | 4.47 | 25 ± 5 | 51 ± 10 | −6 | −18 | 13 |
| CFBDS J090139+174051 | 0.106 ± 0.014 | −0.064 ± 0.013 | −0.085 ± 0.014 | 2.93 | 33 ± 6 | 66 ± 11 | −4 | −18 | −15 |
| CFBDS J090449+165347 | 0.223 ± 0.016 | −0.165 ± 0.013 | −0.150 ± 0.018 | 2.53 | 68 ± 13 | 65 ± 12 | 10 | −35 | −44 |
| CFBDS J092250+152741 | 0.221 ± 0.011 | +0.127 ± 0.013 | −0.181 ± 0.010 | 3.00 | 39 ± 10 | 38 ± 10 | −36 | −23 | 13 |
| CFBDS J095914+023655 | 0.043 ± 0.042 | +0.028 ± 0.037 | +0.033 ± 0.046 | 3.36 | 30 ± 30 | 150 ± 31 | −14 | 26 | 29 |
| CFBDS J100113+022622 | 0.102 ± 0.009 | +0.088 ± 0.009 | +0.051 ± 0.009 | 1.97 | 46 ± 10 | 96 ± 21 | −30 | 28 | 41 |
| CFBDS J102841+565401 | 0.230 ± 0.023 | +0.224 ± 0.023 | −0.053 ± 0.028 | 1.89 | 27 ± 7 | 25 ± 6 | −32 | 5 | 23 |
| CFBDS J104209+580856 | 0.046 ± 0.032 | +0.030 ± 0.029 | +0.036 ± 0.035 | 1.88 | 7 ± 5 | 32 ± 8 | −13 | 11 | 7 |
| ULAS J145935+085751 | 0.162 ± 0.013 | −0.143 ± 0.013 | −0.076 ± 0.009 | 3.86 | 45 ± 8 | 59 ± 10 | 0 | −37 | 18 |
| CFBDS J150000−182407 | 0.698 ± 0.057 | −0.684 ± 0.058 | −0.138 ± 0.033 | 2.90 | 191 ± 52 | 58 ± 15 | 89 | −146 | 70 |
| SDSS J151114+060742 | 0.368 ± 0.009 | −0.273 ± 0.008 | −0.246 ± 0.010 | 5.52 | 41 ± 8 | 24 ± 5 | −8 | −36 | 12 |
| CFBDS J151803+071645 | 0.055 ± 0.010 | +0.048 ± 0.010 | −0.027 ± 0.010 | 3.78 | 20 ± 5 | 81 ± 14 | −25 | 9 | −6 |
| CFBDS J152655+034536 | 0.081 ± 0.016 | −0.080 ± 0.016 | −0.012 ± 0.016 | 2.95 | 25 ± 6 | 66 ± 11 | 0 | −14 | 19 |
| CFBDS J193430−214221 | 0.187 ± 0.012 | −0.182 ± 0.012 | −0.044 ± 0.011 | 3.04 | 30 ± 6 | 34 ± 7 | −22 | −9 | 30 |
| CFBDS J203737−192202 | 0.050 ± 0.015 | +0.011 ± 0.013 | +0.049 ± 0.015 | 2.80 | 18 ± 6 | 76 ± 14 | −3 | 21 | 9 |
| CFBDS J204803−183212 | 0.260 ± 0.028 | +0.099 ± 0.027 | −0.240 ± 0.028 | 2.48 | 49 ± 10d | 40 ± 7 | −10 | −35 | −20 |
| CFBDS J212702+002344 | 0.150 ± 0.016 | +0.148 ± 0.016 | −0.024 ± 0.014 | 3.53 | 42 ± 9 | 60 ± 12 | 16 | −1 | −25 |
| CFBDS J223856+034947 | 0.204 ± 0.021 | −0.116 ± 0.022 | −0.167 ± 0.021 | 2.52 | 69 ± 14 | 72 ± 13 | −71 | −25 | −2 |
| CFBDS J232304−015232 | 0.113 ± 0.020 | +0.095 ± 0.019 | −0.061 ± 0.021 | 4.44 | 15 ± 5 | 29 ± 8 | −2 | −5 | 0 |
| CFBDS J232620−025643 | 0.043 ± 0.026 | −0.042 ± 0.026 | +0.007 ± 0.019 | 3.57 | 11 ± 7 | 57 ± 12 | −18 | 10 | 11 |
Notes. The first epoch is based on MegaCam z-band discovery images and the second epoch on WIRCam near-IR follow-up images. Tangential velocities are based on the estimated spectrophotometric distances presented in Table 3. Local standard of rest UVW components are estimated assuming a null radial velocity. aA distance of 12.6 ± 0.6 pc from trigonometric parallax was used (Smart et al. 2010). bA distance of 9.0 ± 0.5 pc from trigonometric parallax was used (L. Albert et al. 2011, in preparation). cThe J-band data is from small field-of-view NTT follow-up images projected on the z MegaCam image. dA distance of 40 ± 7 pc was used based on the system being a tight binary.
Download table as: ASCIITypeset image
The separation between the two epochs is usually more than two years. We match the astrometric frames of the two instruments by interpolating the MegaCam image to the frame of the near-infrared image, using Scamp (Bertin 2006) to derive a polynomial mapping between bright unsaturated stars of the two images and Swarp (Bertin et al. 2002) to produce the resampled MegaCam images. We then use SExtractor (Bertin & Arnouts 1996) to accurately measure the position of the T dwarfs (and its uncertainty) in both images for each epoch.
The proper motion uncertainties are about equally dominated by the epoch-to-epoch mean position scatter and the differential chromatic refraction (DCR) error. The astrometric mismatch between the two epochs is at the level of 001–002. We adopt the rms of a large number of unsaturated stars as the centroid uncertainty of our target. Due to the very steep slope of T dwarf spectral energy distributions in the z' band, we estimate that T dwarfs have a ∼40 Å redder effective wavelength in the z' filter than M-type field stars which provide the astrometric reference. The T dwarf therefore suffers significantly less refraction than its references, 001–002, depending on the air mass (we used the IDL program by Marchetti found on this Web site: https://www.eso.org/gen-fac/pubs/astclim/lasilla/diffrefr.html). The DCR is neglected in the NIR bands as its effect is an order of magnitude smaller.
We corrected for the parallax motion using the estimated distances of Table 3. For most targets, the motion amounts to <003 and represents a correction of <15% on the quoted proper motions. Two exceptions are CFBDS 1042+58, a nearby slow moving BD, whose parallax motion is 50% of its proper motion; and CFBDS 030226−14, with a 35% effect, because of a half-year observational phase shift.
Our proper motion measurement of ULAS0034 (μα = +11 ± 15 mas yr−1, μδ = −366 ± 24 mas yr−1) agrees with that of Smart et al. (2010) (μα = −20.0 ± 3.7 mas yr−1, μδ = −363.8 ± 4.3 mas yr−1) within 2σ in α and <1σ in δ.
Tangential velocities were derived for the 27 BDs with proper motions and estimated spectrophotometric distances. Most BDs in this paper have tangential speeds below 50 km s−1 with a median of 37 km s−1. This is a bit higher than the 29 km s−1 found for the 20 pc volume-limited field T dwarf sample of Faherty et al. (2009, Figure 7). If the difference were statistically significant, then it could be interpreted as an age difference with our sample being older than the estimated 2.7+1.0 − 0.8 Gyr for the field T dwarfs.
Our survey fields are not uniformly distributed over the sky so there may exist a bias in our median tangential velocity. We attempt to lift this bias by comparing velocities in the UVW local standard of rest, see Figure 6. UVW components were calculated using the IDL implementation (gal_uvw.pro) of Johnson & Soderblom (1987) and corrected for the solar motion. At R ≈500, one element of spectral resolution on our Gemini/VLT spectra corresponds to ∼600 km s−1 yielding a precision no better than 60 km s−1 assuming shifts of a tenth of a resolution element are achieved. That is too large for useful radial velocity measurements so we plot radial velocities of 0 km s−1 and draw lines corresponding to ±25 km s−1 which is roughly the 1σ velocity spread of solar neighborhood stars (Bochanski et al. 2007). Histograms are projected on the axis with the thin/thick disk Bochanski et al. Gaussians for reference.
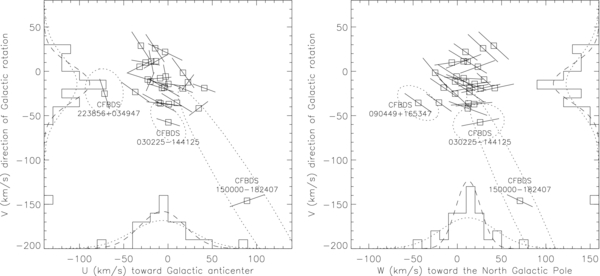
Figure 6. Local standard of rest (LSR) velocities for the 27 BDs with measured proper motions. Radial velocities, vrad, are unknown so the squares represent the UVW components with vrad = 0 and the error bars represent an arbitrary vrad = ±25 km s−1 dispersion. Uncertainty ellipses were drawn in dash for the outliers and include both the vrad = ±25 km s−1 "error bar" and the distance uncertainty. Histograms for each of the UVW components are drawn and the Gaussian distributions of the solar neighborhood stars within 100 pc (Bochanski et al. 2007) are overplotted for reference. The dashed line is the thin disk, the dotted line is the thick disk, and a Gaussian fit to our histogram is not shown. The Gaussian widths are (σU, σV, σW)thin = (25.7, 20.9, 14.1) km s−1, (σU, σV, σW)thick = (34, 29, 31) km s−1, and (σU, σV,σW)CFBDS ⩾ (20, 22, 17) km s−1.
Download figure:
Standard image High-resolution imageEllipses represent the 1σ UVW uncertainties and, for clarity, are drawn only for the few kinematically peculiar targets. The ellipse of CFBDS 030225−144125 is typical for that of the rest of the sample. The arbitrary ±25 km s−1 radial velocity is factored into the ellipse.
The kinematics of our sample is more consistent with that of the thin disk than that of the thick disk. Our own Gaussian fits to the histograms yield values of (σU, σV, σW) = (20, 22, 17) km s−1 while that of the thin disk is (σU, σV, σW)thin = (25.7, 20.9, 14.1) km s−1 and that of the thick disk is (σU, σV, σW)thick = (34, 29, 31) km s−1. Our numbers have to be taken as lower limits because non-zero radial velocities can only expand the distribution, but likely not enough to mimic a thick disk distribution.
CFBDS J150000−182407 stands out as a particularly high-velocity BD with a tangential velocity of ∼190 km s−1. It is well isolated in the UVW diagram with a V-component in the direction of galactic rotation of ∼146 km s−1 and U and W components of 89 km s−1 and 70 km s−1, consistent with thick disk kinematics. With a spectral type of T4.5, CFBDS J150000−182407 is likely one of the first T-type sub-dwarf candidates with ULAS J141623.94+134836.3B (Burgasser et al. 2010). This is supported by the absence of the K i doublet at 1.25 μm indicative of low metallicity.
Three other BDs show marginally high velocities. CFBDS J223856+034947, a T2.0 dwarf, is a 2σ outlier in the UV plane with U = −71 km s−1 but shows normal photometry and has a spectrum in H-band only.
CFBDS J030225−144125, a T6.0 dwarf at 38 ± 10 pc, is a <2σ outlier in both UV and VW planes. Its photometry is within the color trends so there is no other sign of peculiarity.
Finally, CFBDS J090449+165347, a T4.0 dwarf at 65 ± 12 pc, is a <2σ outlier only in the VW plane but does not show other sign of peculiarity.
3.3. Color versus Spectral Type Diagrams
It is interesting to compare the colors of our BDs to the literature to identify outliers and perhaps discover new trends. Figure 7 presents the NIR colors of the CFBDS spectroscopic sample as a function of spectral type. Note that several of the 48 BDs do not have full NIR photometric follow-up. Our photometry is plotted as open squares while small plus signs are from Knapp et al. (2004), small crosses are from Chiu et al. (2006), and open triangles are late T8+ dwarfs recently discovered: Wolf 940B (T8.5, Burningham et al. 2009), ULAS 1017 (T8.0), ULAS 1238 (T8.5) and ULAS 1335 (T9.0) (Burningham et al. 2008), CFBDSIR 1458+10 (T8.5, Delorme et al. 2010), ULAS 1302+13 (T8.5, Burningham et al. 2010b), and UGPS 0722−05 (T9/T10, Lucas et al. 2010).
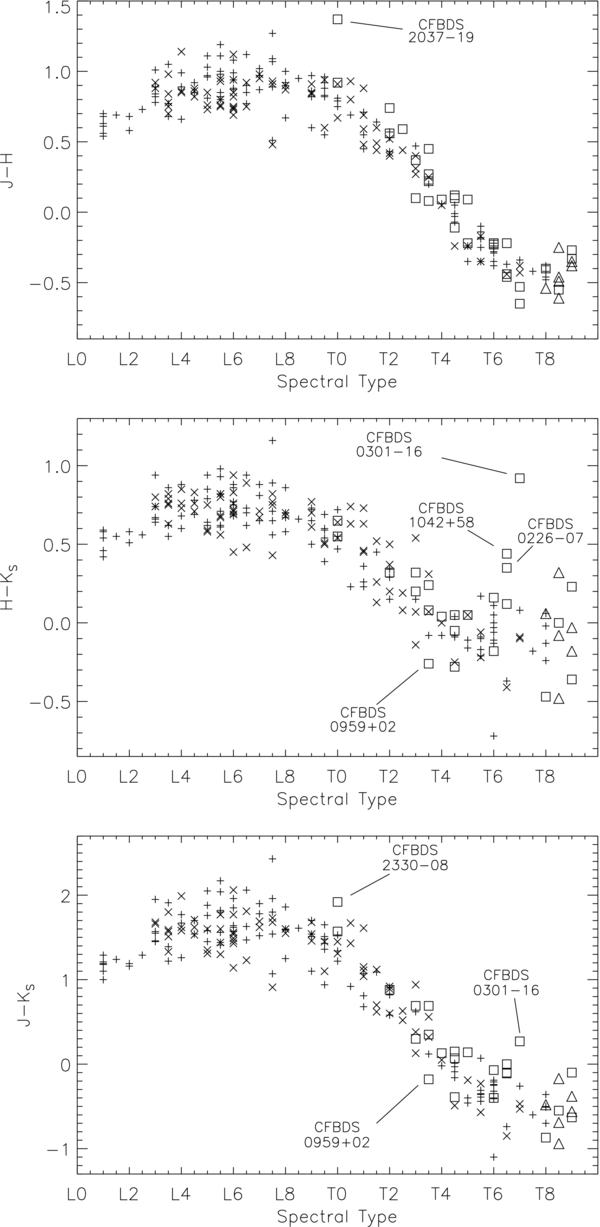
Figure 7. Near-IR colors of the spectroscopic CFBDS sample. Open squares are the CFBDS photometry, the plus signs are 111 dwarfs from Knapp et al. (2004), crosses are 73 dwarfs from Chiu et al. (2006) while open triangles are late T dwarfs from the literature. The most obvious CFBDS outliers are identified and details are given in the text.
Download figure:
Standard image High-resolution image
The J − H, H − KS, and J − H plots follow the same general trends as that in the literature. The colors of T dwarfs get bluer with later types until a plateau with larger dispersion is reached at around T6/7. The relation with spectral type is tighter for the J − H color and the spread is larger in the H − KS plot.
The noteworthy outliers in these diagrams are CFBDS 0226−07, CFBDS 0301−16, CFBDS 0959+02, CFBDS 1042+58, CFBDS 2037−19, and CFBDS 2330−08. In the H − KS diagram, CFBDS 0226−07, CFBDS 0301−16, and CFBDS 1042+58 all have very red colors for their spectral type, respectively, +0.35, +0.92 ± 0.12, and +0.46 ± 0.06.
The T7 dwarf CFBDS 0301−16 is very peculiar, lying off the mean relation also in J − KS. According to BT-Settl models, small changes in surface gravity have very significant effects on the H − KS and J − KS colors at that spectral type. When gravity goes from log (g) = 4.5 to log (g) = 3.5, H − KS jumps by +1.5 mag and J − KS by +3 mag. The surface gravity of CFBDS 0301−16 is possibly small, in the regime of log (g) = 3.5–4.0 if we take the models at face value. Assuming Teff = 800–1000 K (based on the Stephens et al. (2009) temperature versus spectral type relation), then blindly applying the evolutionary models of Baraffe et al. (2003) suggest a mass and age of ⩽9 MJup and ⩽100 Myr. Higher metallicity could also produce similar effects. We also caution that models have notorious difficulties in reproducing BD colors so conclusions are only indicative.
Similar conclusions of lower surface gravity and/or higher metallicity are reached for T6.5 CFBDS 1042+58 and T6.5 CFBDS 0226−07. If we assume log (g) = 4.0–4.5 and Teff = 800–1100 K, then the mass and age possibly are ⩽15 MJup and ⩽500 Myr. In the case of CFBDS 1042+58, youth is also supported by the very small tangential velocity measured at 8 ± 6 km s−1.
CFBDS 0959+02 shows blue colors for a T3.5 dwarf (H − KS = +0.07 ± 0.16, J − KS = +0.08 ± 0.19) and is one of the two BDs isolated in the CFHTLS Deep fields with a distance of about 150 ± 31 pc. Again, the H − KS color is very sensitive to gravity and this dwarf possibly has a large log (g) ≈ 5.0–5.5 or low metallicity. Assuming Teff = 900–1200 K and using the Baraffe et al. (2003) models at face value yield a large mass and old age of ⩾30 MJup and ⩾1.0 Gyr.
CFBDS 2037−19 is 0.5 mag redder in the J − H diagram than any other early-T dwarf in the literature. But the same dwarf follows the normal trends in other color–color diagrams which challenges a model atmosphere-based explanation. Perhaps this L/T transition object is variable?
Finally, we note that one of our two T8 dwarfs, CFBDS J102841+565402, is nearly as blue as CFBDSIR J145829+ 101343 (Delorme et al. 2010), second to only SDSS J141623.94+134836.30B (Burningham et al. 2010a) among the bluest T8/T9 dwarfs for both of the H − KS and J − KS color plots. This is an indication of high gravity and/or low metallicity.
3.4. Binarity
Direct imaging surveys (Gizis et al. 2003; Bouy et al. 2003) that probe separations of >2 AU show that ∼10%–15% of field BDs are binaries with separations that peak between 2 and 4 AU. Lower separations probed by spectroscopic surveys (see Joergens 2008, and references therein) contribute a further 7+5 − 3% (separations <0.3 AU) or 10+18 − 8% (separations <3 AU). The true BD binary fraction is likely between 15% and 25%. For our sample of 48 dwarfs, we therefore expect about 7–11 binary BDs.
A laser guide star adaptive optics (LGSAO) program at Keck is underway (Liu & Dupuy) to follow-up CFBDS candidates and will be the subject of a future publication. What follows is a detailed discussion for three systems for which binarity is suspected or has been constrained by means other than the LGSAO program.
- 1.CFBDS J022644−062522. This T3.0 BD is found ∼40'' from HD 15200, a K0 star, whose Hipparcos parallax indicates a distance of 43 pc (parallax = 23 mas) while its spectrophotometric distance is 50 pc (based on an absolute magnitude of V = +5.5 for K0 dwarfs and an apparent magnitude of V = 8.98). CFBDS 0226−06 is estimated to be at 60 ± 8 pc so their distance is similar within ∼1.5σ. Proper motions alone are consistent within 1σ. The BD proper motion is measured at μtot = 46 ± 40 mas yr−1 or (μαcos (δ), μδ) = (+32 ± 41, −33 ± 39) mas yr−1 while that of the K0 star is μtot = 22.3 ± 1.8 mas yr−1 or (μαcos (δ), μδ) = (+21.8 ± 1.2, +4.6 ± 1.3) mas yr−1 (Høg et al. 2000). Unfortunately, proper motion measurements suffer from a large uncertainty because the second epoch image is a narrow field-of-view SOFI image with poorer astrometry.If the system is physically associated, assuming a distance of 50 pc, the apparent separation is ∼200 AU. The list of star/T dwarf systems is GJ 229B (T8+M1) (Nakajima et al. 1995), GJ 570D (T7.5+K4+M1.5+M3) (Burgasser et al. 2000), Epsilon Indi Bab (T1.5+T6+K5) (Scholz et al. 2003), HN PegB (T2.5+G0) (Mugrauer et al. 2006), HD 3615B (T7.5+K0) (Luhman et al. 2007), Wolf 940B (T8.5+M4) (Burningham et al. 2009), G 204-39B (T6.5+M3) (Faherty et al. 2010), Ross 458C (T7+M0.5+low mass) (Goldman et al. 2010), and Hip 73786B (T6.5+K5) (Scholz 2010). Only HN Peg and Epsilon Indi have an early T companion which makes CFBDS 0226−06 potentially interesting to study the L/T transition. Our search of the literature did not yield interesting information on HD 15200 beside its proper motion and photometry.
- 2.CFBDS J030225−144125 and CFBDS J030226−143719. These two dwarfs, of spectral types T6 and T4, are separated by only 4 arcmin on the sky (mostly along the North–South direction). The WIRCam J-band magnitudes of, respectively, 17.75 ± 0.03 and 17.50 ± 0.03 (Table 2) and absolute J magnitudes of 14.7 and 14.3 for T6 and T4 dwarfs (Knapp et al. 2004, Figure 8) result in spectroscopic distances of 38 ± 10 pc and 51 ± 10 pc. Their difference is well within the dispersion of the magnitude versus spectral type relation, suggesting that they might form a bound pair. A few physical pairs of low-mass stars or BDs are separated by over 1000 AU (Artigau et al. 2007; Caballero 2007), but at 40 pc the separation of this CFBDS pair would be ∼10, 000 AU. The two proper motions however are incompatible, (μαcos (δ), μδ) = (+ 314 ± 19, −192 ± 13) mas yr−1 versus (μαcos (δ), μδ) = (+ 87 ± 12, −57 ± 15) mas yr−1, and the pair instead serves as a reminder that objects as rare as T dwarfs (with a density under 1 per 10 deg2, to the CFBDS limiting magnitude) can occasionally pair within a few arcminutes.
- 3.CFBDS J102841+565402. This BD is within 15'' of a r = 15.7 and i = 14.6 star, bright enough for use as a reference star for the CFHT PUEO adaptive optics system (Rigaut et al. 1998). A 30 minute H-band integration on 2008 April 17 produced an image with FWHM = 02 and no sign of elongation. For equal luminosity components, we thus conservatively rule out a companion with a separation >2.5 astronomical units.
4. CONCLUSIONS
The analysis of the 780 deg2 Canada–France Brown Dwarfs Survey is completed with most of the J-band follow-up secured. The yield is about 70 very red i'AB − zAB' ⩾2.5 and z'AB − JVega ⩾3.15 BD candidates. To date, 48 of these have been followed-up spectroscopically and confirmed as T-type BDs. We obtained near-infrared spectra for 43 T dwarfs discovered (or re-discovered independently) in the CFBDS survey (Delorme et al. 2008b), using GNIRS and NIRI on the Gemini-North and South telescopes and ISAAC at the VLT. Finder charts are presented for the 37 new discoveries. Our sample includes both one of the latest BDs known (CFBDS J005910−011401; Delorme et al. 2008a) and one of the first likely T subdwarf (CFBDS J150000−182407). Their spectral types range from T0 to T9 and their effective temperatures range from 1300 K to 550–650 K, while their gravity spans more than a decade, log g = 4.0 to log g = 5.5. Most (25) spectroscopically confirmed CFBDS dwarfs have T2.0–T4.5 spectral types while eight are T7.0 or later.
Spectral typing made use of the indices of Burgasser et al. (2006). A majority (29) of our BDs have H-band only spectra while 14 have multi-band spectra. Among the later, SDSS 1511+06 (T2.0) is peculiar with discrepant H2O − H, CH4 − H indices by >2 subtypes. We obtained WIRCam follow-up Y, J, H, KS photometry for 25 dwarfs. Our color versus spectral type plots isolate interesting outliers. The T7.0 dwarf CFBDS J030135−161418 has very red H − KS and J − KS colors which is indicative of very low surface gravity and/or high metallicity which means this is possibly a low-mass and young field BD. To a lesser degree, similar conclusions are reached for the T6.5 dwarf CFBDS J104209+580856 which possibly has small mass and age. In this case, youth is also supported by the very small tangential velocity measured at 8 ± 6 km s−1.
Two of the new CFBDS BDs have spectral types of T8 or later, CFBDS J102841+565402 (T8.0) and CFBDS J013302+023128 (T8.5). When compared to CFBDS0059, 2M0415 and ULAS0034 in the K/J and WJ plane, their small K/J index suggest they both may be 700–800 K, high log (g) dwarfs on the massive end of the spectrum.
The time base of the observations allows us to measure accurate proper motions for 27 objects. The vast majority of the objects are consistent with thin disk UVW velocities, but the proper motion of CFBDS150000−182407 indicates that it belongs to the thick disk, consistent with its [Fe/H] ≈−0.5 subsolar metallicity. Proper motion measurements also indicate that CFBDS J022644−062522, a T3.0 dwarf, may be physically associated with a K0 star at a separation of ∼200 AU. This would represent a rare case of an L/T transition companion to a main-sequence star.
A detailed analysis of the CFBDS sample selection, completeness limits, luminosity function, and space density is the subject of a separate paper (Reylé et al. 2010). It confirms and refines the L5-T8 BD space density found by Cruz et al. (2007) and Metchev et al. (2008) and hints at a possible density increase for T9 dwarfs, with large uncertainties.
We plan in the near future to obtain spectra for an additional 20 strong T identified from i', z', J CFBDS photometry.
Special thanks go to the observers and queue coordinators at CFHT, Gemini, and VLT for their invaluable work in obtaining all of the spectra and images presented in this paper. Thanks to Olivier Lai and Benjamin Lenoir for having shared some of their PUEO time, to Henry McCracken for his COSMOS photometry. Financial support from the Programme National de Physique Stellaire (PNPS) of CNRS/INSU, France, is gratefully acknowledged. This research has benefitted from the M, L, and T dwarf compendium housed at DwarfArchives.org and maintained by Chris Gelino, Davy Kirkpatrick, and Adam Burgasser.