
ABSTRACT
The spectroscopic properties of a sample of 92 Population I bright stars (V<8) with literature values of [Fe/H]≥ + 0.1 are reviewed in order to study the metallicity scale at supersolar regimes. For 73 of these candidate super–metal‐rich (SMR) stars we identified the photospheric fiducial parameters (Teff,log g, [M/H]) from among published parameter sets via a comparison of new observations in the wavelength range 5034–5398Å with synthetic spectra derived from the 1997 database of Chavez et al. As a main issue in our analysis, we find that a "genuine" SMR stellar component in the Galactic disk exists with more than one‐fourth of the stars in our sample fulfilling the criterion [Fe/H]≥0.2 dex, and three of them as rich as [Fe/H]> + 0.4 dex.
Export citation and abstract BibTeX RIS
1. INTRODUCTION
Recent systematic observations of stellar populations in external galaxies and local aggregates have been providing extensive evidence for enhanced chemical evolution. The Galactic bulge is probably the most direct example in this sense, with an important fraction of its integrated luminosity supplied by red giant stars whose spectra are line‐enhanced compared to the Sun (Whitford & Rich 1983). Preliminary studies of the bulge stellar population agreed in attributing to such stars a mean metallicity larger than solar ([Fe/H]≳ + 0.2), with some objects in excess of [Fe/H]≳ + 1(Rich 1988; Terndrup, Frogel, & Whitford 1991; Geisler & Friel 1992).
As summarized in McWilliam (1997) and extensively discussed by Taylor (1991, 1994a, 1994b, 1995, 1996, 1999a, 1999b) in a comprehensive series of review papers, the terms and the limits of the definition of super–metal‐rich (SMR) stars still need to be further investigated. A central issue hinges around whether very strong lined (VSL) stars are really to be explained in terms of metal excess or rather demand supplementary physical alternatives. More elaborate interpretation is now reducing the metallicity estimate for the Galactic bulge to less extreme boundary limits, probably not so far from the solar value (McWilliam & Rich 1994; Sadler, Rich, & Terndrup 1996; see Frogel 1999 for a recent review).
Following the original definition of Spinrad & Taylor (1969), also adopted in Taylor's (1996) general discussion, SMR stars are those exceeding the Hyades metallicity (originally set at [Fe/H] = +0.2). While setting up any quantitative threshold is just a matter of subjective definition, nonetheless it is clear that we must eventually rely on a comparison with the solar abundance taken as a reference point. In fact, the supermetallicity phenomenon requires detailed comparison of element abundances among the entire pattern of "metallic" elements which is better feasible by assuming the Sun as comparison candle instead of relying on the less exhaustive Hyades data.
There are at least two main difficulties that we should consider in this regard. First of all, it is clear that "metals" are in fact a quite composite family of elements, each of them with its own genesis dealing with supernova processes and/or with the quiescent burning phases inside stellar interiors. Indeed, we know for instance that Population II stars display a trend of enhanced [O/Fe] at low‐Z regimes (Gratton & Ortolani 1986, Barbuy 1988; Abia & Rebolo 1989; Bessell, Sutherland, & Ruan 1991; Edvardsson et al. 1993). This can be regarded as an instructive example of a selective "supersolar" abundance even in a "subsolar" chemical framework.
A second difficulty results from the lack of template metal‐rich spectra (with the possible controversial exception of μ Leo; see, for example, Castro et al. 1996, and Taylor 1996, 1999c) against which other stars can be calibrated, and so determinations of metal richness rely largely on model atmosphere predictions. The drawback in this case resides in the limits of theory to handle the complex thermodynamic environment in the stellar atmosphere (non‐LTE equilibrium, microturbulence, convection, oscillator strengths for a complete set of chemical elements, molecule treatment, etc.).
Big steps have, however, been accomplished by theory in recent years, allowing a fully sophisticated modeling of the spectral energy distribution of stars, especially when restricted to temperatures of T>4000 K (Bell & Gustaffson 1978; Tsuji 1978; Bessell et al. 1989; Buser & Kurucz 1992; Tripicco & Bell 1990, 1995; Kurucz 1979, 1993, hereafter K93). In particular, Kurucz models are recognized as among the few main trusted reference sources for systematic theoretical investigation of stellar atmospheres.
In line with previous work of our group on theoretical synthesis of spectral features in stars (Gulati, Malagnini, & Morossi 1993; Malagnini et al. 1994; Chavez 1995; Chavez, Malagnini, & Morossi 1995, 1996b; Chavez et al. 1996a, 1996c), in this paper we perform a quantitative study of SMR candidates in the solar neighborhood. Our results could thus provide a general interpretative tool to tackle the problem of SMR stellar populations in the Milky Way as well as in external galaxies, via population synthesis studies.
The present work is based on new spectroscopic observations of a large sample of reportedly iron‐rich stars in the Galactic disk, according to the current literature. As a primary step in our analysis, we especially intend to focus here on determining preferred values of the atmospheric parameters (effective temperature, surface gravity, overall metallicity) for each star in the sample. This is done by comparing the observed spectra with the appropriate synthetic ones extracted from the grid by Chavez et al. (1997, hereafter CMM). The idea of using moderate‐resolution spectra to be compared with synthetic ones instead of carrying out further high‐resolution studies of SMR candidates is based on the following considerations: (1) Most high‐resolution studies are carried out on very narrow wavelength ranges, thus making impossible the actual determination of Teff. The use of "external" Teff values is in fact one of the main causes of the spread in the metallicity results reported in the literature. With our approach we are able to check simultaneously Teff,log g, and [Fe/H]. (2) Errors in the atomic data may play a very critical role in high‐resolution analyses, in particular when only few lines are analyzed, while they may be washed out by using a much larger number of features as in the case of comparing the observed spectra as a whole. (3) The amount of time and effort needed to cover at high resolution a significant number of objects for creating a stellar library for population synthesis work is so high that it practically prevents this kind of approach. And (4) the moderate‐resolution approach is directly applicable to studies of the case of external galaxies.
Our model output will eventually serve as a reference framework in a following paper (A. Buzzoni, M. Chavez, M. L. Malagnini, & C. Morossi 2000, in preparation) to match the Lick narrowband spectrophotometric indices (Burstein et al. 1984; Worthey et al. 1994), and calibrate them versus metallicity.
We arrange our work by presenting first the observational database in § 2 and the comparison between synthetic spectra and observations in § 3. Section 4 is devoted to the discussion of our results in terms of [Fe/H] for the stellar sample as a whole and for individual objects. Our conclusions are given in § 5.
2. OBSERVATIONS AND DATA REDUCTION
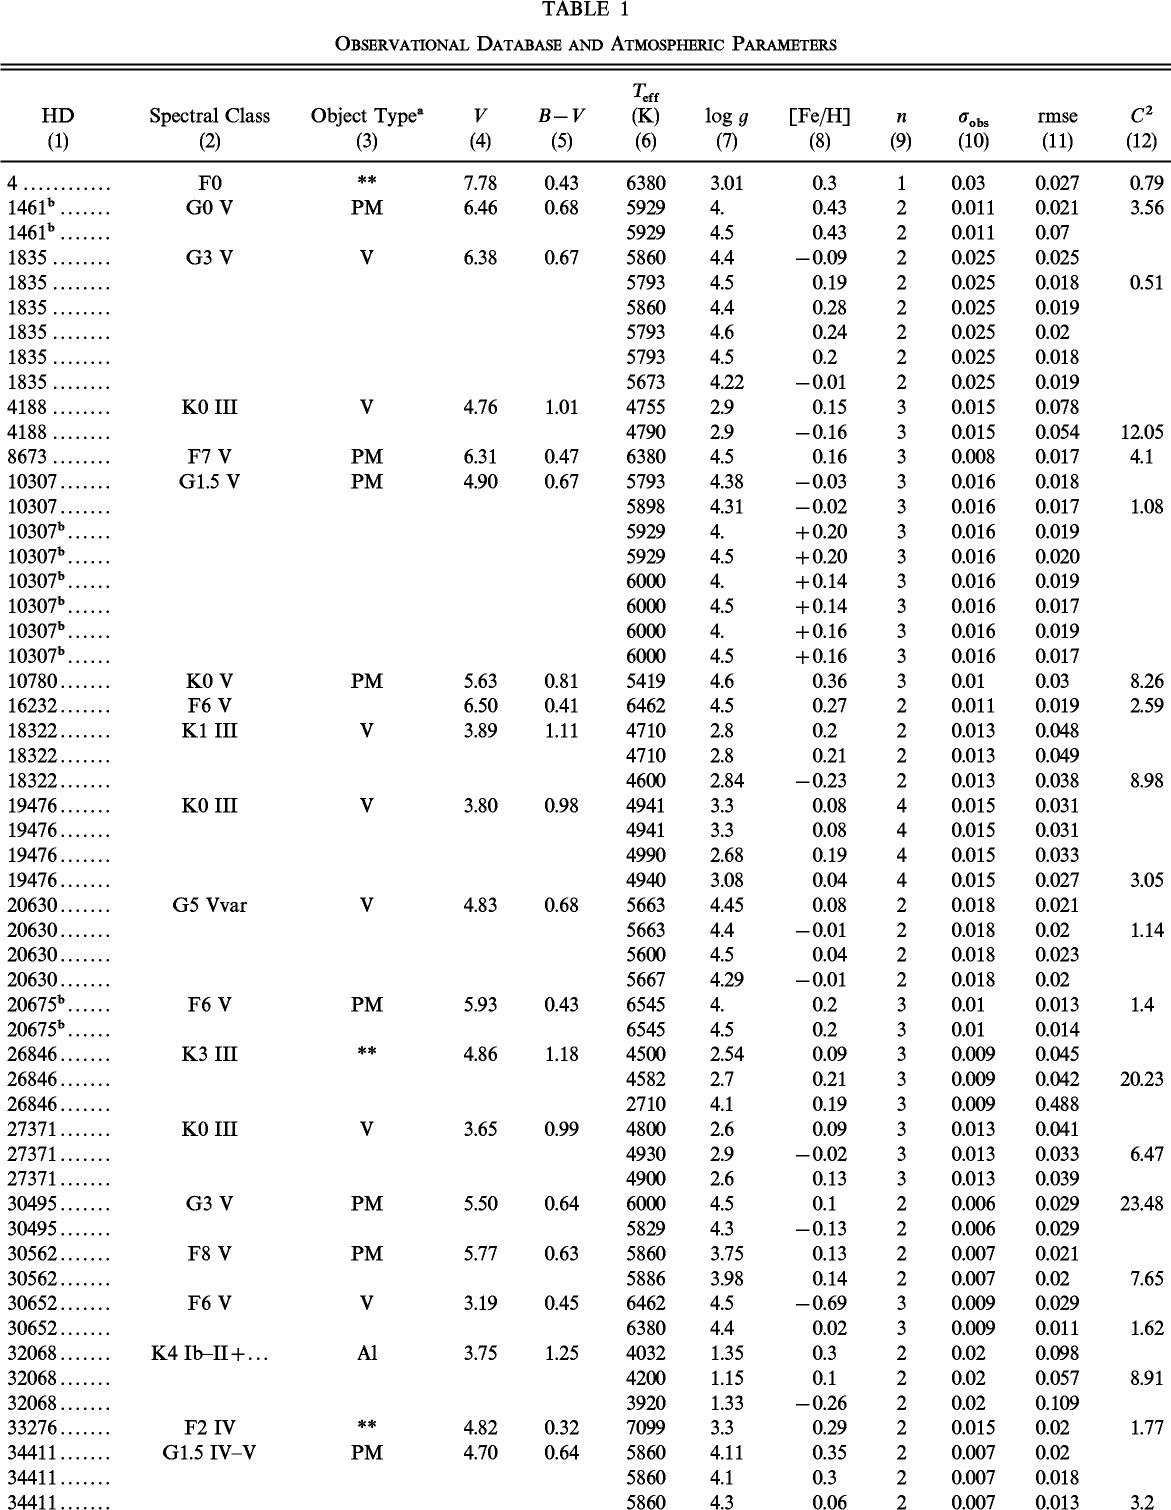
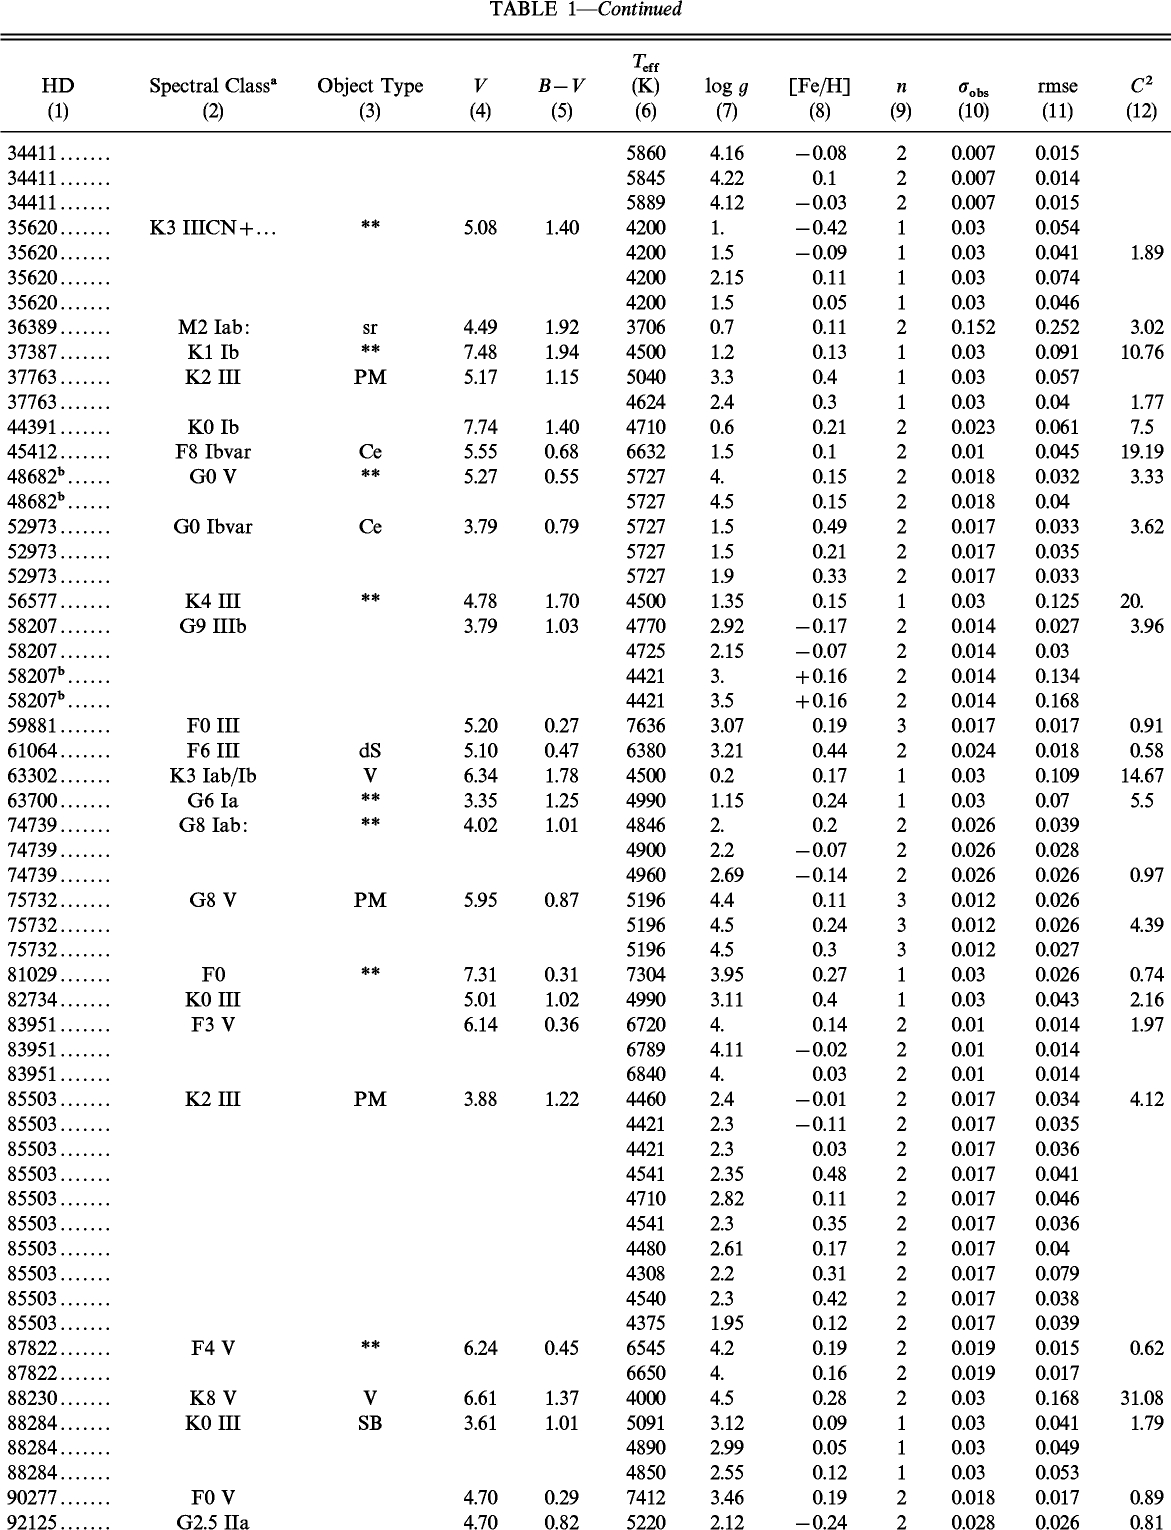
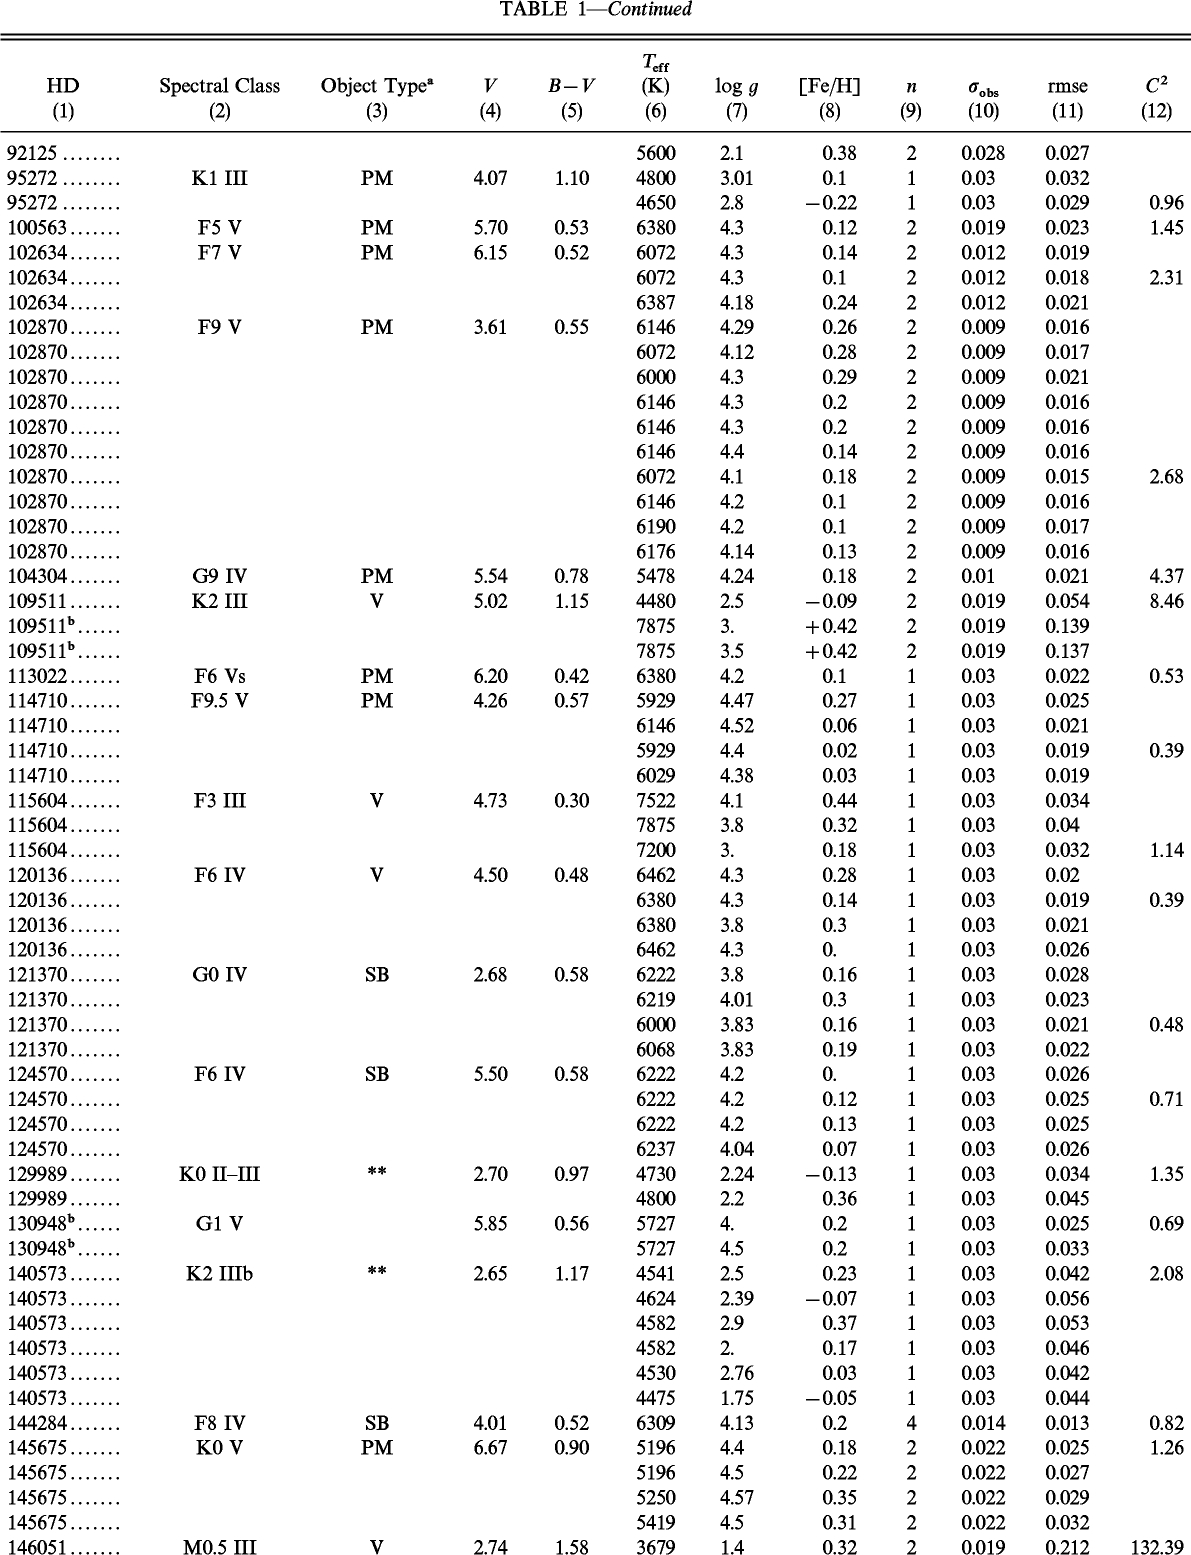
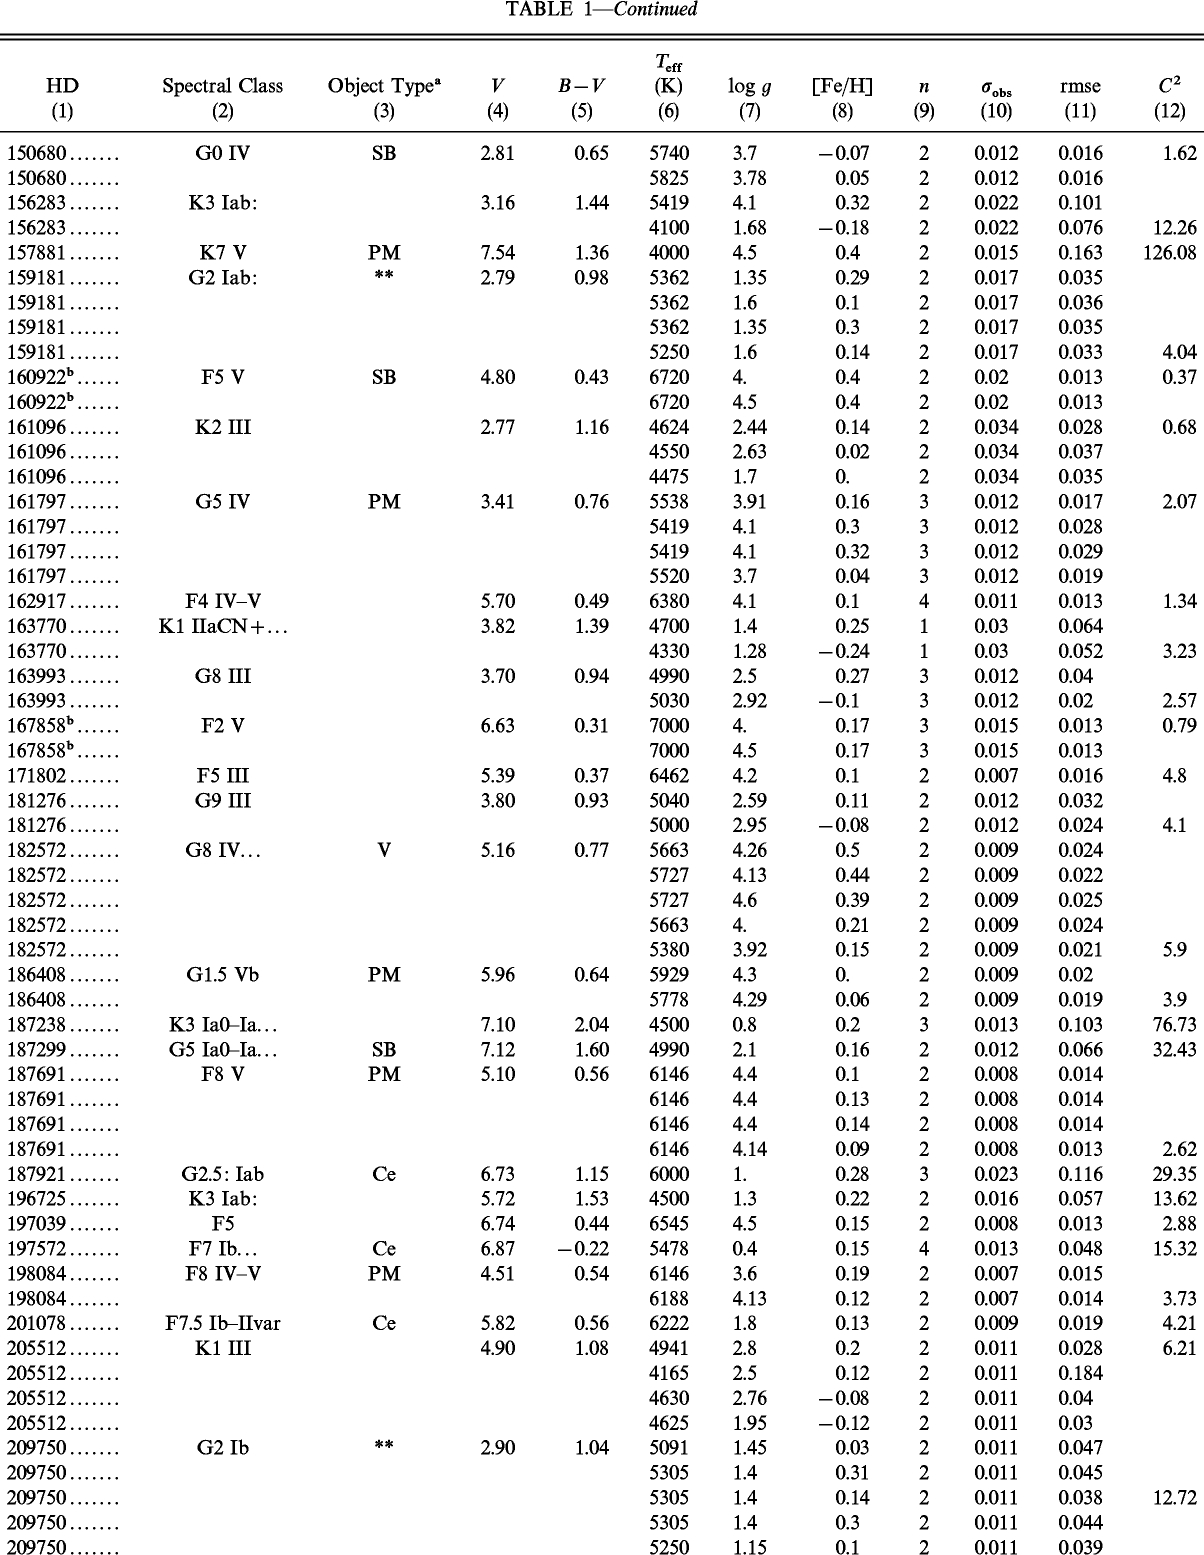
Our list of candidate SMR stars is derived from the general catalog of Cayrel de Strobel et al. (1997, hereafter CAY97), which represents the most complete and updated collection of [Fe/H] determinations from high‐resolution analyses. The target stars were selected by applying a conservative selection criterion, i.e., stars with [Fe/H]≥ + 0.1 dex in at least one of the determinations reported in CAY97.2 Our sample eventually comprised 92 bright stars in the spectral range between F and M, luminosity class between I and V, and apparent magnitude V<8 mag. The 91 stars of the final sample3 are listed by HD number in Table 1.
 |
 |
 |
 |
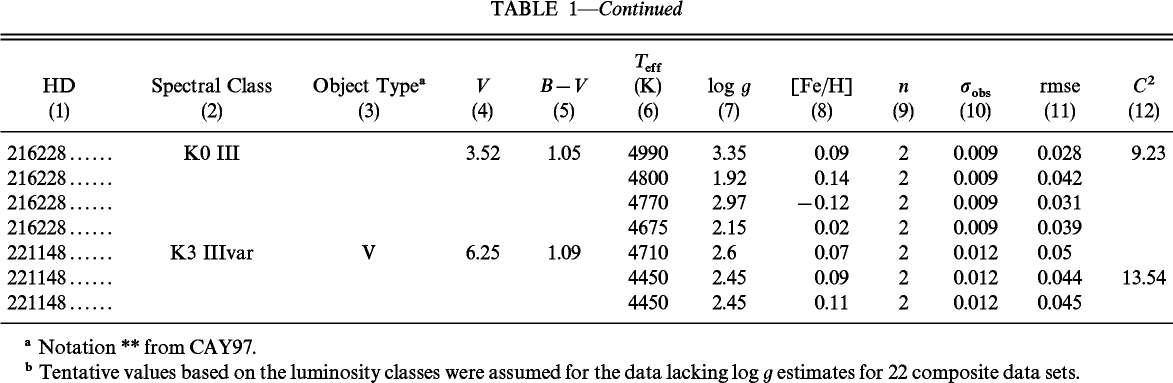 |
For the 91 stars, CAY97 lists 210 individual complete data sets of atmospheric parameters (Teff,log g, [Fe/H]) and 11 other data sets with no indication of log g. Among the 88 stars with assigned luminosity class, there are 55 objects of spectral types F and G, and 33 of types K and M. The first group has a majority of dwarfs (67%), while the second one is composed almost exclusively of evolved stars (88%). This working sample was observed during three runs at the 2.12 m f/12 telescope of the INAOE "G. Haro" Observatory in Cananea (Mexico). Observations on six nights were accomplished between 1995 December and 1996 August collecting mid‐dispersion (35 Å mm−1) spectroscopic data for the whole sample of stars. The telescope was equipped with a Boller & Chivens spectrograph working with a 600 groove mm−1 grating in the range 4600–5500 Å at mid‐resolution (2.5 Å FWHM at 5000 Å blazing or R = λ/Δλ = 2000 inverse resolution). The detector was a 1024 × 1024 back‐illuminated Tektronix CCD with 24 μm pixel size. This provided a plate scale of 0.83 Å pixel−1 in the wavelength direction and 0 45 pixel−1 in the spatial direction. Of the total sample, 70 stars had two or more observations on different nights, while 22 stars were observed only once. Multiple observations allowed us a fair estimate of the internal accuracy of the whole data set. Each star frame was also accompanied by a calibration spectrum of a reference He‐Ar lamp; standard stars from the list of Gutiérrez‐Moreno et al. (1988) were observed several times during each night to allow relative flux calibration. Various bias frames were obtained throughout to check CCD response stability, and halogen lamp continuum flat‐field frames were collected each night by illuminating the dome. Seeing conditions were not exceptional, reaching typically 16–18 FWHM throughout the different observing runs. This, however, is not a problem given the brightness of the target stars. A signal‐to‐noise ratio (S/N) in the range 50–200 was typically achieved in the 185 observed spectra. The relevant information on the observational database is summarized in Table 1. For each star, columns (1)–(5) report HD number, spectral type, object type, apparent visual magnitude, and B−V color from CAY97. Columns (6)–(8) give the atmospheric parameter determinations, again from CAY97. Tentative values based on the luminosity classes were assumed for the data sets lacking log g estimates and 22 "composite" data sets (marked by asterisks in Table 1) were derived. Columns (9) and (10) contain the number of observations and the mean internal noise,σobs = σ(flux), computed from repeated observations as the average of the punctual standard deviation of different spectra of the same object over the whole sampled spectrum.
Data analysis was performed with the IRAF software package developed at NOAO (Image Reduction and Analysis Facility 1992). The ONEDSPEC routines were used in the data processing.
Original spectra were bias‐subtracted and corrected for the high‐frequency CCD quantum efficiency pattern by dividing by a normalized flat‐field frame. Sky and possible scattered light was then subtracted by fitting a plane across the stellar spectrum, and CCD rows in the central FWHM spatial profile of the star were co‐summed to obtain a one‐dimensional spectrum. Wavelength calibration was accomplished by comparison with the He‐Ar lamp reference spectrum to derive the pixel/wavelength dispersion function, and the mean CCD response curve in the relevant wavelength range was obtained for each night from the observation of the standard stars. Relative flux calibration was eventually accomplished by dividing the λ‐calibrated one‐dimensional spectra by the appropriate mean CCD response curve; data were then rebinned to a fixed Δλ pixel−1 to preserve counts/flux linearity. A good wavelength calibration was achieved with a typical rms uncertainty of ±0.02 Å throughout the sampled stellar spectrum.
Correction of stellar data for individual Doppler shift was done by fitting the barycenters of three roughly equispaced strong features, namely, Fe i λ4668.30, Hβ (4861.32 Å), and Mg b (5183.62 Å). After normalization to the rest frame, spectra were rebinned to a fixed 0.830 Å pixel−1 step. The whole tuning procedure led to a final uncertainty in wavelength calibration of σ(λ) = 0.09Å or ±5 km s−1 in radial velocity.
For the subsequent analysis, multiple observations of each star were co‐summed after calibration to obtain one mean spectrum for each object.
Any significant contamination by spectrograph scattered light along the dispersion direction, which would partially fill the spectral lines, was checked and ruled out by comparing our spectra with those from the Library of Medium‐Resolution Fiber Optic Echelle Spectra of F, G, K, and M Field Dwarfs to Giant Stars (Montes, Ramsey, & Welty 1999), kindly provided to us by D. Montes.
3. SYNTHETIC SPECTRA AND FIDUCIAL PARAMETERS FOR THE SAMPLE STARS
Fiducial sets of atmospheric parameters4 for each star in our sample were derived via a direct comparison of the observed spectra with the CMM theoretical database. This database consists of a collection of high‐resolution (R = 250,000) synthetic spectra in the range of temperature between 4000 and 8000 K, surface gravity between 1.0 and 5.0 dex, and metallicity [M/H] between −1.0 and +0.5 dex.
The line list used in the computations was derived from the atomic and molecular line lists compiled by Kurucz and colleagues. From the original lists, containing information on about 58 million lines of atoms up to the tenth stage of ionization and of diatomic molecules, about 45,000 lines falling in the observed wavelength interval were extracted from a synthetic spectrum computed with the solar parameters. A list of additional lines, which do not play any role in the solar spectrum, but are important in the spectra of cool stars, was derived from the line list used by Gulati (1991). In particular, CN, C2, MgH, SiH, and CH account for approximately 85% of the ∼60,000 lines so achieved (see Chavez 1995 for full details).
The synthetic spectra adopt for the Sun the element abundances from Anders & Grevesse (1989) to be consistent with the Kurucz models; in particular, the solar iron abundance is  (Fe) = 7.63 dex.
An approximate quantitative estimate of the relative importance of the absorption due to Fe in the observed wavelength range with respect to the total absorption was obtained by artificially removing the Fe features in the computation of some representative synthetic spectra. It results that the relative importance of Fe blanketing ranges from 15% of the total for the (4500, 4.0, +0.5) model to 50% for the solar model. The reduced relative importance of atomic Fe in the spectrum of the cooler model reflects the increasing importance of molecular absorption at low Teff. The above‐quoted figures are only a convenient approximation, since the same model atmospheres were used in computing synthetic spectra with and without Fe lines, thus introducing a certain level of internal inconsistency in the latter case. As far as the other main absorbers are concerned, we notice that most of the C atomic and molecular features fall in the blue part (λ<5165.5 Å) of the spectral region under analysis.
To match the observations, the original grid of synthetic spectra was modified accordingly by degrading the original resolution to FWHM = 2.5Å via Gaussian filtering, and by rebinning each spectrum at the 663 wavelength points between 4850.89 and 5400.35 Å of the observational data set. The convolution kernel used to degrade the synthetic spectra was derived by fitting several unblended lines in the He‐Ar lamp reference spectra. No correction was required to account for rotational line broadening, since late‐type stars are known to be slow rotators, and no peculiar cases resulted from direct inspection of the observed data. For each star as many synthetic spectra as the number of parameter sets reported in Table 1 were derived from the CMM grid by interpolating linearly in the three‐dimensional space (Teff,log g, [M/H]). It is worth noting that we used the overall metallicity parameter [M/H] as representative of the observed [Fe/H], thus assuming a solar chemical partition for the heavy elements.
Although the comparison could in principle take advantage of the whole spectral window of observations, the adequacy of CMM synthetic spectra may sensibly vary along the wavelength range (Chavez 1995). A preliminary test in this sense was performed by using as a benchmark the high‐resolution spectrum of the Sun by Kurucz et al. (1984) degraded and rebinned to match our observations. Figure 1 shows the residuals ΔFlux of the benchmark spectrum with respect to the synthetic one computed with the solar parameters (Teff,log g, [M/H]) = (5777, 4.4377, 0.0). Shortward of 5034 Å, a systematic drift is evident from the figure, very likely due to a poor modeling of Hβ (Gulati 1989; Castelli, Gratton, & Kurucz 1997) and to discrepancies in the Lick Fe5015 bandpass (see discussion in Chavez 1995, § 3.2). The analysis of the residuals shows that no systematic trends are present in the 5034–5398Å range. On the basis of this analysis, to be conservative, we decided to restrain our comparison for the whole sample of spectra to the above‐mentioned range.
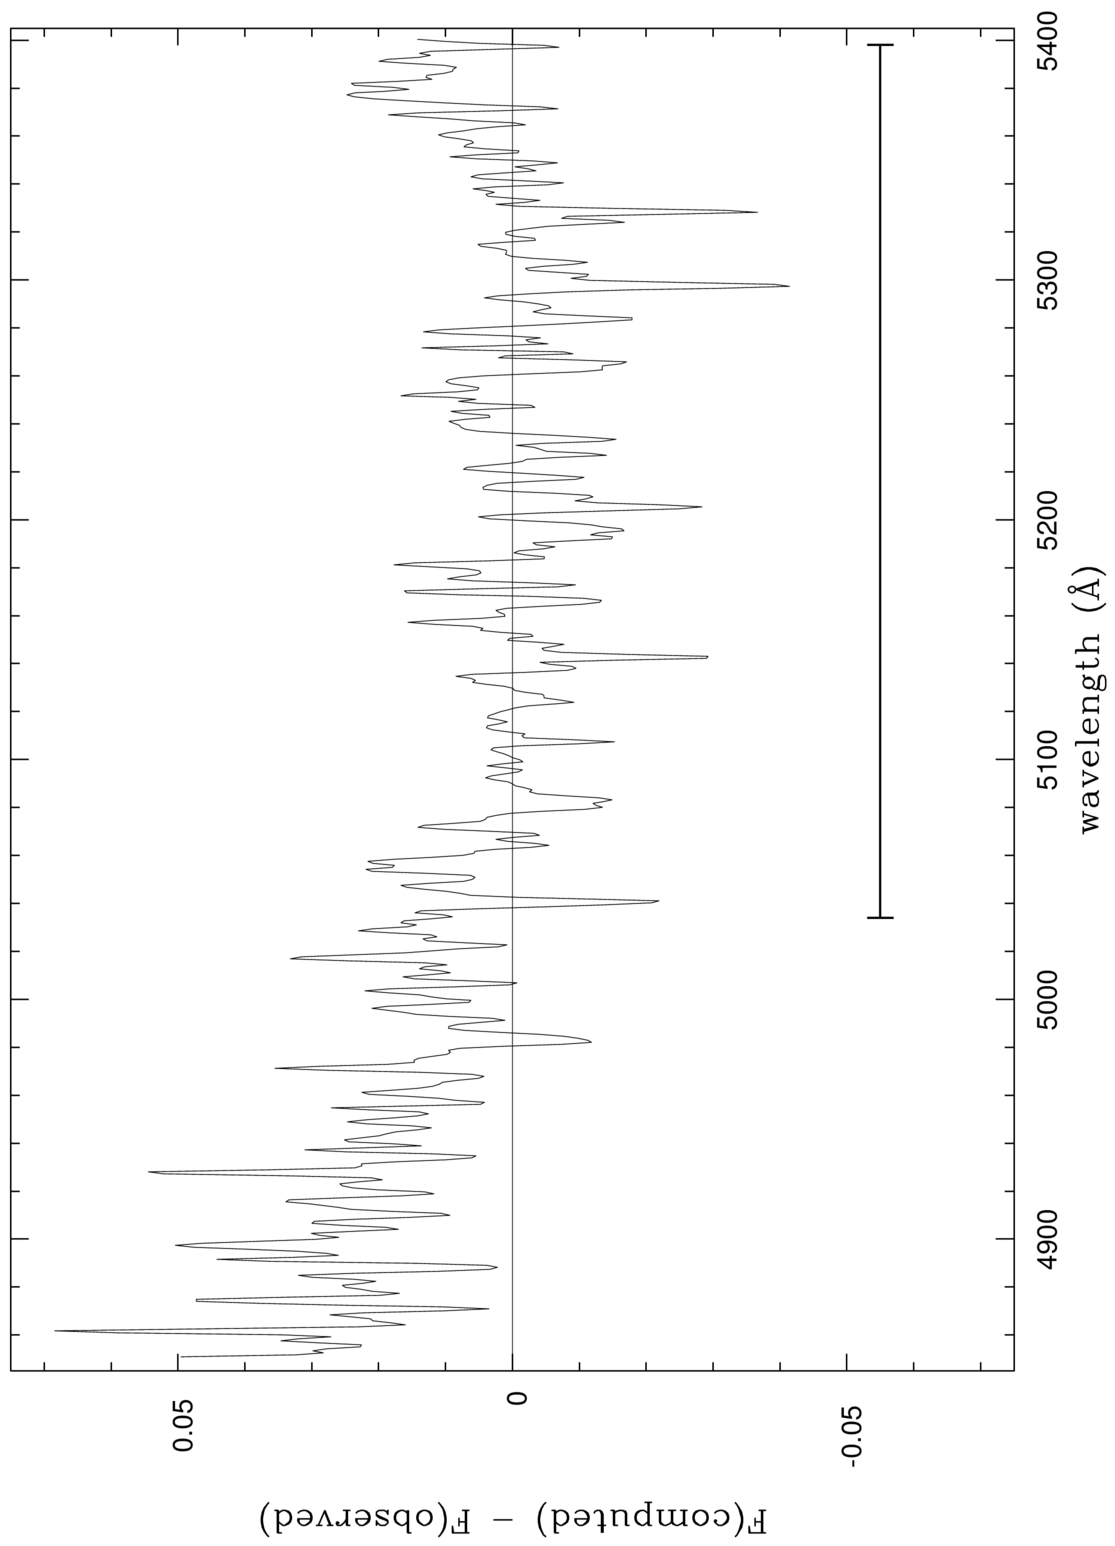
Fig. 1.— Difference between computed and observed absolute flux for the solar spectrum, degraded and rebinned according to the characteristics of the program stars spectra. The 5034–5398 Å interval is indicated.
In order to obtain for each star the fiducialTeff,log g, and [M/H], we computed the rms error (rmse; col. [11] in Table 1) between the observed and each synthetic spectrum after a normalization to their mean values to get rid of scaling problems. The fiducial parameters are identified on the basis of the minimum rms error value, rmse min(although for stars with only one CAY97 determination there is actually no real choice).
3.1. Accuracy of the (Teff,log g, [M/H]) Solution
A plot of the rmse min values versus fiducial Teff and log g is illustrated in Figure 2. The value of rmse min increases with decreasing temperature (panel a), and the trend becomes more evident below 4500 K with higher rmse min for both high‐ and low‐gravity stars. This is likely due to intrinsic physical limits in the CMM database at lower temperatures. We recall also that fiducialTeff below 4000 K and/or fiducial log g below 1.0 dex compelled us to derive synthetic spectra by extrapolating off rather than interpolating in the CMM grid.
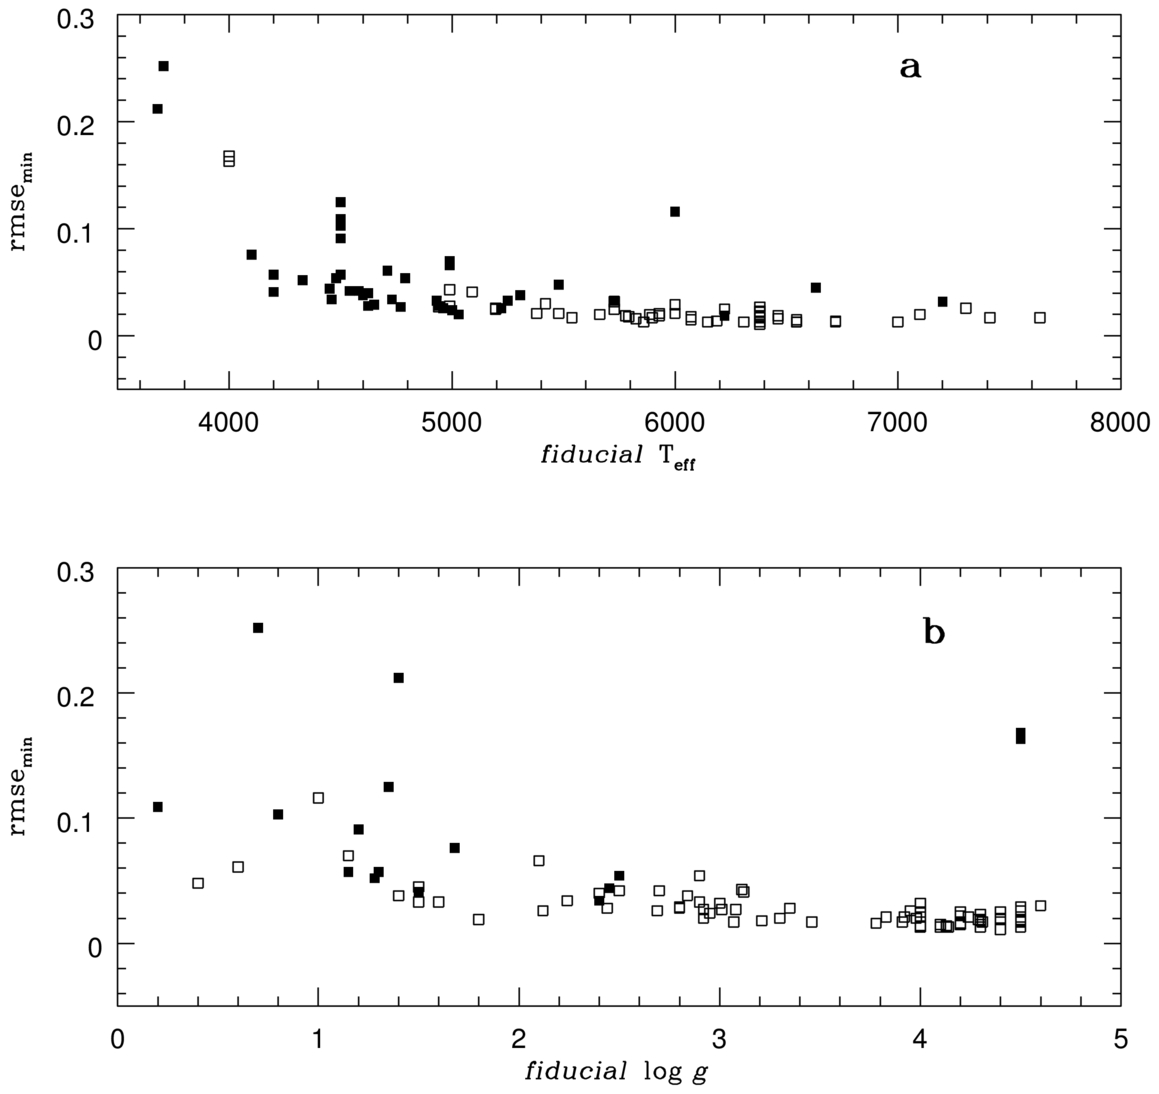
Fig. 2.— Values of rmse min vs. fiducial effective temperature (a) and fiducial surface gravity (b). Filled symbols correspond to stars with log g≤3 dex in panel a, and to stars with Teff≤4500 K in panel b, respectively.
Even if there are strong indications of nonnormality of the residuals used to compute rmse min, we decided to use the normalized χ2 quantity in order to give a relative estimate of the goodness of the fiducial sets. Therefore, only for the fiducial sets identified by rmse min, we computed and listed in Table 1 (col. [12]) the quantity C2. We used the following definition:
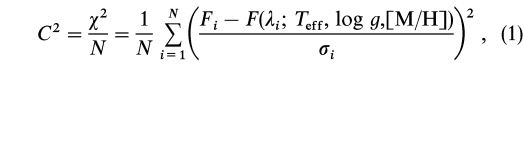
where N = 439 is the number of wavelength points, and Fi and F(λi;Teff,log g,[M/H]) are the observed and synthetic fluxes, respectively. We assumed σi = σobs from Table 1.5
The distribution of the computed C2 values is shown in Figure 3. The generally high C2 values are probably due to both an underestimate of σi and to the nonnormality of the residuals. On the other hand, very high C2 cast doubt on the fiducial parameters themselves. In the following, we will limit our discussion to the 73 stars falling in the dashed area of Figure 3, which comprises 80% of the data (C2<10). We point out that the value of 80% for fixing the C2 threshold is somewhat subjective.
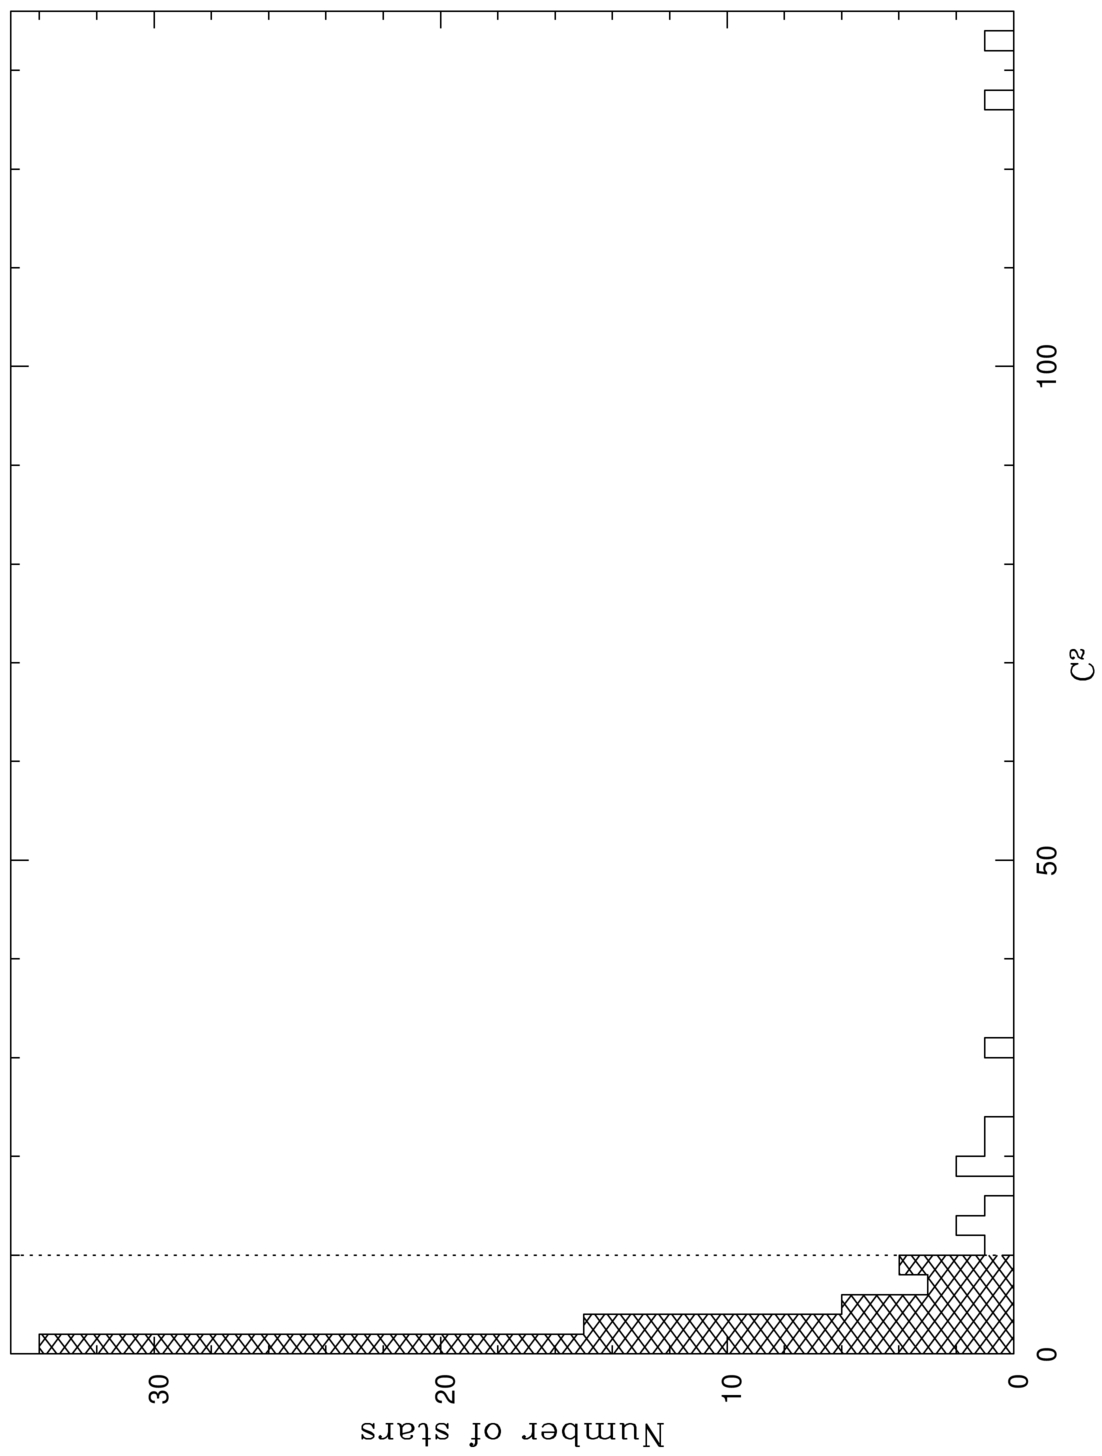
Fig. 3.— Histogram of C2 values from Table 1; the shaded area corresponds to stars with C2≤10.
4. THE METALLICITY SCALE
The [Fe/H] distribution for the 73 selected stars is shown in Figure 4. The mean metallicity and standard deviation of the sample are
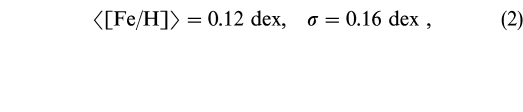
with 49 stars (67%) with [Fe/H]≥ + 0.1. The presence of a significant fraction of nonsupermetallicity stars is not completely unexpected, although our sample was selected on the basis of hints of supermetallicity in the literature. Actually, there is a wide spread in the literature parameters, and 39% of the 175 individual [Fe/H] estimates for the 45 stars with more than one CAY97 data set were less than 0.1 dex. This result means that several SMR candidates are actually solar metallicity stars or even metal‐poor ones. On the other hand, the presence of stars fulfilling the Taylor (1996) SMR criterion (i.e.,[Fe/H]≥0.2) is confirmed. Our sample, in fact, comprises 19 SMR stars with [Fe/H] ranging from 0.20 to 0.49 dex. For these stars, even though the spectral resolution of the observations is not the best suited for detailed analyses, we looked for possible systematic differences between observed and model spectra. The comparison was done in the following wavelength intervals: (1) 5154.125–5196.625 Å, (2) 5245.65–5282.65 Å, (3) 5312.125–5352.125 Å, and (4) 5285.65–5318.15 Å, which correspond to the central bandpasses of Lick narrowband spectrophotometric indices Mg 2, Fe5270, Fe5335, and a quasi‐continuum bandpass, respectively. In general, the residuals do not show any significant systematic trend, thus confirming the model predictions of scaled solar abundance.
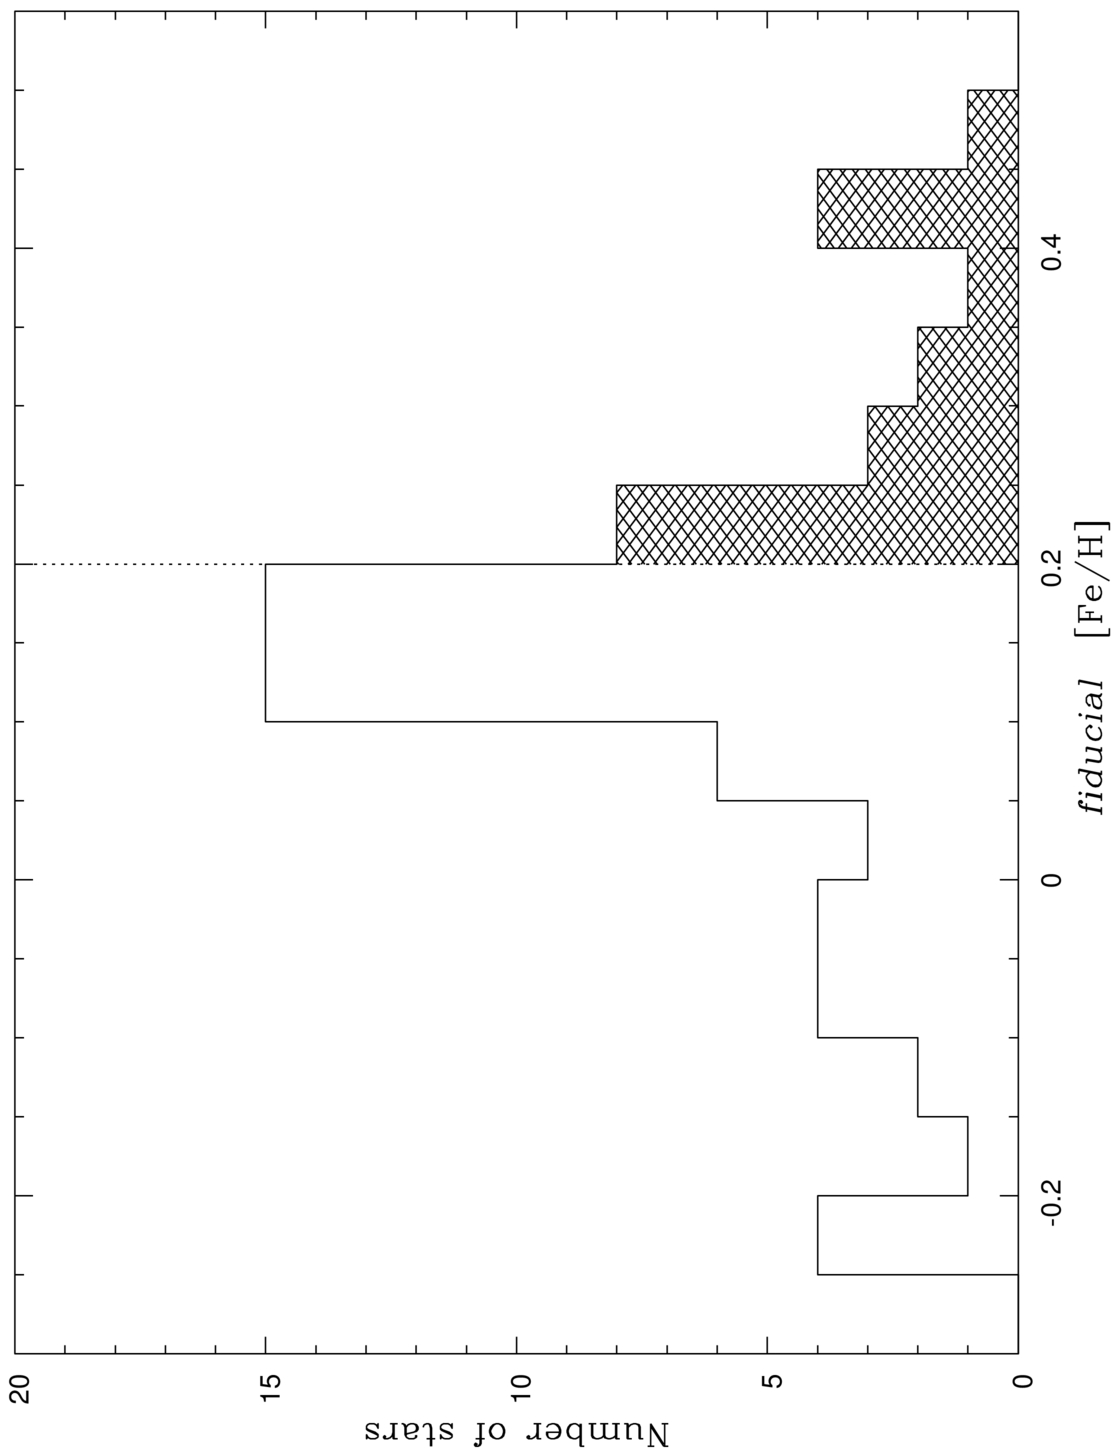
Fig. 4.— Histogram of fiducial [Fe/H] values of the 73 stars with C2≤10; the shaded area corresponds to stars with [Fe/H]≥ + 0.2 dex.
4.1. μ Leonis
As is well known, the star μ Leo (HD 85503) has received special attention as a reference template of super–metal‐rich stars (see, for instance, McWilliam 1997 and Taylor 1999c, and references therein). Figure 5 shows the comparison of our fiducial parameters with the other nine (Teff,log g, [Fe/H]) determinations reported in Table 1. The spread in the determinations is illustrated by the projections of the parameter sets on the walls of the three‐dimensional plot. They span the following ranges:4308≤Teff≤4710;1.95≤log g≤2.82;-0.11≤[Fe/H]≤ + 0.48. Our fiducial set (4460, 2.4, −0.01) falls within the above‐mentioned boundaries. Both Teff and log g are very close to their mean values computed using the other nine sets, while the [Fe/H] is the second lowest value and is not consistent with the SMR hypothesis. Our results are probably affected by our assumption, in obtaining the fiducial parameters, of solar partition. This may not be the case for μ Leo. In fact, Castro et al. (1996) derived individual elemental abundances and found hints of deviations from scaled solar partitions ([Fe/H] = +0.46 and "roughly solar Ca and Ti abundances"). Unfortunately, deviations from solar partitions cannot be taken into account by using CMM synthetic spectra; thus our results for this star must be taken with caution.
4.2. The Most Extreme SMR Stars
The spectra of the three most metal‐rich stars in our sample, namely, those with [Fe/H]> + 0.4, are displayed in Figure 6. They are HD 1461 ([Fe/H] = +0.43), HD 52973 ([Fe/H] = +0.49), and HD 61064 ([Fe/H] = +0.44). In the figure, spectra are sorted in the sense of increasing metallicity. These stars are worthy of further discussion, given their relevance to extending the pattern of Galactic metal abundances beyond Z⊙.
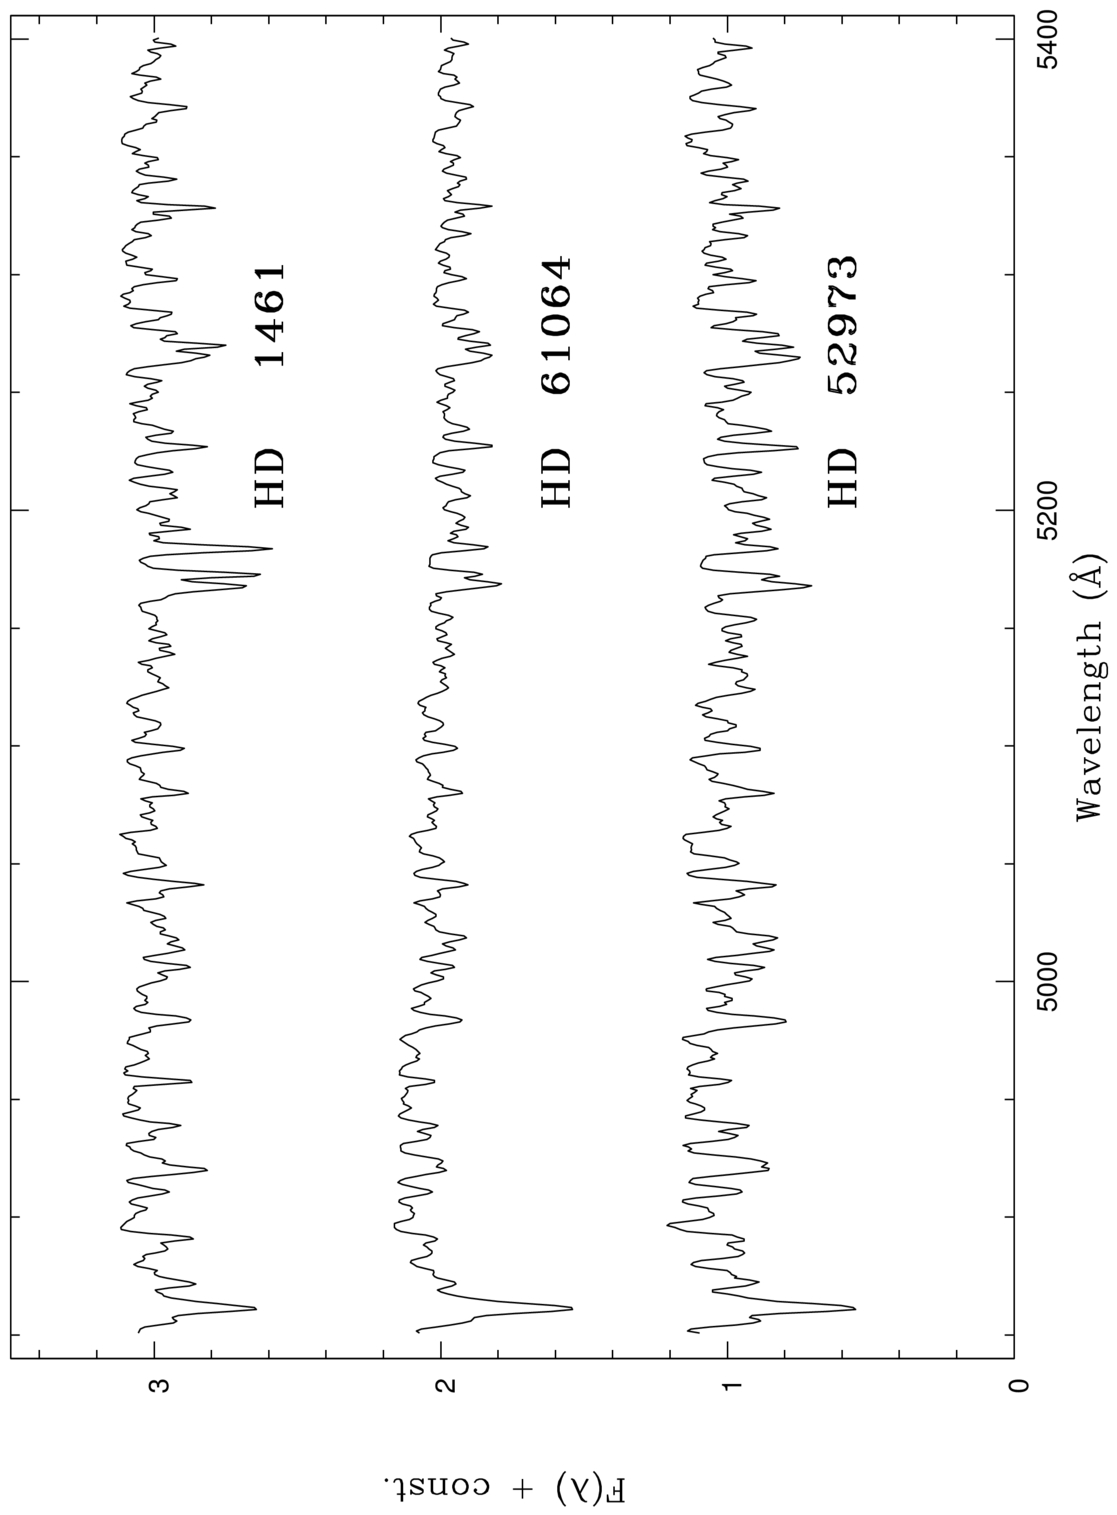
Fig. 6.— Spectra of the three stars in our sample with [Fe/H]> + 0.4. Spectra are sorted in the sense of increasing metallicity (from top to bottom).
HD 1461=HR 72.—No recent detailed spectroscopy can be found in the literature for this V = 6.46 star. The two references in CAY97 (Spinrad & Luebke 1970 and Bell & Branch 1971) are quite old and present metallicity determinations from curve‐of‐growth analyses. A much lower value,[Fe/H] = +0.14, is derived from Strömgren photometry by Eggen (1998).
A comparison of our spectrum with those of HD 114710 and HD 10307, two quasi‐solar chemical composition stars in our database with similar Teff and log g values, can be useful to get a model‐independent clue on the differential metal enhancement in HD 1461.
As displayed in Figure 7, the relative flux (in the sense HD 1461−HD 114710 and HD 1461−HD 10307) clearly indicates strong Mg features and Fe lines, thus confirming [Fe/H]≫0 for HD 1461.
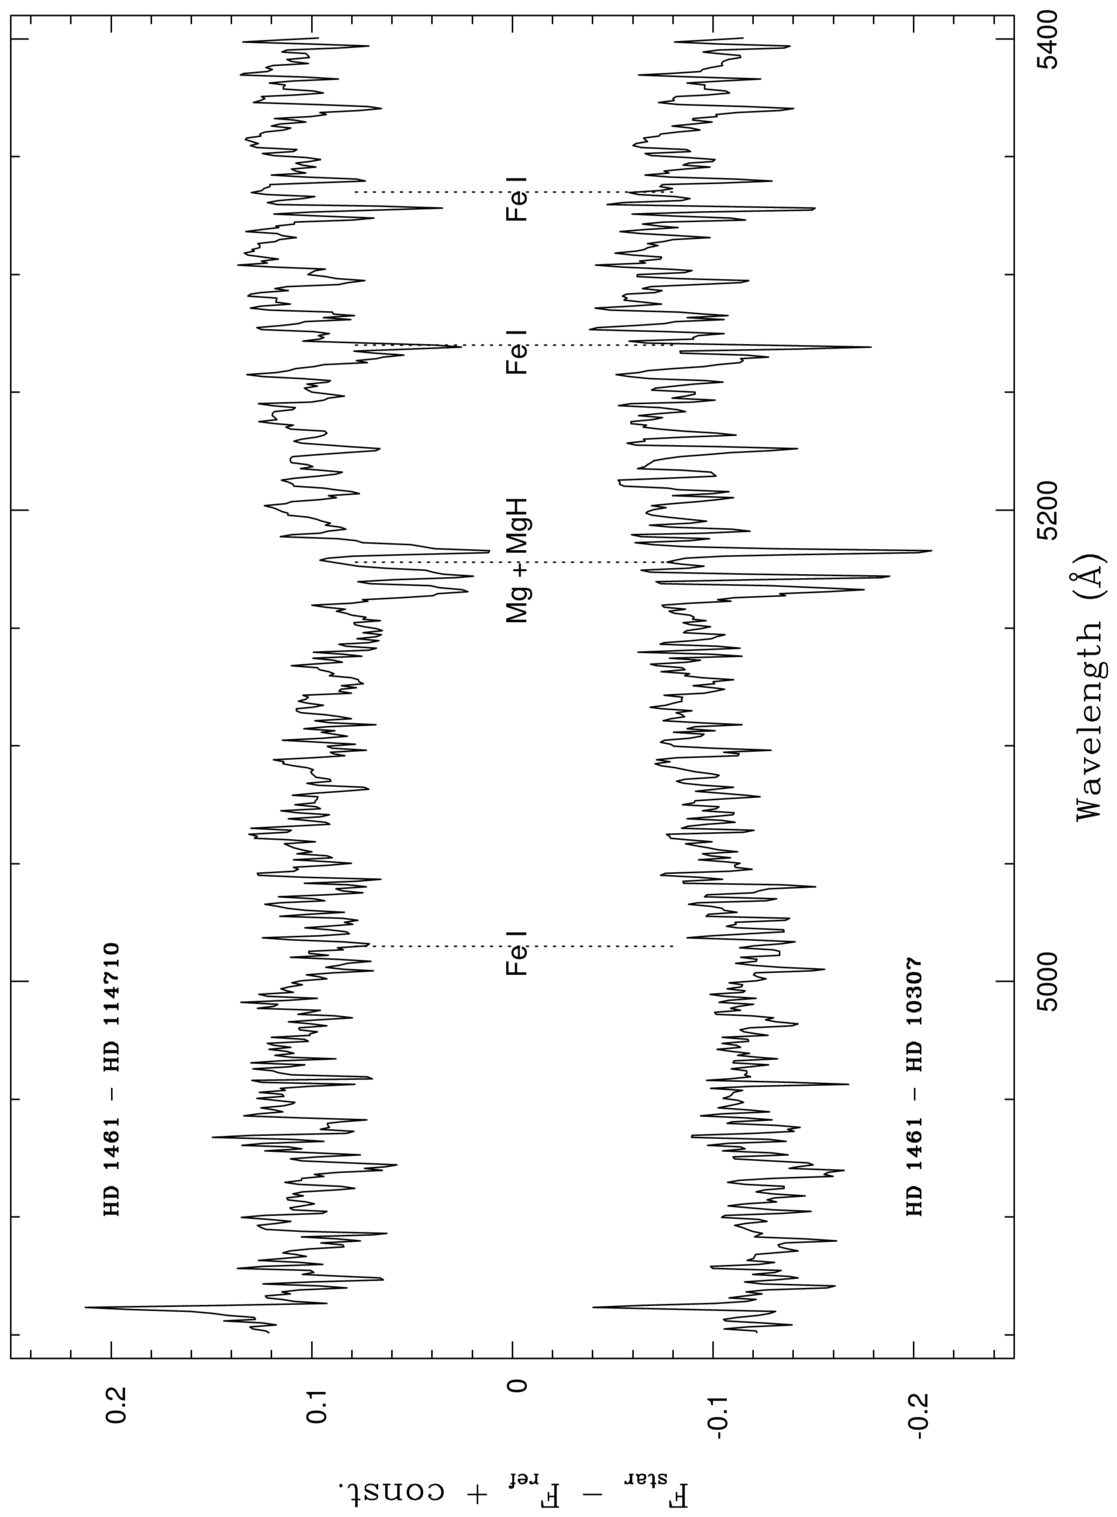
Fig. 7.— Relative spectra of HD 1461 ([Fe/H] = +0.43) with respect to HD 114710 ([Fe/H] = +0.02) and to HD 10307 ([Fe/H] = -0.02), two quasi‐solar chemical composition templates with similar temperature and gravity.
HD 61064=HR 2927=25 Mon.—This evolved star has been studied by Berthet (1990). Original echelle spectroscopy covered the blue region (4420–5040 Å) comprising lines for 12 atomic species. The Kurucz (1979) model atmospheres provided the theoretical reference framework for the analysis. Indications of deviations from solar partition are present in particular for Y, Zr, Ba, and, possibly, C.
We stress again that CMM spectra are computed by assuming a rigid scaling of element abundances in a solar ratio; therefore, as in the case of μ Leo, our results may be affected by anomalies in individual element abundances.
Venture, Zucker, & Wallerstein (1999) derived a completely different iron abundance,[Fe/H] = -0.3, assuming Teff = 6500 and log g = 3.5. The corresponding computed CMM synthetic spectrum, compared with our observations, gave an rms error about twice as large as the rmse min value reported in Table 1, thus suggesting a better agreement of the observations with the SMR hypothesis.
HD 52973=HR 2650=ζ Gem.—The case of HD 52973 is less confident and should be taken with great caution. In fact, because of the low gravity of the star, the assumption of LTE and plane‐parallel layers used in computing CMM spectra may not be valid. Moreover, the star is a Cepheid variable, and Fry & Carney (1997) showed that the spectrum at different phases can be reproduced with different values of Teff,log g, and [M/H]. While variations in Teff and log g versus phases are expected, the nonuniqueness of the [M/H] determination clearly indicates problems in modeling the atmosphere of this star.
5. CONCLUSIONS
In this paper we analyzed a sample of 91 Population I bright stars in the solar neighborhood with at least one reported determination of [Fe/H]≥ + 0.1 from high‐resolution spectroscopy in order to study the metallicity scale at supersolar regimes. We identified the photospheric fiducial parameters (Teff,log g, [M/H]) from among published parameter sets via a comparison of new observations in the wavelength range 5034–5398Å with synthetic spectra based on K93 model atmospheres. In particular, we adopted a statistical test in order to provide a measure of the soundness of fiducial estimates of the metallicity [Fe/H], and found acceptable results for 73 stars of our sample. As a main result of our analysis, we found that the existence of a "genuine" SMR stellar component in the Galactic disk is confirmed, with 19 stars in our sample fulfilling Taylor's (1996) criterion ([Fe/H]≥0.2 dex) and three stars as metal‐rich as [Fe/H]> + 0.4 dex.
This work was partially supported by the Italian MURST (60% and 40% grants, Università degli Studi di Trieste, Osservatorio Astronomico di Trieste and Osservatorio Astronomico di Brera‐Milano), and by the Consiglio Nazionale delle Ricerche (CNR‐GNA). Partial support from Mexican CONACyT is also acknowledged via grant E9506‐0099P‐E.
Footnotes
- 1
Based on observations collected at the INAOE "G. Haro" Observatory, Cananea (Mexico).
- 2
Only determinations derived by using the Sun as a standard star are considered.
- 3
Out of the 92 stars, one (HD 197963) was discarded because of contamination of its observed spectrum by a close companion.
- 4
In the following the term fiducial is used to identify the parameter sets which are from literature high‐resolution studies and are consistent with our observations.
- 5
In the case of only one observed spectrum per star,σobs = 0.03 was assumed.