
Abstract
Although previous studies have quantified carbon dioxide emissions embodied in products traded internationally, there has been limited attention to other greenhouse gases such as methane (CH4) and nitrous oxide (N2O). Following IPCC guidelines, we estimate non-CO2 emissions from beef, pork and chicken produced in 237 countries over the period 1990–2010, and assign these emissions to the country where the meat is ultimately consumed. We find that, between 1990 and 2010, an average of 32.8 Mt CO2-eq emissions (using 100 year global warming potentials) are embodied in beef, pork and chicken traded internationally. Further, over the 20 year period, the quantity of CO2-eq emissions embodied in traded meat increased by 19%. The largest trade flows of emissions embodied in meat were from Brazil and Argentina to Russia (2.8 and 1.4 Mt of CO2-eq, respectively). Trade flows within the European region are also substantial: beef and pork exported from France embodied 3.3 Mt and 0.4 Mt of CO2-eq, respectively. Emissions factor of meat production (i.e. CO2-eq emissions per kg of meat) produced depend on ambient temperature, development level, livestock category (e.g. cattle, pork, and chicken) and livestock management practices. Thus, trade may result in an overall increase of GHG emissions when meat-consuming countries import meat from countries with a greater emissions intensity of meat production rather than producing the meat domestically. Comparing the emissions intensity of meat production of trading partners, we assess trade flows according to whether they tend to reduce or increase global emissions from meat production.
Export citation and abstract BibTeX RIS

Content from this work may be used under the terms of the Creative Commons Attribution 3.0 licence. Any further distribution of this work must maintain attribution to the author(s) and the title of the work, journal citation and DOI.
1. Introduction
Anthropogenic greenhouse gas (GHG) emissions are a primary cause of global warming (IPCC 2014). While carbon dioxide (CO2) emissions from the burning of fossil fuels and changes in land use make up the largest share of these emissions, non-CO2 greenhouse gases such as methane (CH4) and nitrous oxide (N2O) contribute substantially to overall warming. Global emissions of CH4 and N2O account for approximately 27.7% of total radiative forcing since the pre-industrial era (EPA 2011), and of these emissions from the livestock sector made up roughly 25% in 2001 (FAO 2014). Thus, direct emissions of CH4 and N2O from livestock worldwide represent approximately 9% of total anthropogenic GHG emissions (IPCC 2007). Including emissions occurring elsewhere in the supply chain of livestock products, such as transport and feed production (Fiala 2008, Gill et al 2010, O'Mara 2011, Stenfield et al 2006, Weiss and Leip 2012, Lesschen et al 2011, Basset-Mens and Van Der Werf 2005), livestock accounts for about 18% of total anthropogenic GHG emissions. Direct CH4 emissions from livestock result primarily from the digestive processes of animals (enteric fermentation, that only occurs in ruminants) and the anaerobic decomposition of manure (manure management); N2O emissions are produced by the nitrification and denitrification of the organic nitrogen in livestock manure and urine (also part of manure management) (FAO 2009).
A number of recent studies have analyzed the implications of increasing demand for livestock products (e.g, Naylor et al 2005, Reay et al 2012, Bustamante et al 2012), anticipating that CH4 emissions from enteric fermentation could increase by 31% between 1990 and 2030 and that N2O emissions from manure management could increase by 20% (EPA 2011, Valin et al 2013). Meat is the most abundant product of the livestock sector (FAO 2005, Steinfield et al 2006). In 2012, about 310 Mt of meat was produced in the world and meat production has increased more than 300% relative to 1961 levels (FAO 2014). Meat consumption varies drastically by region (UNEP 2012); per capita consumption in the US, New Zealand and Australia is about 120 kg per year while in European countries, Argentina, Brazil and Venezuela average consumption is about 76 kg per person per year.
The Intergovernmental Panel on Climate Change (IPCC) provides guidelines to estimate livestock emissions on a regional level, prescribing three levels of detail (tiers) that may be used depending on the available data (IPCC 2006). Emissions factors are defined as the average emission rate of a given GHG for a given source, relative to units of activity (UNFCCC 2014). They vary significantly among different types of livestock, and also depend on characteristics such as mean annual temperature, geographic location, and level of economic development. That is, the same livestock raised in different countries produce different quantities of GHG emissions (see, e.g. Garnett 2009).
IPCC guidelines offer a relatively simple and robust accounting for estimating GHG emissions produced in each country. Two recent studies use theses IPCC guidelines to estimate the non-CO2 emissions released from livestock allocating emissions on the basis of producer demand (Tubiello et al 2013, Caro et al 2014a). However, producing countries are not the only beneficiary of emissions when the goods and services being produced are exported for consumption in other countries (Bastianoni et al 2004, Munksgaard and Pedersen 2001, Peters et al 2012). Researchers have thus developed alternative accounting systems that re-allocate GHG emissions from producers to consumers (Peters 2008, Davis and Caldeira 2010). Here, we present a comprehensive study of non-CO2 GHG emissions (including CH4 and N2O) embodied in meat traded internationally.
Here we estimate the total non-CO2 emissions due to beef, pork and chicken consumption in 237 countries during the period 1990 to 2010, allocating emission embodied in trade to countries on the basis of consumer demand for meat. We attribute the non-CO2 emissions associated with beef, pork and chicken to consumer countries after estimating livestock emissions produced by enteric fermentation, manure management and manure left on pasture in the origin country. The temperatures during this time period as well as the level of economic development and geographic location of each country are taken into account in the calculation. Land use change emissions caused by land cleared for pasture and the remaining sources of CO2 emissions associated with the life cycle of the meat are not considered in this letter. We highlight the countries with the largest difference between production and consumption emissions, and reveal where fluxes of non-CO2 emissions are greatest.
2. Methods
Determining the emissions embodied in traded meat requires first estimating emissions due to meat production in each country (Caro et al 2014a). We use the IPCC's Tier 1 methodology (IPCC 2006) and activity data from the United Nations Food and Agriculture Organization (FAO 2014) to determine emissions from production of beef, pork and chicken in each country. For non-dairy cattle, pigs and chicken we compute:

where: emissions are GHG emissions, EF is emissions per unit of livestock type produced, and A is activity data. See table S1 for ranges of process and region-specific emissions factors.
In estimating livestock non-CO2 GHG emissions, we consider three processes: enteric fermentation, manure management and manure left on pasture. Each process and trade analysis is described below. A further more detailed description of each process as well as a summarizing table of livestock emission categories, activity data, equations and source of emission factors used in this letter (table S1) can be found in the supplementary data (S1.1–S1.5), available at stacks.iop.org/ERL/9/114005/mmedia.
2.1. Enteric fermentation
Methane, CH4, is emitted as a by-product of the normal digestive process of ruminant livestock, in which digestive microbes ferment the feed consumed by the animal (Kebreab et al 2008). The CH4 is then expelled by the animal to the atmosphere (JRC 2010). The emissions intensity of enteric fermentation (see S1.2 for further details) applied in this study are specific to the type of livestock, region and level of economic development (table S1, IPCC 2006).
2.2. Manure management
Livestock manure (including dung and urine) is composed of mostly organic material and water. Anaerobic and facultative bacteria decompose the organic material under anaerobic conditions (Bouwman 1996) and produce CH4. The potential for CH4 production of decomposing manure depends on the specific composition of the manure, the ambient temperature, and the manner in which the manure is managed (EPA 2006). Following the IPCC guidelines for Tier 1, we use livestock population data (FAO 2014), mean annual temperature (NOAA 2014), and default emission factors (see S1.3 for further details).
N2O emissions occur via both nitrification and denitrification of nitrogen contained in animal waste (Barton and Atwater 2002). Nitrification is the aerobic microbial oxidation of ammonium to nitrate, and denitrification is the anaerobic microbial reduction of nitrate to nitrogen gas (Miller et al 2009). Therefore, the production of direct N2O emissions from managed manure required the presence of other nitrites or nitrates in anaerobic environment preceded by aerobic conditions. Direct N2O emissions depend on total amount of nitrogen excreted from each type of livestock and each type of manure management system (IPCC 2006, table S1). The total nitrogen is then converted to N2O using the IPCC's default emission factor (see S1.3 for further details).
Indirect N2O emissions result from volatile nitrogen losses that occur primarily in the forms of ammonia (NH3) and NOx. Nitrogen losses begin at the point of excretion in animal production areas and continue through on-site management in storage and treatment systems, as well as through leaching/runoff into soils (Oenema and Tamminga 2005, Meyer et al 2002). Like the direct emissions, nitrogen volatilized as NH3 and NOx is estimated from total nitrogen excreted by each type of livestock in each type of manure management system using a default emissions factor (see S1.3).
2.3. Manure left on pasture
N2O is also produced naturally in soils through the processes of nitrification and denitrification (Bateman and Baggs 2005). Our estimates of direct and indirect N2O include manure deposited by grazing animals on pasture, range and paddock (see S1.4). We neglect emissions from manure applied to soils, which has been shown to be a relatively small component of global emissions—on the order of 3% (Tubiello et al 2013).
2.4. International trade
We use a bilateral approach to estimate agricultural emissions of CH4 and N2O embodied in the international trade of beef, pork and chicken, essentially reducing the emissions assigned to each country by its exports and increasing the emissions by its imports (see S1.5). Note that we exclude CO2 emissions from combustion of fossil fuels during transportation or feed production, as well as CO2 emissions from land use change, that may be related to meat production (see Peters et al 2012 for estimates of these neglected CO2 emissions). Quantities of imported and exported meat for each country are from trade data compiled by the FAO (FAO 2014) (see S1.5).
CH4 and N2O emissions are converted to unit of CO2-eq by using global warming potentials (100 years) (IPCC 2007), and allocated to the country where the meat is consumed as follows:

where Pi represents emissions in country i caused by enteric fermentation, manure management and manure left on pasture for each livestock type. Pi results are presented in a recent paper (Caro et al 2014a). Ei represents exports (in tons of meat exported) from country i, and Yk,i represents imports (in tons of meat imported) to country i from country k. Since it is necessary to consider the country of origin of imported/exported meat and the non-CO2 emissions related to their production, we need to give exported and imported meat a specific environmental impact on the basis of specific meat production intensity. This can be done by applying the emission intensity vector (ν) associated to meat production in each country (in tons of CO2eq/tons of meat produced) (see S1.5). These calculations are repeated for each type of meat: beef, pork and chicken.
2.5. Uncertainty
Emission factors for the Tier 1 method are not based on country-specific data, so they may not accurately represent a country's livestock characteristics. Tier 2 (intermediate) and Tier 3 (complex) methods are generally considered to be more accurate (IPCC 2006), however they require detailed information about livestock in each country that are not yet available for a global analysis. We follow the IPCC 2006 guidelines (IPCC 2006) to compute national and global level uncertainty indicating the 95% confidence interval around emission estimates (see Tubiello et al 2013). We use default IPCC uncertainty values for activity data, parameters and emission factors as well as applied default IPCC formulas for estimating uncertainty of emissions within a country and at the global level. Uncertainty estimates can be derived from the Good Practice Guidance and Uncertainty Management (IPCC 2000, see chapter 4): IPCC stated that emission factors estimated using the Tier 1 method are unlikely to be known more accurately than ±30% and may be uncertain to ±50%, whereas the uncertainty associated with activity data obtained from international statistics should be known within ±20% (IPCC 2006). Concerning emission factors uncertainty, we use ±40% (mean value). According to the Good Practice Guidance and Uncertainty Management (IPCC 2000, see chapter 6, table 6.1) we estimate the combined uncertainty for each country as a percentage of total livestock emissions and the percentage uncertainty in global livestock emissions in 2010.
3. Results
In this section we present the results of our analysis. Detailed results as well as uncertainty associated with each of the 237 countries can be found in the supplementary data results.
3.1. Emissions embodied in trade
In 2010, 36.1 Mt of CO2-eq emissions were related to meat produced in one country and consumed in a different country. Of this total, 72% of the CO2-eq emissions were CH4 and 28% were N2O. In particular, 26.7 Mt of CO2-eq (74%), 7.3 Mt of CO2-eq (20%) and 2.1 Mt of CO2-eq (6%) emissions related to beef, pork and chicken respectively produced in one country were consumed in a different country (figure 1). We find that in 2010, 2%, 5% and 4%, of global beef, pork and chicken emissions respectively were traded internationally, primarily as exports from South America to Russia and between European countries. Overall meat-related emissions embodied in trade grew by 19% over the 20 year period 1990–2010, and this growth is apparent for all three meat types beef, pork and chicken (figure 2). Figure 2 shows trends of both non-CO2 emissions due to production and consumption for the largest three importing and exporting countries. When emissions due to production exceed emissions due to consumption the country is a net exporter; when emissions due to consumption exceed emissions due to production the country is a net importer. For emissions embodied in traded beef, we show that Russia (figure 2(a)) was a net exporter during the period 1990–1996 whereas it became the largest net importer for the remaining period (1996–2010). China was the largest exporter of emissions embodied in traded pork (figure 2(d)), and in the period 2008–2010 emissions embodied Chinese pork exports substantially increased. US and Brazil are the greatest exporters of chicken-related emissions (figure 2(f)); in particular US and Brazilian emissions embodied in export of chicken increased starting from 1997–1998.
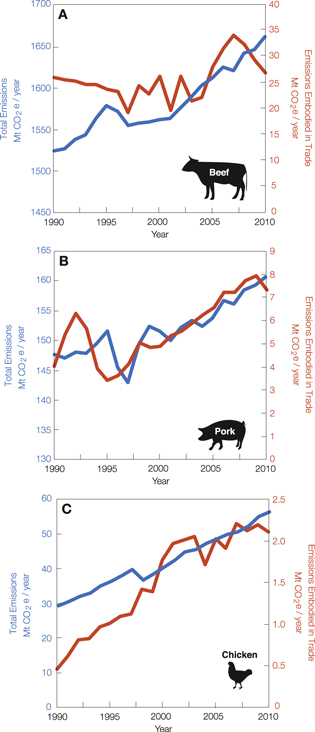
Figure 1. Trends of global non-CO2 emissions (Mtons of CO2-eq) embodied in traded beef (A), pork (B) and chicken (C) (right axis, red) compared with total beef, pork and chicken emissions (left axis, blue) during the period 1990–2010.
Download figure:
Standard image High-resolution image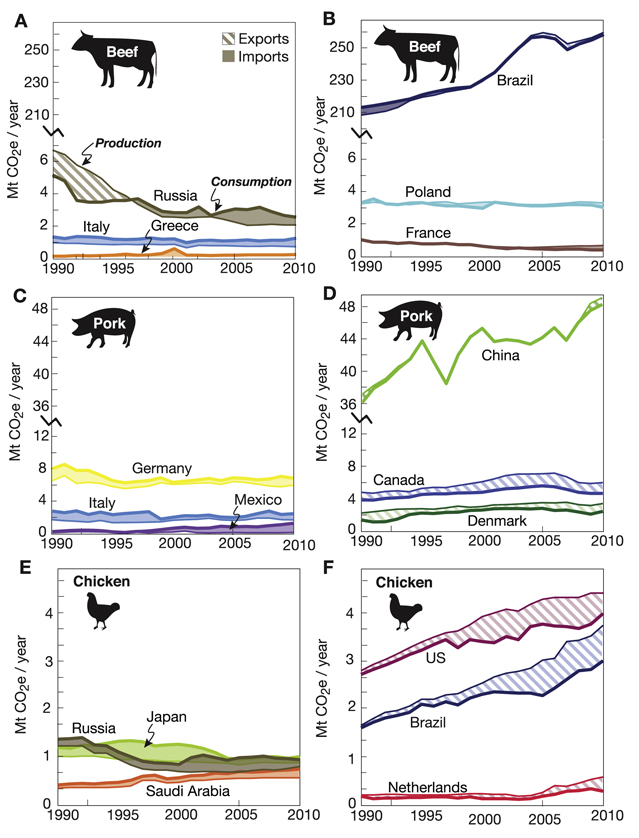
Figure 2. Trends of global non-CO2 emissions (Mtons of CO2-eq) embodied in traded beef, pork and chicken during the period 1990–2010 for the top three importing countries (left column) and exported countries (right column) in 2010.
Download figure:
Standard image High-resolution imageAlthough the emissions embodied in traded beef were greater than those embodied in traded pork or chicken, the emissions embodied in traded beef grew at a slower rate (4%) between 1990–2010 than those emissions related to pork and chicken (81% and 360%, respectively). Meat-related emissions embodied in trade increased between 2000 and 2007, but have declined since 2007, with the greatest decreases in beef-related emissions (21%) and smaller decreases in chicken-related emissions (and 4%). However, pork-related emissions slightly increased (1%) during the period 2007–2010. Aggregating across meat type, emissions embodied in traded meats decreased by 14% between 2007 and 2010.
Figure 3(a) highlights the largest international fluxes of meat-related emissions embodied in trade in 2010. The dominant global fluxes are the export of emissions embodied in meat from Brazil and Argentina to Russia (2.8 and 1.4 Mt of CO2-eq, respectively). Meat exported to Russia embodied 5.2 Mt of CO2-eq emissions: we find that in Russia, 18% of meat-related emissions were traded internationally in 2010. In the same year, emissions embodied in US imports of meat from Canada were equal to emissions embodied in US exports to Mexico: 1.2 Mt of CO2-eq. Australian meat exports to South Korea also embodied substantial emissions: 1.0 Mt of CO2-eq.
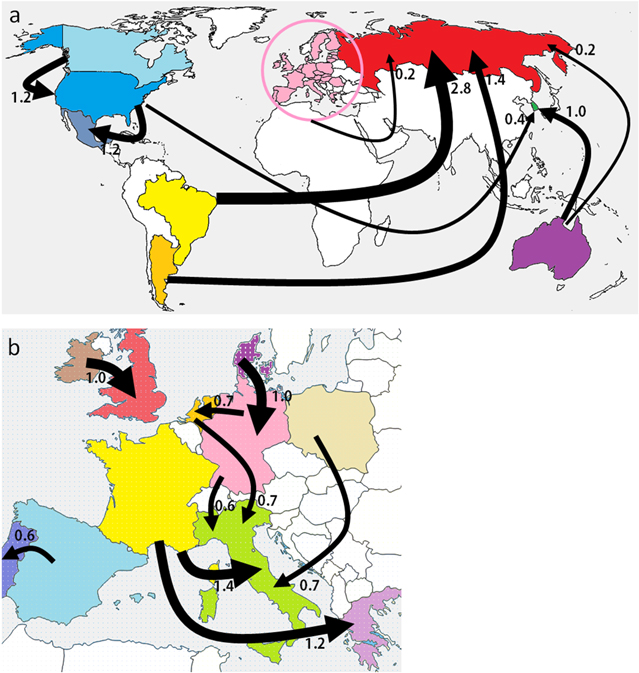
Figure 3. Largest interregional fluxes of emissions (Mtons of CO2-eq) embodied in trade of meat (aggregated to include beef cattle, pig and chicken meat) between largest net exporting-importing countries in the world (a) and Europe (b) in 2010. In the world map fluxes to and from Europe are aggregated to include the EU28. Maps show fluxes of emissions greater than 0.2 Mtons of CO2-eq.
Download figure:
Standard image High-resolution imageFigure 3(a) shows that meat traded to and from the European region did not embody substantial quantities of GHG emissions in 2010. However, figure 3(b) reveals that trade among European countries are in fact quite substantial. In particular, meat exported from France to Italy and Greece embodied 1.4 Mt and 1.2 Mt of CO2-eq emissions, respectively. In addition, Italian imports of meat from Poland, Germany and Netherlands embodied 0.7, 0.6, and 0.7 Mt of CO2-eq emissions, respectively. We find that in Italy, about 30% of meat-related emissions were traded internationally in 2010. Elsewhere in Europe, meat exported from Ireland to the UK embodied 1.0 Mt of CO2-eq emissions.
Figure 4 shows the balance of emissions embodied in traded meat in 2010 for the top 10 net importers/exporters countries. Globally, beef makes up the largest share of meat-related emissions embodied in trade. The large imbalance of emissions embodied in Russian trade is due to large imports of beef (4.7 Mt of CO2-eq) and chicken (0.2 Mt of CO2-eq). Brazil was the largest net exporter of meat-related emissions in 2010, including 2.5 Mt CO2-eq embodied in beef and 0.8 Mt CO2-eq embodied in chicken. In 2010, French beef exports embodied 3.3 Mt of CO2-eq emissions and 0.4 Mt of CO2-eq embodied in pork. Although net exports of emissions embodied in pork from the US are not particularly large in 2010 (0.3 Mt CO2-eq), the gross fluxes were: 1.2 Mt CO2-eq was embodied in pork exports (more than any other country) and 0.9 Mt CO2-eq embodied in imports. Although China is the third largest exporter of emissions embodied in chicken (0.1 Mt CO2-eq), Chinese emissions embodied in beef and pork exports are small in comparison to other countries. This reflects the fact that China consumes most of what it produces; China is the third largest producer of meat-related emissions in the world. In 2010, Italy was the second largest importer of meat-related emissions in the world, with most of the imported emissions embodied in beef and pork (4.1 and 0.4 Mt of CO2-eq, respectively). In 2010, Saudi Arabia was the largest net importer of emissions embodied in chicken (0.2 Mt of CO2-eq).
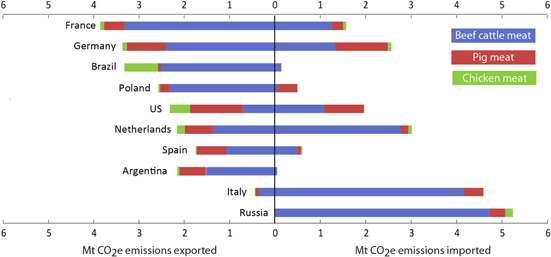
Figure 4. Balance of emissions (Mtons of CO2-eq) embodied in imports and exports of beef cattle, pig and chicken meat relative to the largest net importing/exporting countries in 2010.
Download figure:
Standard image High-resolution imageFigure 5 shows how (percentage) and where emissions due to consumption of meat, are released due to production (i.e. where the cattle, pigs and chickens are raised). It points out that 75% of Greece's imported beef-related emissions are released in France. Further, 89% of pork-related emissions embodied in Mexican import occur in US. Additionally, 92% of chicken-related emissions due to Japanese import are released in Brazil. Figure 5 reveals how and where the largest importers delocalize their meat related emissions.

Figure 5. Geographical sources of CO2-eq (percentage) for largest three net importer of emissions country due to beef, pork and chicken in 2010. The pies show where livestock were bred to produce meat. Each country has the same color all along the figure.
Download figure:
Standard image High-resolution image3.2. Production versus consumption
Figure 6 provides a global map for each type of meat analyzed, presenting country scale emissions due to meat consumption in 2010. North and South America as well as China dominate emissions due to cumulative beef, pork and chicken consumption. Africa is the smallest emitter of emissions due to meat consumption.
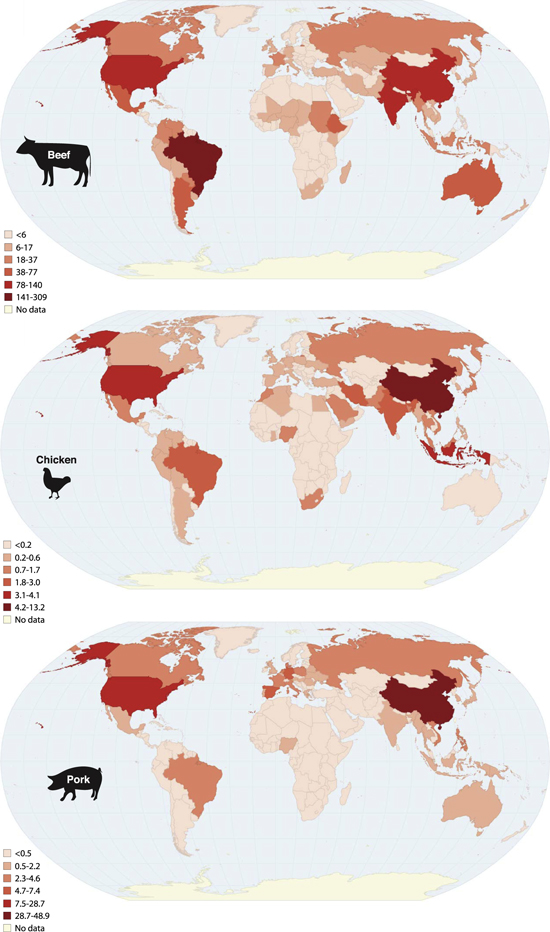
Figure 6. A global map for each type of meat analyzed, presenting country scale emission due to meat consumption in 2010.
Download figure:
Standard image High-resolution imageGlobally, percent changes in traded emissions from 1990 to 2010 vary by region and type of meat. Table 1 shows the emissions from production and consumption of beef, pork and chicken in several countries in 2010, as well as the percent change under consumption-based accounting in the same year (negative percentages indicate net export of embodied emissions and positive percentages indicate net import of embodied emissions). The percent change can be quite large, such as in Greece and Saudi Arabia, where consumption-based emissions from beef are 197% and 430% larger than production-based emissions, respectively. Similarly, consumption-based emissions from beef in Poland and Denmark were 44% and 11% lower than production-based emissions, respectively. Elsewhere, net emissions embodied in trade are near zero, but gross flows are large (e.g., the US).
Table 1. The table shows the non-CO2 emissions due to production and consumption of beef, pork and chicken for the largest net importing/exporting European and extra European countries in 2010. The table also points out the percentage variation between emissions due to consumption and production. Percentage increase and decrease reveal a net importer and exporter respectively.
| Beef cattle meat | Pig meat | Chicken meat | |||||||
|---|---|---|---|---|---|---|---|---|---|
| Country | Production | Consumption | Variation | Production | Consumption | Variation | Production | Consumption | Variation |
| Mt of CO2eq | Mt of CO2eq | Mt of CO2eq | Mt of CO2eq | Mt of CO2eq | Mt of CO2eq | ||||
| Argentina | 86.94 | 84.33 | −3% | 0.22 | 0.22 | 0% | 0.30 | 0.22 | −26% |
| Australia | 50.62 | 48.90 | −3% | 1.35 | 1.46 | 8% | 0.16 | 0.16 | −1% |
| Brazil | 311.03 | 308.66 | −1% | 2.84 | 2.78 | −2% | 3.74 | 3.00 | −20% |
| Canada | 19.87 | 19.43 | −2% | 5.67 | 4.52 | −20% | 0.35 | 0.36 | 3% |
| Mexico | 48.00 | 47.41 | −1% | 1.13 | 2.18 | 94% | 1.53 | 1.67 | 9% |
| Republic of Korea | 5.44 | 7.29 | 34% | 1.03 | 1.03 | 0% | 0.42 | 0.45 | 6% |
| Russia | 19.81 | 24.54 | 24% | 3.03 | 3.37 | 11% | 0.83 | 1.00 | 20% |
| Saudi Arabia | 0.28 | 1.48 | 430% | 0.00 | 0.00 | 0% | 0.55 | 0.77 | 39% |
| South Africa | 8.62 | 8.04 | −7% | 0.16 | 0.21 | 30% | 0.73 | 0.79 | 8% |
| US | 140.28 | 140.65 | 0% | 28.99 | 28.71 | −1% | 4.42 | 3.99 | −10% |
| Denmark | 1.54 | 1.37 | −11% | 3.44 | 2.60 | −24% | 0.03 | 0.02 | −23% |
| France | 26.26 | 24.20 | −8% | 4.00 | 3.78 | −5% | 0.32 | 0.25 | −22% |
| Germany | 14.15 | 13.06 | −8% | 6.60 | 6.90 | 5% | 0.25 | 0.23 | −6% |
| Greece | 0.78 | 2.33 | 197% | 0.37 | 0.68 | 82% | 0.07 | 0.07 | 5% |
| Ireland | 9.04 | 7.82 | −13% | 0.01 | 0.01 | 2% | 0.03 | 0.01 | −53% |
| Italy | 8.30 | 12.10 | 46% | 2.58 | 2.95 | 14% | 0.28 | 0.27 | −4% |
| Netherland | 3.94 | 5.34 | 36% | 3.43 | 2.97 | −13% | 0.83 | 1.00 | 20% |
| Poland | 5.12 | 2.85 | −44% | 2.77 | 3.01 | 9% | 0.25 | 0.21 | −14% |
| Spain | 15.75 | 15.79 | 0% | 7.96 | 7.39 | −7% | 0.30 | 0.32 | 4% |
| UK | 13.54 | 14.15 | 4% | 1.16 | 1.28 | 11% | 0.36 | 0.40 | 13% |
Consumption-based emissions from pork from 1990 to 2010 in Mexico and Greece is 94% and 82% higher than production one. However, Canada and Denmark, in production-based emissions, see pork emissions reduced by 20% and 24%, respectively, over the same time period. The greatest increases in consumption-based emissions from chicken are seen in Russia (20%) and the Netherlands (20%).
Some countries increased in percent variation in one livestock category, while decreasing in percentage variation in another. For example, Australia is a net importer of emissions due to pork (consumption-based emissions is 8% higher than production-based emissions) and a net exporter of emissions due to beef (production-based emissions is 3% higher than consumption-based emissions). Similarly, Germany is a net exporter of beef emissions and a net importer of pork emissions (table 1).
3.3. Emission intensity
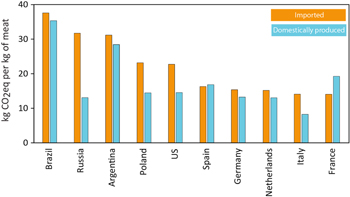
Figure 7 shows the emissions intensity of meat production (kg of CO2-eq emissions per kg of meat) being produced domestically and imported for the top 10 net importers/exporters countries in 2010. In Brazil, Germany, the Netherlands, Argentina, and Spain the emissions intensity of meat produced domestically and imported are similar. In contrast, the emissions intensity of meat imported to Russia, the US, Poland and Italy (11.4, 11.6, 12.7, and 6.4 kg CO2-eq per kg of meat, respectively) is substantially higher than that of exports (29.7, 20.1, 20.7, and 13.2 kg CO2-eq per kg of meat, respectively). In other countries, the opposite is true: in France, the emissions intensity of domestically produced meat in 2010 was 20 kg CO2-eq per kg of meat, but the emissions intensity of imported meat was 14 kg CO2-eq per kg of meat.
Figure 7. CO2-eq per unit of meat domestically produced and imported for the largest net importing/exporting countries in 2010. Meat is aggregated to include beef, pork and chicken. The figure shows that in some countries, eating meat imported is less efficient than eating meat domestically produced in term of non-CO2 emissions.
Download figure:
Standard image High-resolution image
4. Discussion and conclusions
Long-term growth in the international trade of meat since 1990 means that CH4 and N2O emissions from beef, pork and chicken produced in one country are increasingly related to meat consumption in a different country (figures 1 and 2). In particular, we find that large transfers of emissions embodied in meat between North American countries, from South America to Russia, and between European countries (figures 3(a) and (b)). The observed decrease in trade of meat since 2007 is likely a short-term trend related to the global economic recession (Narula 2013).
Livestock emissions represent a large and growing share of anthropogenic GHG emissions (Caro et al 2014a). Tubiello et al (2013) provides a complete and coherent time series of emissions due to agriculture, including emissions released from livestock during the period 1961–2010. The research, however, is limited to emissions due to production, and does not consider the displacement of emissions internationally through trade. Our findings are important because they quantify the superimposed effects of three important global trends: (1) the growth of international trade (Peters et al 2011), (2) the industrialization and intensification of meat production (UNEP 2012), and (3) increasing consumption of meat (Godfray et al 2010, Carlsson-Kanyama 1998).
The overall growth in meat-related emissions embodied in trade indicates that the emissions related to increasing consumption of meat are also increasingly disconnected in space from the point of consumption (Fader et al 2013). This spatial disconnect of production and consumption represents a challenge for regional or national policies that regulate livestock emissions, because all existing policies neglect any emissions embodied in trade. For example, the GHG inventories performed in compliance with the Kyoto protocol do not include emissions embodied in imports (Bastianoni et al 2014, Caro et al 2014b). Therefore, fluxes of embodied emissions from Non-Annex I (developing and emerging) countries to Annex I (developed) countries will not be inventoried even though the demand from meat consumers in the developed countries are contributing to the production of those emissions in another country. However, changing dietary habits favoring increased meat consumption are occurring mainly in developing and emerging countries (Pradhan et al 2013a). Similarly, these displaced livestock emissions will escape regulation in the consuming countries, which may encourage further offshoring of livestock operations (i.e. 'leakage'; see, e.g. Peters and Hertwich 2006, Davis and Caldeira 2010). Moreover, the net trade of meat-related emissions reinforces the already large global disparity in emissions (figure 6).
International food trade is playing a crucial role in enabling local and regional food security. The trade of meat may be environmentally beneficial when it flows from resource abundance countries to resource scarce countries. However, this situation exposes some regions to risks: growing dependence on exporting countries (such as Brazil, France, Argentina see figure 4) may amplify possibilities for future resource disruptions in these regions due to excessive demand. The same situation, however, also offers opportunity. In an era of tightening resource constraints, countries that improve their resource efficiency would benefit from increased meat prices and improve their economic performance and the well-being of their populations. It may also be problematic when trade flows from resource scarce countries to resource abundance countries. Nevertheless, Steinfeld et al (2006) claimed that growth in trade of meat will outpace that of growth in production, facilitated by declining tariff barriers within the context of the General Agreement on Tariffs and Trade (WTO 2014). This indicates a gradual trend towards producing livestock in locations where feed is available, rather than close to consumption centers.
We show that beef makes up the largest share of meat-related emissions embodied in trade (figure 4). This is mainly due to higher emission intensities associated with beef production. Emission intensities are dependent on where and how livestock is raised, produced and finally exported as meat. In some cases, net exporter countries with a negative balance of emissions traded (table 1) may reveal a pollution intensive resource endowment associated with lower emission intensities, while net importer countries with a positive balance of emissions traded (table 1) may reveal a country with limited resource endowments associated with higher emission intensities. From an environmental perspective, it is advantageous to have meat produced where they have the lowest emission intensities, irrespective of whether that country has a positive or negative balance of trade for pollution. However, additional environmental impacts associated with transporting meat are not quantified here, but occur and can be relevant. For example, meat trade flows from France (lower emission intensity) to Greece (higher emission intensity) is of a particularly large volume (figure 3(b)); the energy needed transport meat from France to Greece results in additional GHG emissions, which needs to be considered before determining whether Greece would produce less emissions by domestically producing meat or importing meat from France. The volume of emissions released from transport of meat depends on many factors, and involves carbon dioxide emissions that are not taken in account in our analysis.
Although the Tier 1 approach we use cannot discern management practices related to industrialization, the applied emission intensities do vary according as mean annual temperature, geographic location, and level of economic development. Thus, on the basis of trade volumes and differences in these factors, we can assess whether international trade in meat will tend to decrease or increase global livestock emissions. In effect, when emission intensity of imports in one country is higher than emission intensity of domestic production, domestic production of meat would result in less emission than importing meat (figure 7). For example, in 2010, 2.7 Mt of CO2-eq embodied in Brazilian beef exported to Russia. Yet, Brazilian beef production emitted 34 kg CO2-eq per kg of beef and Russian beef production emitted 11 kg CO2-eq per kg of beef. Conversely, the emissions intensity of meat imported to France was substantially lower than that of domestically produced meat. It should be noted, however, that this calculation cannot anticipate complex market effects. For example, domestic production of meat might mean importing some other good where the difference in carbon intensities is even larger.
The main drivers of meat-related emissions embodied in international trade are the volume and type of meat traded. The trade of beef represents the largest source of livestock-related emissions. This is due to the large volume of beef traded internationally and the emission intensity of non-dairy cattle, which is substantially higher than pork and chicken mainly due to greater GHG emissions released during enteric fermentation. Consequently, beef releases more emissions than pork and chicken per ton of meat traded. Therefore, dietary preferences are a strong driver of livestock emissions, with beef generally related to substantially more GHG emissions per ton of meat traded than pork and chicken, and much more than vegetables (Engstrom et al 2007). Therefore, substituting pork, chicken or vegetables for beef could reduce livestock emissions.
For this study application of Tier 1 IPCC methodology suggests an uncertainty of about ±44% (see supplementary data results). Meat-related emissions estimated for Brazil have the highest combined uncertainty, representing about ±7.4% of combined uncertainty (as percentage of total) followed by China (±4.5%) and US (±4.1%). IPCC guidelines (IPCC 2006) state that shifting from Tier 1 to higher Tiers may lead to a 10–20% decrease in the uncertainty of national emission factors associated to the physical processes involved. Caro et al (2014a) compared a Tier 1 with a Tier 2 method calculation of livestock emissions in a few countries and they conclude that Tier 2, but not Tier 1, method can reflect that farmed livestock became more efficient over the time. However, the increased demand for livestock sector (and associated GHG emissions) is captured by a Tier 1. Moreover, Tubiello et al (2013) highlight that FAOSTAT database is an improvement over existing databases, as it provides a coherent framework for activity data across time and space, at country level, within a unified data platform.
Our analysis of livestock emissions embodied in the international trade of meat highlights the regional variation in emissions intensities and quantifies a significant barrier to effective regional and national policies regulating livestock emissions. It is conceivable that consumption-based accounting of this sort could eventually be used to impose GHG-based border taxes (Atkinson et al 2011). In the meantime, trade liberalization may lead to higher livestock production in countries with lower input costs and more permissive environmental regulations, thus decreasing global food costs and incentivizing both global demand (Naylor 2005) and international trade (Peters et al 2012).
Moreover this letter highlights how and where is important consider both gross and net emissions among different countries: for example we find that in 2010 emissions embodied in US imports of meat from Canada were about equal to emissions embodied in US exports to Mexico (figure 3(a)). Thus, the US has a negligible net balance of emissions traded. However, its gross balance is one of the largest worldwide. Analyses like the one we present here will be critical in monitoring these trends and their drivers, and in evaluating how globalization and the socio-economic dynamics of each country have influenced (and will influence) livestock emissions.
The letter shows that in several individual countries a substantial percentage of meat-related emissions are traded internationally. While our study exclusively focuses on the direct non-CO2 emissions released from live breeding animals (such as CH4 and N2O released from enteric fermentation, manure management and manure left on pasture), other indirect CO2 emissions embedded in the life cycle of meat products (such as animal transport, farm construction, feed production and desertification) occur and are not included in this letter. Two recent studies have showed that globally, about 40% of crop produced is used as livestock feed (Cassidy et al 2013, Pradhan et al 2013b). Hence, production and trade of meat are also responsible for CO2 emissions associated with crop production indirectly, an exploration of which is beyond the scope of the current study. Future advancements should therefore determine GHG emissions caused my meat consumption taking into account the total production process and transportation, including CO2 emissions as well as land, water and energy use occurring in the supply chain.