
Abstract
Cost-effective protected area networks require that decision makers have sufficient information to allocate investments in ways that generate the greatest positive impacts. With applications in more than 50 countries, the Rapid Assessment and Prioritization of Protected Area Management (RAPPAM) method is arguably the tool used most widely to assist such prioritization. The extent to which its indicators provide useful measures of a protected area's capacity to achieve its conservation objectives, however, has seldom been subject to empirical scrutiny. We use a rich spatial dataset and time series data from 66 forest protected areas in the Brazilian Amazon to examine whether RAPPAM scores are associated with success in avoiding deforestation. We find no statistically significant association between avoided deforestation and indicators that reflect preferential targets of conservation investments, including budget, staff, equipment, management plans and stakeholder collaboration. Instead, we find that the absence of unsettled land tenure conflicts is consistently associated strongly with success in reducing deforestation pressures. Our results underscore the importance of tracking and resolving land tenure in protected area management, and lead us to call for more rigorous assessments of existing strategies for assessing and prioritizing management interventions in protected areas.
Export citation and abstract BibTeX RIS

Content from this work may be used under the terms of the Creative Commons Attribution-NonCommercial-ShareAlike 3.0 licence. Any further distribution of this work must maintain attribution to the author(s) and the title of the work, journal citation and DOI.
1. Introduction
Protected areas are the pride of the global conservation movement, but also remain one of its primary concerns. As diverse as the 177 000 units of the global protected area network are in terms of species, ecosystems, threats and management responses (Bertzky et al 2012), as rich are they in stories of both successes and failures (Bruner et al 2001, Joppa and Pfaff 2011). Especially in the tropics, home to some of the world's greatest ecological diversity, many sites fail to achieve stated conservation objectives fully (Oates 1999, Verissimo et al 2011). Given the pervasive and chronic budget constraints under which most protected areas operate (Bruner et al 2004), supporters and managers of protected area networks are increasingly expected to allocate resources and efforts in ways that yield the most cost-effective outcomes (Ferraro and Pattanayak 2006). With protected areas being put forward as a potentially cost-effective strategy to reduce deforestation and forest degradation (Nauclér and Enkvist 2009, Venter et al 2009, Soares-Filho et al 2010), the effective prioritization of conservation funds has become a key task for donors, park agencies and project managers alike.
Decision makers can use an abundance of methods to assess protected area management and prioritize interventions. In the past decade, more than 70 methods have been developed to provide standards for indicator collection, analysis and interpretation (Leverington et al 2010, Nolte et al 2010). Their value for prioritization hinges on their ability to help decision makers predict and compare the potential outcomes of alternative interventions. This prerequisite translates into two challenges: first, methods need to be able to provide an accurate assessment of the management status quo of a given protected area network (baseline). Second, they need to provide insights into how alternative interventions in different sites will affect management and, ultimately, the likelihood of achieving desired future outcomes (prediction). Selection and interpretation of method indicators thus presuppose a thorough understanding of the causal pathways through which interventions affect management and outcomes. Defining metrics and data collection procedures also involves a trade-off between cost and precision. While ecological monitoring systems and independent experts can provide more reliable metrics than subjective self-assessments of staff, their additional effort is not necessarily commensurate with the potential value of improved accuracy (Hockings et al 2009).
Recent reviews suggest that popular methods to assess protected area management have important similarities (Cook and Hockings 2011). Most methods collect data on a wide range of management aspects, often selected with reference to an assessment framework developed by the World Commission of Protected Areas (WCPA) (Hockings et al 2006). Covering a large diversity of management indicators reduces the risk of omission errors and can enhance flexibility in the application of methods in different management contexts. When it comes to metrics and data collection, many methods rely on qualitative indicators elicited directly from protected area managers, suggesting that this approach is generally perceived as striking a satisfactory balance between cost and precision.
One of the most widespread prioritization methods for protected area management is the Rapid Assessment and Prioritization of Protected Area Management (RAPPAM) method (Ervin 2003a, 2003b). Developed by the World Wide Fund for Nature (WWF) for assessments of protected area networks, RAPPAM aims, among other things, to 'help develop and prioritize appropriate policy interventions and follow-up steps to improve protected area management effectiveness' (Ervin 2003a, p 3). RAPPAM questionnaires elicit responses from protected area managers who are asked to rank 90 qualitative statements on a four-point scale based on how well the statement applies to their protected area site ('yes', 'rather yes', 'rather no', 'no'). To ensure 'consistent scoring across different parks'. (Ervin 2003b, p 834), the RAPPAM manual encourages the questionnaire to be filled out in national-level workshops, with participants clarifying the meaning of terms such as 'adequate', 'appropriate', and 'sufficient' in the national context (Ervin 2003b). By 2010, RAPPAM had been applied in more than 2000 protected areas in more than 50 countries on five continents (Leverington et al 2010, Kinouchi 2012), making it a de facto standard in present-day assessments of protected area management. However, whether or not RAPPAM provides useful measures of a protected area's capacity to achieve its conservation objectives has seldom been subject to empirical scrutiny.
In this letter, we examine the relationship between RAPPAM scores and the success of protected areas in avoiding deforestation in the Brazilian Amazon. Given that RAPPAM was 'developed specifically for forest protected areas' (Ervin 2003a, p 6), we expected the method to perform particularly well at characterizing success in reducing what constitutes a major threat to forest biodiversity. We chose Brazil because its position as the world's largest deforester has prompted considerable investments into enlarging and consolidating the country's protected area network. Protected areas and indigenous lands now cover 43.9% of the Brazil's Amazon region (Verissimo et al 2011). Brazil is also home to one of the world's largest protected area support programs—the Amazon Region Protected Area (ARPA) program—whose investment strategy provides insights into what indicators reflect preferential targets of conservation interventions (ARPA 2010). Finally, Brazil's government has taken RAPPAM seriously, collaborating with WWF to apply the method to more than 250 federal protected areas in 2005 and 2010 (Kinouchi 2012). We use a rich spatial dataset and statistical matching to discriminate between protected areas that have been more and less successful at countering deforestation pressures between 2006 and 2010. We then examine the extent to which both groups differ in terms of RAPPAM scores, paying particular attention to indicators that reflect preferential targets of interventions, and to those showing the strongest associations with success.
2. Methodology
2.1. Estimating deforestation pressure
We considered all 152 protected areas in the Brazilian Amazon that had been reported to the World Database of Protected Areas (UNEP-WCMC 2011), had been declared in 2006 or earlier, were located in tropical and subtropical moist broadleaved forests (Olson et al 2001) and contained at least 200 km2 of forest cover in 2000 (Hansen et al 2003). In accordance with Brazilian nomenclature, we considered biological stations, biological reserves, and national and state parks to be 'strictly protected areas', and classified national forests, extractive reserves and sustainable development reserves as 'sustainable use areas'. We excluded Environmental Protection Areas as they consist primarily of private lands without significant additional restrictions (Verissimo et al 2011). We did not include indigenous lands as they had not been included in RAPPAM analyses in Brazil.
We defined deforestation pressure as the rate of deforestation to which each protected area would have been exposed had it not been declared as protected (counterfactual). We estimated deforestation pressure non-parametrically by repeatedly sampling 1 km2 forest parcels from each protected area, matching sampled forest parcels to similar parcels that had not been protected until 2010, and measuring deforestation rates on these artificially generated control groups of forest parcels. Control parcels were located in the same state and outside a 10 km buffer around protected areas to reduce possible effects of local leakage on our estimates (Andam et al 2008). In line with related matching studies (Andam et al 2008, Joppa and Pfaff 2011, Nelson and Chomitz 2011), we used nearest-neighbor matching with replacement, controlling for six important covariates (all resampled to ∼1 km2 resolution using MODIS' sinusoidal projection).
- Average slope, from Fischer et al (2007).
- Average elevation, from Fischer et al (2007).
- % Floodable area, as identified by Arino et al (2009).
- Travel time to major cities, using own computations based on Nelson (2008) and improved road datasets from Soares-Filho et al (2006).
- Distance to forest edge, based on own computations that used per cent tree cover estimates (Hansen et al 2003), ESRI hydropolygons, as well as road datasets from Soares-Filho et al (2006).
- Baseline % forest cover (Hansen et al 2003).
We measured deforestation rates on protected and matched unprotected parcels as the total ratio of deforestation observed by Brazil's official deforestation monitoring system PRODES (Câmara et al 2006) between 2006 and 2010. We repeated sampling and matching 30 times for each protected area and averaged resulting estimates of deforestation pressure. We discarded forest parcels for which no suitable control parcel could be found within 1 SD of each covariate (calipers). To assure that matching was sufficiently representative for a given protected area, we discarded sites for which less than 50% of parcels could be matched. A total of 142 protected areas met all quality criteria, 66 of which had been subject to RAPPAM analyses. Average deforestation rates on protected and matched unprotected parcels were 0.51% and 1.89%, respectively, as compared to 1.12% for the entire Amazon.
2.2. Defining success groups
We used quantile regression to identify groups of protected areas whose deforestation rates in 2005–2010 had been high ('low success') versus low ('high success') as compared to protected areas of similar category and pressure. Deforestation in protected areas in the Brazilian Amazon has been shown to increase with deforestation pressure, with sustainable use areas exhibiting significantly higher deforestation rates than strict protected areas exposed to similar pressure (Nolte et al 2013). We therefore used deforestation pressure estimates and a dummy variable for sustainable use areas as the two independent variables in the quantile regression. Conducting the analysis without the sustainable use dummy variable yielded similar results. As distributions of both observed deforestation and deforestation pressure were highly skewed toward low values, we transformed these two variables to better satisfy regression assumptions. We chose τ (tau) values of 0.25, 0.5, and 0.75 to split our sample into four quartiles ranging from most to least successful in avoiding deforestation.
Following quantile regressions, we employed two distinct strategies to split our sample into more versus less successful protected areas. For our 'full sample', we merged the two upper and two lower quartiles into a 'low' (n = 38) and a 'high success' (n = 28) group, respectively. While taking advantage of the full sample size, this strategy did not yield a neat separation of groups, as many moderately successful areas exhibited deforestation rates very similar to their less successful counterparts (figure 1). Furthermore, many protected areas in the full sample had very low deforestation pressure estimates. We expected such remote areas to be more likely to allocate their management capacity toward other threats (e.g. logging, hunting, fishing, tourism impacts) and to be less relevant as barriers to deforestation; moreover, their categorization into success groups seemed more vulnerable to small variations in pressure estimates. We therefore developed an additional 'high confidence' sample, for which we juxtaposed only the least (n = 12) and most (n = 11) successful quartiles, and ignored observations whose deforestation pressure estimates were below a minimum threshold (<0.1%). Our assumption was that protected areas in the latter sample would differ more strongly in terms of RAPPAM scores that measure management aspects relevant to avoided deforestation success.
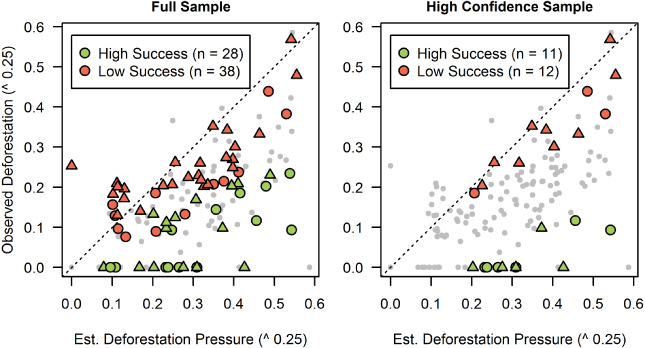
Figure 1. Observed deforestation rates and estimated deforestation pressure (2006–10) of 142 forest protected areas in the Brazilian Amazon. Circles indicate strict protected areas, triangles sustainable use areas. Gray dots indicate protected areas that were included in regressions, but did not have RAPPAM scores (left) or were excluded from the high confidence sample (right). All protected areas below the diagonal (y = x, dashed line) are estimated to have avoided deforestation.
Download figure:
Standard image2.3. Comparing RAPPAM indicators between groups
Once we had defined success groups, we examined how more and less successful areas differed in terms of RAPPAM scores. Given our interest in the predictive potential of RAPPAM, our analytical focus was on associations of 2005 scores with subsequent impacts on deforestation (2006–2010). However, many protected areas in the Brazilian Amazon received investments between 2006 and 2010 through the Amazon Region Protected Area (ARPA) project (ARPA 2010), which supported enforcement missions, acquisition of field equipment, and elaboration of management plans, among other activities. As ARPA investments could have been preferentially allocated toward areas with low or high RAPPAM scores, or low or high expected deforestation rates, we used 2010 RAPPAM data to examine whether observed differences between scores had changed between 2005 and 2010.
We used two-tailed t-tests to test for differences in indicators for each time period and each sample. Error probabilities for the full and high confidence sample are reported as pf and ph, respectively. We first examined whether success groups differed with respect to their composite RAPPAM management effectiveness scores, calculated as the average of all management-related RAPPAM scores (sections 6–16 of the RAPPAM questionnaire) for a given protected area. We then looked at group differences in terms of selected 'priority indicators' that reflect typical targets of conservation investments and were thus expected to be positively associated with success in avoiding deforestation. These indicators included adequacy of past and future budget, staff numbers, equipment, management plans, and stakeholder collaboration (see figure 2 for wording). As a third step, we mined the full set of 90 RAPPAM scores for significant differences between success groups, applying the Benjamini–Hochberg correction (α = 0.1) to reduce the risk of false discoveries. We used a similar approach to test whether success groups differed in the extent to which their RAPPAM scores had changed from 2005 to 2010 in order to detect possible biases in investments.

Figure 2. RAPPAM scores of protected areas estimated to have been more (green) versus less (red) successful at avoiding deforestation between 2006 and 2010. Possible responses include 'no' (0), 'rather no' (1), 'rather yes' (2) and 'yes' (3). We report (a) composite RAPPAM scores; (b) scores of priority indicators and (c) scores of indicators for which false discovery rate analysis identified significant group differences in at least one time period. Error bars indicate SD of each success group. Significance levels of individual t-tests: ∗∗∗p < 0.001, ∗∗p < 0.01,*p < 0.05.
Download figure:
Standard image3. Results
RAPPAM responses exhibited several noticeable patterns (figure 2). For many indicators, respondents used the full range of possible answers, creating sufficient variance to allow for meaningful comparisons. However, distributions of indicator scores pertaining to funding, staff numbers, equipment, and management plans were skewed toward negative responses in 2005, resulting in very low or even zero variance in some cases. The observation of low responses to funding and staff questions is consistent with global patterns (Leverington et al 2010). In our sample, those indicators improved considerably between 2005 and 2010, possibly reflecting the impact of ARPA investments. Although success groups differed in the extent to which some scores had changed over time, none of these differences was found be significant at the threshold defined by the Benjamini–Hochberg correction.
Composite RAPPAM management effectiveness scores of more successful protected areas were consistently higher than those of less successful protected areas. However, these differences tended to be very small and only significant for 2010 RAPPAM scores of the high confidence sample. Priority indicators seemed to perform even worse as predictors of avoided deforestation success. Across samples and time periods, none produced responses that differed sufficiently between high and low success groups to be significant at the 10% level. For some indicators and time periods, the absence of variance in scores precluded the existence of significant group differences.
Our data mining process identified only two indicators that passed the Benjamini–Hochberg test for at least one time period. Across samples and time periods, success groups differed significantly in whether protected area managers reported 'unsettled disputes regarding land tenure or use rights' (pf = 0.003/ph = 0.0005 in 2005 and pf = 0.036/ph = 0.004 in 2010). In 2010, success groups in the high confidence sample also differed significantly in the extent to which the protected area manager perceived local communities to support the overall objectives of the protected area (ph = 0.0007). However, this difference was not found to be significant for other combinations of time period and sample (pf = 0.203/ph = 0.259 in 2005 and pf = 0.124 in 2010). We added both indicators to figure 2 for reference.
4. Discussion
Given the widespread use of RAPPAM for prioritizing protected area interventions worldwide, the associations between its scores and avoided deforestation seem surprisingly weak. As RAPPAM is only one of many methods using subjective self-assessments to evaluate management, this observation constitutes both a puzzle and a potential reason for concern. If such a method failed to help discriminate between protected areas that are more or less successful in achieving a key conservation goal—especially in terms of typical targets of conservation investments—how are decision makers to use these scores to prioritize among policy, management and resource allocation responses? And if its scores seem to lack predictive power, does this finding point toward the method not measuring the right aspects—or not measuring them right?
Although the absence of verifiable alternative measures prevents us from providing a definitive answer to these questions, our results indicate that both 'what' and 'how' to measure have an influence on the observed patterns. Indeed, we observe the strongest associations with success for an indicator whose wording is relatively unambiguous ('no unsettled disputes'). Most priority indicators have qualifiers such as 'adequate' and 'sufficient' and exhibit far weaker associations. Furthermore, we find overall RAPPAM scores and local community attitudes in 2010 to have stronger associations with success than their respective 2005 scores. This finding seems to indicate that protected area managers are inclined to judge current management more positively if the protected area has successfully curbed deforestation in the past. Indeed, we would expect RAPPAM-measured management improvements to precede conservation impact and not vice versa. If subjective evaluations by protected area managers indeed exhibited such systematic biases, this would not only call into question the utility of many existing assessment methods (Cook and Hockings 2011), but might also undermine the findings of earlier studies using manager responses to estimate park success (Bruner et al 2001; see also Hayes 2006).
If, instead, we allow for the assumption that RAPPAM's workshop format eliminates potential biases in scores between protected areas, the missing links between budget, staff, equipment, management plans, collaboration and avoided deforestation seem all the more striking. Is it possible that the local management capacity of protected areas in the Brazilian Amazon bears only a minor influence on deforestation patterns? With a large number of protected areas located in remote locations, Brazil's federal and state governments have traditionally allocated only small budgets and staff numbers to individual conservation units. Recent attempts to curb Amazon deforestation relied heavily on concerted enforcement with federal and state-level police units, municipality-wide embargoes of agricultural commodities, and other policy instruments whose scope extended beyond the boundaries of individual protected areas. Spatial heterogeneity in the effects of these policies could potentially explain some of the observed differences in avoided deforestation success. However, such heterogeneity is not reflected in current RAPPAM scores.
Disputes regarding land tenure emerged as the one factor to be most consistently associated with the extent to which protected areas succeeded at avoiding deforestation. It was the only score that differed between success groups across time, and overshadowed all other factors in terms of significance. However, legal and financial responsibilities for resolving land tenure issues in Brazil are predominantly vested with central conservation authorities and thus beyond the obligations and budget lines of individual protected area managers. Indeed, of 24 protected area managers reporting land tenure issues in 2010 ('rather yes'/'yes'), 46% considered their budget in the previous five years to have been adequate ('rather yes'/'yes') for critical management activities. At the same time, RAPPAM provides little information about the adequacy of human and financial resources of authorities responsible for the resolution of land tenure issues, which may or may not vary across regions and protected areas and explain part of the differences in avoided deforestation success.
5. Outlook
If RAPPAM in its current version is only of limited utility for discriminating between protected areas that are more versus less successful at avoiding deforestation, our analysis provides a starting point for potential improvements. The possibility of a weak link between local management capacity and deforestation suggests that judgments on the adequacy of key management resources and processes may be inadequate if they do not account for the fact that important responsibilities for reducing threats to biodiversity may be distributed among actors at different administrative levels. Discriminating between key threats and corresponding key authorities in the judgments of management capacities may be a potential way forward to improve the extent to which RAPPAM helps identifying key bottlenecks in multi-level protected area management, and thus provide a better basis for the prioritization of conservation resources. Although our analysis did not explore the causal direction of links between scores and deforestation, its results suggest that the existence and resolution of land tenure conflicts warrants particular attention, and that RAPPAM's value as a prioritization method could improve if it helped to identify effective strategies in resolving such conflicts.
Although the focus of our analysis—protected areas and deforestation in the Amazon—is instructive, our study constitutes only a first look at the relationship between management effectiveness scores and conservation success. To improve the value of RAPPAM for conservation decisions, several other questions merit additional analysis: what causal relations can be identified between individual management aspects, especially land use disputes, and their relationship to conservation success? If local management capacity shows only weak associations with avoided deforestation, may it be more closely related to success in preventing more furtive types of threats, such as logging, hunting and fishing? Which management aspects seem more responsive to external conservation investments, and which do not? Can enhancements to the measurement of indicators (e.g. rephrasing, quantification, triangulation) enhance their predictive power? What influence do differences in institutional arrangements and political contexts bear on the usefulness of RAPPAM to characterize successful protected areas? Given the magnitude of international and national funding for protected areas, decision makers will continue to ask for information that helps prioritize investments. Only when available decision tools begin to provide insights into these questions will they begin to pave the way toward cost-effective conservation.
Acknowledgments
We thank Britaldo Soares-Filho for access to spatial datasets; Lilian Hangae and Marcelo Kinouchi for access to RAPPAM data; Desirae Hoffmann for computation of travel time estimates; Kerby Shedden and Dave Childers for assistance with the statistical analysis; and three anonymous referees for thoughtful comments. This work was supported by the School of Natural Resources and Environment, the Graham Environmental Sustainability Institute, the Rackham Graduate School at the University of Michigan, the Gordon and Betty Moore Foundation (grants 3006 and 464-2), and the Rights and Resources Initiative (grant RRI-N014705).