


Abstract
We present an analysis of observed trends and correlations between a large range of spectral and photometric parameters of more than 100 type II supernovae (SNe II), during the photospheric phase. We define a common epoch for all SNe of 50 days post-explosion, where the majority of the sample is likely to be under similar physical conditions. Several correlation matrices are produced to search for interesting trends between more than 30 distinct light-curve and spectral properties that characterize the diversity of SNe II. Overall, SNe with higher expansion velocities are brighter, have more rapidly declining light curves, shorter plateau durations, and higher 56Ni masses. Using a larger sample than previous studies, we argue that "Pd"—the plateau duration from the transition of the initial to "plateau" decline rates to the end of the "plateau"—is a better indicator of the hydrogen envelope mass than the traditionally used optically thick phase duration (OPTd: explosion epoch to end of plateau). This argument is supported by the fact that Pd also correlates with s3, the light-curve decline rate at late times: lower Pd values correlate with larger s3 decline rates. Large s3 decline rates are likely related to lower envelope masses, which enables gamma-ray escape. We also find a significant anticorrelation between Pd and s2 (the plateau decline rate), confirming the long standing hypothesis that faster declining SNe II (SNe IIL) are the result of explosions with lower hydrogen envelope masses and therefore have shorter Pd values.
Export citation and abstract BibTeX RIS
1. Introduction
It is commonly accepted that Core-Collapse Supernovae (CC-SNe) are produced by the explosion of massive ( ) stars. CC-SNe display a wide spectral and photometric variety, leading to the basis of their spectral classification. First order CC-SN classification is based on the presence or absence of hydrogen within SN spectra. SNe where hydrogen is clearly visible are called SNe II, while those without these features correspond to SNe Ib/c (Minkowski 1941; Filippenko 1997).
Initially, SNe II were classified according to the shape of the light curve: SNe with a faster decline rate are called SNe IIL, while SNe with almost constant luminosity for several months were called SNe IIP (Barbon et al. 1979). However, years later, two new classes of SNe II emerged: SNe IIn and SNe IIb. SNe IIn show narrow emission lines in their spectra, possibly due to steady interaction with a circumstellar medium (CSM; Schlegel 1990), while SNe IIb are thought to be transitional events between SNe II and SNe Ib (Filippenko et al. 1993). The overall properties of SNe IIn and SNe IIb are sufficiently distinct from "normal" SNe II, that we do not include them for study, and they are no longer discussed in this paper.
With ever increasing numbers of SNe, new subclasses have appeared. Blanco et al. (1987), Menzies et al. (1987), Hamuy et al. (1988), Phillips et al. (1988), and Suntzeff et al. (1988) presented analysis of SN 1987A, an object that exhibited typical characteristics of the SN II spectra, but a peculiar light curve. With this SN, the 87A-like objects were introduced. Examples of these SNe can be found in Pastorello et al. (2005, 2012) and Taddia et al. (2013).12 Later, Pastorello et al. (2004) and more recently Spiro et al. (2014) studied the properties of low luminosity SNe II, which additionally have narrow spectral lines (indicating low expansion velocities). On the other hand, Inserra et al. (2013) analyzed a group of luminous SNe II. Lately, intermediate luminosity SNe have also been studied, supporting the wide diversity in SNe II (e.g., Roy et al. 2011; Takáts et al. 2014).
Red super-giant (RSG) stars with zero-age main-sequence mass  have generally been assumed as the progenitors of SNe II, with hydrodynamical modeling supporting this hypothesis (Chevalier 1976). In recent years, a significant number of direct identifications of the progenitor stars of nearby SNe IIP (e.g., Van Dyk et al. 2003; Smartt et al. 2004, 2009; Maund & Smartt 2005; Smartt 2015) suggest that RSG stars with masses of 8–18
  are their progenitors, supporting initial assumptions. There is little observational constraint on the progenitor mass range of SNe IIL because only two direct identifications have been obtained (Elias-Rosa et al. 2010, 2011, but see Maund et al. 2015); however, these do provide some evidence in favor of higher mass progenitors. Nevertheless, a recent analysis done by Valenti et al. (2016) with the light curves and spectra of 16 SNe II did not find any evidence for progenitor mass differences between SNe of different decline rates.
While direct detections of progenitors have constrained a relatively narrow mass range for SNe II, the same SNe show significant differences in their final explosive displays (e.g., SN 2004et, a normal SNe II, and SN 2008bk, a low luminosity event). It must therefore be that differences in stellar evolutionary processes leave the progenitors in different final states (e.g., the extent of the hydrogen envelope, the progenitor radius at explosion, the CSM) or explode with, e.g., different energies, in order to produce the diversity we observe.
Theoretical studies have suggested that progenitors that explode with smaller hydrogen envelope masses produce faster declining light curves (SNe IIL), together with shorter or nonexistent "plateaus" (e.g., Litvinova & Nadezhin 1983; Bartunov & Blinnikov 1992; Popov 1993; Morozova et al. 2015; Moriya et al. 2016). An alternative study presented by Kasen & Woosley (2009) shows that a change in the explosion energy leads to a range of luminosities, velocities, and light-curve durations. That is to say, higher explosion energies result in brighter events with higher expansion velocities and shorter plateaus. They also found that an increasing synthesized 56Ni mass extends the length of the plateau (see also Bersten 2013). Meanwhile, Dessart et al. (2013b) using radiative-transfer models explored the properties of SNe II changing the physical parameters of the progenitor and/or the explosion (e.g., metallicity, explosion energy, and radius). They found that the radius has an influence on the temperature/ionization/color evolution (more compact objects cool and recombine faster) and in the plateau brightness, while a variation in the explosion energy leads to a variation of the plateau brightness and the plateau duration, consistent with Kasen & Woosley (2009).
To quantify the spectral and photometric diversity, a number of statistical studies of SNe II have been published. Patat et al. (1994) characterized the properties of 57 SNe II using the maximum B-band magnitude, the color at maximum, and the ratio of emission to absorption (e/a) in  . They showed that faster declining events are more luminous, have shallower P-Cygni profiles and are bluer than SNe IIP. The majority of more recent studies have focused on SNe IIP. Hamuy et al. (2002) analyzed 17 SNe IIP and found that SNe with brighter plateaus have higher expansion velocities (also seen in the models of Bersten 2013). Hamuy (2003) concluded that more massive SN IIP progenitors produce more energetic explosions and in turn produce more nickel. Similar results were found by Pastorello et al. (2003) and more recently by Faran et al. (2014b). The only exception to these works about SNe IIP was published by Faran et al. (2014a), who analyzed a sample of SNe IIL. They found that faster declining SNe II (SNe IIL) are brighter than slower declining events (SNe IIP), confirming previous results.
Gutiérrez et al. (2014) and Anderson et al. (2014a), using a large sample of SNe II, analyzed the dominant line in SNe II, the  P-Cygni profile. Gutiérrez et al. (2014) using a sample of 52 SNe II (a subsample of that which we present here) showed that SNe with smaller values of a/e (the inverse of the ratio previously discussed by Patat et al. 1994) are brighter and have faster declining light curves. They concluded that these relationships and the diversity of a/e can be understood in terms of a varying hydrogen envelope mass at explosion epoch, together with the possibility of an influence of circumstellar interaction. Meanwhile, Anderson et al. (2014a) analyzed the blueshifted offset in the emission peaks of
  of 95 SNe II. Through comparison to spectral modeling (Dessart & Hillier 2005; Dessart et al. 2013a), they argue that this behavior is a natural consequence of the distinct density profiles found in SN ejecta.
Using a sample of 117 SNe II, Anderson et al. (2014b; hereafter A14) studied the V-band light curve diversity of these objects. They found that SNe II with shorter plateau duration (Pd) exhibit faster decline rates (s2 in their nomenclature). They concluded that the envelope mass at the epoch of explosion is the dominant physical parameter that explains this observed diversity. Similar results were found by Sanders et al. (2015), Valenti et al. (2016), and Galbany et al. (2016). They also found that SNe IIP and SNe IIL show a continuum in their photometric properties and it is not suitable to isolate them in two distinct classes or types.
In addition to these results, A14 found relatively high radioactive decline rates (s3) for a significant number of SNe. In 56Ni powered light curves at late times, full gamma-ray and positron trapping yields a decline rate s3 of 0.98mag per 100 days. Higher decline rates than this value therefore suggest less efficient trapping of gamma-ray emission (or much greater explosion energies), suggesting lower mass ejecta for these SNe II.
The previous discussion shows how numerous relations between observed photometric and spectral parameters have been used to understand the SN II phenomenon. However, there are many additional parameters that have not been included in this discussion to date. Inclusion of additional parameters can aid in furthering our understanding of the underlying physics of SNe II. This motivates our current work where we study a sample of almost 1000 optical-wavelength spectra of  SNe II. To that aim, we have divided the analysis into two papers. In Gutiérrez et al. (2017; hereafter Paper I), we present the full description of the observations, data reduction techniques, and the spectral properties. We also discuss the spectral matching technique to estimate the explosion epochs, the analysis of the spectral line evolution and the nature of the extra absorption component on the blue side of
  .
.
Here, in Paper II, we analyze the correlations between different spectral parameters defined to explore the diversity of SNe II, together with their correlation with previously defined photometric measurements. Expansion velocities, pseudo-equivalent widths (pEWs), the ratio of absorption to emission (a/e) of the  P-Cygni profile, and velocity decline rates are used to search for correlations with photometric parameters and between other spectral properties. We analyze spectral correlations and determine the most important properties to compare them with the photometric parameters. Our overall aim is to search for trends between different measured parameters and then attempt to link these to the underlying physical properties of SN II progenitors.
The paper is organized as follows. Section 2 briefly describes the data employed for this analysis. In Section 3, we describe our measurement techniques. An overall current physical understanding of our different observed parameters is presented in Section 4. The full analysis is presented in Section 5. We discuss our results in Section 6 and present our conclusions in Section 7.
2. Data
The data used in this analysis were published in A14 and Paper I. The details of the spectroscopic and photometric observations and reductions can be found in the mentioned studies. On average, we have seven spectra per SN, which are analyzed together with their V-band light curves. Details of these SNe are available in A14, Anderson et al. (2014a), Gutiérrez et al. (2014), Galbany et al. (2016), and Paper I.
A small number of SNe presented in Paper I are excluded from this work because they have insufficient spectral and/or photometric data to be useful (SNe 1988A, 1990E, 1992ad, 1992am, 1993A, 1999eg, 2002ew, 2003dq, 2004dy, 2005dw, 2005es, 2005K, 2005me, 2006bc, 2007Z, 2008F, and 2009W).
3. Measurements
The evolution of SNe II can be studied according to both spectral and photometric behavior. At early phases, the spectra exhibit the Balmer lines ( ,
,  ,
,  ,
,  ), and He i
  . With time, the iron-group lines start to appear and to dominate the region between 4000 Å and 6000 Å. The Ca ii triplet, Na i D, and O i also emerge. The light curve at the beginning shows a fast rise to peak brightness, followed by a slight decline, which is powered by the release of shock deposited energy. Around ∼30 days post-explosion a plateau arises from the fact that the expansion of the ejecta at the photosphere compensates for the drop in optical depth. When the photospheric phase ends (around 80–120 days post-explosion, A14), the transition to the nebular phase starts and the brightness drops. Once this happens, the radioactive tail phase starts. This phase is powered by the radioactive decay of 56Co to 56Fe. Later than ∼200 days, the spectra are dominated by forbidden lines, which are formed in the inner part of the ejecta. Much diversity is observed both in spectra and photometry, which suggests differences in the properties of the progenitor star and the explosion.
To study the diversity within SNe II, we use the spectral and photometric parameters defined in Gutiérrez et al. (2014) and A14. We also define a number of additional parameters below. These measurements are chosen to enable a full characterization of the diversity of SN II V-band light curves and optical spectra.
3.1. Spectral Measurements
Before proceeding with our spectral analysis, below we summarize the parameters we use, as defined in Paper I.
- 1.v corresponds to the expansion velocity. It is measured from the minimum flux of the absorption component of P-Cygni line profile. In this analysis, we measure this parameter for 11 features in the photospheric phase:
 , , Fe ii λ4924, Fe ii λ5018, Fe ii λ5169, Sc ii/Fe ii λ5531, Sc ii multiplet λ5663, Na i D, Ba ii λ6142, Sc ii λ6247, and O i λ7774. In the case of , the velocity was also derived using the full width at half maximum (FWHM) of the emission component.
 - 2.(: defined as the rate of change of the expansion velocity of the feature. This parameter was measured at five distinct intervals (see Paper I); however, here we only use the interval days, as this shows the highest correlation with other parameters.
- 3. is defined as the velocity difference between and Fe ii λ5018, and Na i D and Fe ii λ5018.
- 4.pEW corresponds to the absorption/emission strength of a particular line. Here, we measure the absolute value of pEW for the same features mentioned above.
- 5.a/e is defined as the flux ratio of the absorption to emission component of P-Cygni profile. This ratio is the inverse of that presented by Patat et al. (1994). We propose a/e as this deals better with weak absorption values that are shown by a number of SNe II in our sample.


While measurements were performed in all epochs at which we obtained spectra, we choose to define common epochs between SNe at 30, 50, and 80 days post-explosion. An interpolation and extrapolation is used to obtain parameter values at these epochs. The values obtained by the interpolation are used when two available spectra are present ±15 days around the common epoch, while the values from the extrapolation are used at ±10 days. These intervals were chosen as they increase the strength of observed correlations. Using bigger intervals deteriorates the correlations because the polynomial does not produce reliable results in some cases (particularly for the pEW). At ±15 and ±10 days for interpolation and extrapolation, respectively, the results do not show a significant change compared to those obtained using a smaller interval. Hence, our choice of intervals is justified. To estimate the velocity at a common epoch, we do an interpolation/extrapolation using a power-law fit. For the pEW, we use a low order (first or second) polynomial fit. Power-law fits were found to produce satisfactory results in the case of velocity measurements; however, for pEWs, we found that low order polynomials were required. For this parameter, we used a low order polynomial and determined the best fit using the normalized root mean square (rms) of different orders. The errors of each measurement were obtained with the rms error fit. In summary, we are able to use spectral parameter values in 88, 84, and 59 SNe at 30, 50, and 80 days, respectively.
3.2. Photometric Measurements
Historical separation of SNe II into distinct classes was based on photometric differences in, e.g., decline rates and absolute magnitudes. Hence it is essential to include photometric parameters in our analysis for a full understanding of observed correlations and their implications for SN II physics. Here, we use the V-band photometric parameters already defined (and measured) in A14, which we now summarize.
- 1.t0 corresponds to the explosion epoch (see Paper I for more details of their estimation).
- 2.ttran is determined as the transition between the initial decline (s1) and the plateau decline (s2).
- 3.tend corresponds to the end of the optically thick phase (i.e., the end of the plateau phase).
- 4.tPT is the midpoint of the transition from plateau to radioactive tail.
- 5.OPTd is the duration of the optically thick phase and is equal to.
- 6.Pd is the plateau duration, defined between ttran and tend.
- 7.Mmax is defined as the initial peak in the V-band light curve.
- 8.Mend is defined as the absolute V-band magnitude measured 30 days before tPT.
- 9.Mtail is defined as the absolute V-band magnitude measured 30 days after tPT.
- 10.s1 is defined as the decline rate (V-band magnitudes per 100 days) of steeper slope of the light curve.
- 11.s2 is defined as the decline rate (V-band magnitudes per 100 days) of the second, shallower slope in the light curve.
- 12.s3 is defined as the linear decline rate (V-band magnitudes per 100 days) of the slope in the radioactive tail part.
- 13.56Ni mass corresponds to the mass of radioactive nickel synthesized in the explosion. (A14 for exact details of how this was estimated).

Initial values for these parameters can be found in Table 5 in A14; however, it should be noted that in this work some of these parameters have been updated: ttran, OPTd, Pd, Mmax, Mend, Mtail, s1, and s2. In the case of magnitudes, it was found that stronger correlations were obtained with other parameters before any extinction corrections were made. This suggests that (a) in the vast majority of cases host galaxy extinction is relatively small, and (b) when we do make extinction corrections (using the absorption Na i D in A14), such corrections are not particularly accurate. Therefore, all magnitudes are being used without host galaxy extinction corrections. For ttran, we used the F-test to decide whether a one or two slope fit was better; A14 used the BIC criterion. The main difference resides in how the F-test penalizes the number of parameters of each model (more details in L. Galbany et al. 2017, in preparation). This method increases the number of SNe with ttran available, and in turn this increases the number of SNe for which we can define s1 and Pd. A visual check of those SNe II showing ttrans using both the F-test and the BIC criterion was performed, and this gives us confidence in the use of the former in this work. All values used in the current analysis are listed in Table 1.
Table 1. Photometric Parameters
| SN | Pd | OPTd | Cd | Mmax | Mend | Mtail | s1 | s2 | s3 | 56Ni mass | Δ(B − V)
|
|---|---|---|---|---|---|---|---|---|---|---|---|
| (days) | (days) | (days) | (mag) | (mag) | (mag) | (mag.100 day−1) | (mag.100 day−1) | (mag.100 day−1) |

|
||
| 1986L | 59.56 ± 0.71 | 93.74 ± 6.71 | 34.18 ± 3.08 | −18.19 ± 0.20 | −16.88 ± 0.20 | −14.37 ± 0.20 | 3.26 ± 0.14 | 1.26 ± 0.03 | ⋯ | >0.061 | 2.63 ± 0.42 |
| 1990K | ⋯ | ⋯ | ⋯ | ⋯ | ⋯ | ⋯ | ⋯ | 2.39 ± 0.08 | ⋯ | ⋯ | ⋯ |
| 1991al | ⋯ | ⋯ | ⋯ | −17.51 ± 0.15 | −17.03 ± 0.15 | −14.71 ± 0.15 | ⋯ | 1.45 ± 0.04 | 1.26 ± 0.26 |

|
3.69 ± 0.24 |
| 1992af | ⋯ | 47.03 ± 6.71 | ⋯ | −17.33 ± 0.12 | −17.20 ± 0.12 | −15.06 ± 0.12 | ⋯ | 0.58 ± 0.03 | 1.07 ± 0.08 |

|
1.90 ± 0.83 |
| 1992ba | ⋯ | 106.97 ± 8.54 | ⋯ | −15.34 ± 0.80 | −14.75 ± 0.80 | −12.34 ± 0.80 | ⋯ | 0.72 ± 0.02 | 0.86 ± 0.07 |

|
2.80 ± 0.21 |
| 1993K | ⋯ | ⋯ | ⋯ | −17.92 ± 0.23 | −17.24 ± 0.23 | ⋯ | ⋯ | 2.36 ± 0.08 | ⋯ | ⋯ | 1.82 ± 0.09 |
| 1993S | ⋯ | ⋯ | ⋯ | −17.52 ± 0.07 | −16.29 ± 0.07 | ⋯ | ⋯ | 2.34 ± 0.04 | ⋯ | ⋯ | 3.63 ± 0.51 |
| 1999br | ⋯ | ⋯ | ⋯ | −13.77 ± 0.40 | −13.56 ± 0.40 | ⋯ | ⋯ | 0.14 ± 0.02 | ⋯ | >0.002 | 3.58 ± 0.39 |
| 1999ca | 40.54 ± 0.92 | 79.48 ± 7.62 | 38.94 ± 7.06 | −17.48 ± 0.21 | −16.60 ± 0.21 | −13.78 ± 0.21 | 3.49 ± 0.16 | 1.65 ± 0.06 | 1.74 ± 0.33 | >0.047 | ⋯ |
| 1999cr | 43.55 ± 1.68 | 79.06 ± 7.62 | 35.51 ± 4.34 | −16.90 ± 0.10 | −16.23 ± 0.10 | ⋯ | 1.78 ± 0.09 | 0.49 ± 0.08 | ⋯ | ⋯ | 1.77 ± 0.38 |
| 1999em | 67.04 ± 2.12 | 96.04 ± 5.83 | 29.00 ± 5.43 | −16.76 ± 0.07 | −16.37 ± 0.07 | −13.93 ± 0.07 | 0.86 ± 0.11 | 0.30 ± 0.02 | 0.88 ± 0.05 |

|
3.07 ± 0.23 |
| S0210 | ⋯ | 93.57 ± 9.49 | ⋯ | −16.21 ± 0.04 | −15.90 ± 0.04 | ⋯ | ⋯ | 2.37 ± 0.07 | ⋯ | ⋯ | ⋯ |
| 2002fa | ⋯ | 68.289 ± 7.62 | ⋯ | −16.95 ± 0.04 | −16.65 ± 0.04 | ⋯ | ⋯ | 1.56 ± 0.11 | ⋯ | >0.066 | ⋯ |
| 2002gd | ⋯ | ⋯ | 35.00 ± 4.09 | −15.43 ± 0.28 | −14.85 ± 0.28 | ⋯ | 1.87 ± 0.09 | 0.15 ± 0.04 | ⋯ | ⋯ | 3.21 ± 0.28 |
| 2002gw | ⋯ | 88.33 ± 5.83 | ⋯ | −15.76 ± 0.23 | −15.48 ± 0.23 | −13.07 ± 0.23 | ⋯ | 0.22 ± 0.03 | 0.75 ± 0.09 |

|
2.55 ± 0.20 |
| 2002hj | ⋯ | 90.24 ± 7.62 | ⋯ | −16.91 ± 0.10 | −16.03 ± 0.10 | −13.59 ± 0.10 | ⋯ | 1.57 ± 0.05 | 1.41 ± 0.01 | >0.026 | ⋯ |
| 2002hx | ⋯ | 68.03 ± 9.49 | ⋯ | −17.00 ± 0.07 | −16.36 ± 0.07 | −14.60 ± 0.07 | ⋯ | 1.51 ± 0.03 | 1.24 ± 0.04 |

|
2.26 ± 0.32 |
| 2002ig | ⋯ | ⋯ | ⋯ | −17.66 ± 0.03 | −16.76 ± 0.03 | ⋯ | ⋯ | 2.20 ± 0.12 | ⋯ | ⋯ | 2.42 ± 0.66 |
| 2003B | ⋯ | 86.19 ± 11.40 | ⋯ | −15.36 ± 0.28 | −15.11 ± 0.28 | −12.77 ± 0.28 | ⋯ | 0.65 ± 0.03 | 1.07 ± 0.03 |

|
⋯ |
| 2003bl | ⋯ | 95.81 ± 4.24 | ⋯ | −15.35 ± 0.14 | −15.01 ± 0.14 | ⋯ | ⋯ | 0.35 ± 0.02 | ⋯ | ⋯ | 2.83 ± 0.46 |
| 2003bn | 62.96 ± 10.51 | 92.97 ± 4.24 | 30.01 ± 10.93 | −16.80 ± 0.16 | −16.34 ± 0.16 | −13.72 ± 0.16 | 1.38 ± 0.9 | 0.32 ± 0.03 | ⋯ | >0.038 | 2.94 ± 0.25 |
| 2003ci | ⋯ | 92.53 ± 8.54 | ⋯ | −16.83 ± 0.07 | −15.70 ± 0.07 | ⋯ | ⋯ | 1.91 ± 0.04 | ⋯ | ⋯ | ⋯ |
| 2003cn | 48.86 ± 3.99 | 69.8 ± 5.00 | 20.94 ± 5.65 | −16.26 ± 0.11 | −15.61 ± 0.11 | ⋯ | 2.7 ± 1.14 | 1.34 ± 0.04 | ⋯ | ⋯ | 2.73 ± 0.45 |
| 2003cx | ⋯ | 90.82 ± 5.83 | ⋯ | −16.79 ± 0.06 | −16.38 ± 0.06 | −14.32 ± 0.06 | ⋯ | 0.61 ± 0.04 | ⋯ | >0.051 | 1.95 ± 0.65 |
| 2003E | ⋯ | 101.42 ± 7.62 | ⋯ | −15.70 ± 0.15 | −15.48 ± 0.15 | ⋯ | ⋯ | −0.10 ± 0.03 | ⋯ | ⋯ | 1.49 ± 0.25 |
| 2003ef | ⋯ | 92.93 ± 9.49 | ⋯ | −16.72 ± 0.14 | −16.15 ± 0.14 | ⋯ | ⋯ | 0.78 ± 0.02 | ⋯ | ⋯ | 2.76 ± 0.39 |
| 2003eg | ⋯ | ⋯ | 30.87 ± 5.04 | −17.81 ± 0.13 | −14.57 ± 0.13 | ⋯ | 6.75 ± 0.18 | 1.73 ± 0.13 | ⋯ | ⋯ | 1.35 ± 0.18 |
| 2003ej | ⋯ | 68.97 ± 5.83 | ⋯ | −17.66 ± 0.12 | −15.66 ± 0.12 | ⋯ | ⋯ | 3.29 ± 0.04 | ⋯ | ⋯ | 2.95 ± 0.29 |
| 2003fb | ⋯ | 88.27 ± 6.71 | ⋯ | −15.56 ± 0.12 | −15.25 ± 0.12 | −13.10 ± 0.12 | ⋯ | 0.46 ± 0.06 | 1.61 ± 0.39 | >0.017 | ⋯ |
| 2003gd | ⋯ | ⋯ | ⋯ | ⋯ | −15.97 ± 0.40 | −12.58 ± 0.40 | ⋯ | 2.22 ± 0.05 | 1.03 ± 0.04 |

|
⋯ |
| 2003hd | ⋯ | 84.39 ± 5.83 | ⋯ | −17.29 ± 0.06 | −16.72 ± 0.06 | −13.85 ± 0.06 | ⋯ | 0.93 ± 0.04 | 0.72 ± 0.68 |

|
2.80 ± 0.21 |
| 2003hg | 63.98 ± 1.67 | 108.5 ± 5.83 | 44.52 ± 5.27 | −16.38 ± 0.16 | −15.50 ± 0.16 | ⋯ | 1.35 ± 0.05 | 0.52 ± 0.04 | ⋯ | ⋯ | 3.01 ± 0.47 |
| 2003hk | 58.96 ± 2.34 | 87.00 ± 5.00 | 28.04 ± 4.63 | −17.02 ± 0.10 | −16.36 ± 0.10 | −13.14 ± 0.10 | 3.09 ± 0.20 | 1.61 ± 0.06 | 0.40 ± 0.66 | >0.017 | ⋯ |
| 2003hl | ⋯ | 108.92 ± 5.83 | ⋯ | −15.91 ± 0.30 | −15.23 ± 0.30 | ⋯ | ⋯ | 0.76 ± 0.01 | ⋯ | ⋯ | 2.92 ± 0.31 |
| 2003hn | 58.34 ± 1.55 | 90.1 ± 10.44 | 31.76 ± 10.12 | −16.74 ± 0.10 | −15.96 ± 0.10 | −13.27 ± 0.10 | 5.69 ± 0.27 | 2.52 ± 0.07 | 1.08 ± 0.05 |

|
2.88 ± 0.29 |
| 2003ho | ⋯ | ⋯ | ⋯ | ⋯ | −14.75 ± 0.16 | −12.00 ± 0.16 | ⋯ | 2.25 ± 0.11 | 1.69 ± 0.10 | >0.005 | ⋯ |
| 2003ib | ⋯ | ⋯ | ⋯ | −17.10 ± 0.09 | −16.09 ± 0.09 | ⋯ | ⋯ | 1.64 ± 0.03 | ⋯ | ⋯ | 1.16 ± 0.22 |
| 2003ip | ⋯ | 80.74 ± 5.00 | ⋯ | −17.75 ± 0.13 | −16.65 ± 0.13 | ⋯ | ⋯ | 2.03 ± 0.03 | ⋯ | ⋯ | 2.31 ± 0.25 |
| 2003iq | ⋯ | 84.91 ± 3.61 | ⋯ | −16.69 ± 0.30 | −16.18 ± 0.30 | ⋯ | ⋯ | 0.72 ± 0.01 | ⋯ | ⋯ | 2.42 ± 0.28 |
| 2003T | ⋯ | 90.59 ± 10.44 | ⋯ | −16.54 ± 0.08 | −16.03 ± 0.08 | −13.67 ± 0.08 | ⋯ | 0.69 ± 0.02 | 2.02 ± 0.14 | >0.030 | 2.74 ± 0.82 |
| 2004ej | ⋯ | 97.14 ± 8.54 | ⋯ | −16.62 ± 0.21 | −16.13 ± 0.21 | −12.92 ± 0.21 | ⋯ | 1.04 ± 0.04 | 0.89 ± 0.13 |

|
⋯ |
| 2004er | 57.27 ± 1.66 | 120.12 ± 5.00 | 62.85 ± 2.6 | −16.74 ± 0.16 | −15.67 ± 0.16 | ⋯ | 1.08 ± 0.02 | 0.52 ± 0.02 | ⋯ | ⋯ | 2.13 ± 1.53 |
| 2004fb | ⋯ | ⋯ | ⋯ | −16.19 ± 0.11 | −15.46 ± 0.11 | ⋯ | ⋯ | 1.26 ± 0.07 | ⋯ | ⋯ | ⋯ |
| 2004fc | 68.06 ± 2.68 | 106.06 ± 3.16 | 38.00 ± 2.86 | −16.21 ± 0.31 | −15.41 ± 0.31 | ⋯ | 1.13 ± 0.03 | 0.50 ± 0.05 | ⋯ | ⋯ | 2.92 ± 0.20 |
| 2004fx | ⋯ | 68.41 ± 5.00 | ⋯ | −15.58 ± 0.24 | −15.33 ± 0.24 | −12.87 ± 0.24 | ⋯ | 0.25 ± 0.02 | 0.93 ± 0.08 |

|
1.52 ± 0.20 |
| 2005af | ⋯ | 107.01 ± 15.30 | ⋯ | ⋯ | −14.94 ± 0.36 | −13.41 ± 0.36 | ⋯ | 0.40 ± 0.05 | 1.25 ± 0.03 |

|
⋯ |
| 2005an | 36.02 ± 0.63 | 74.67 ± 5.00 | 38.65 ± 6.03 | −17.07 ± 0.18 | −15.89 ± 0.18 | ⋯ | 3.21 ± 0.05 | 1.85 ± 0.05 | ⋯ | ⋯ | 2.89 ± 0.08 |
| 2005dk | 38.97 ± 1.47 | 82.24 ± 6.71 | 43.27 ± 6.18 | −17.52 ± 0.14 | −16.74 ± 0.14 | ⋯ | 2.25 ± 0.09 | 1.10 ± 0.07 | ⋯ | ⋯ | ⋯ |
| 2005dn | 45.82 ± 3.31 | 78.72 ± 6.71 | 32.9 ± 6.85 | −17.01 ± 0.24 | −16.38 ± 0.24 | ⋯ | 2.00 ± 0.23 | 1.48 ± 0.04 | ⋯ | ⋯ | ⋯ |
| 2005dt | ⋯ | 112.9 ± 9.49 | ⋯ | −16.39 ± 0.09 | −15.84 ± 0.09 | ⋯ | ⋯ | 0.58 ± 0.06 | ⋯ | ⋯ | ⋯ |
| 2005dx | ⋯ | 89.98 ± 7.62 | ⋯ | −16.05 ± 0.08 | −15.24 ± 0.08 | −12.12 ± 0.08 | ⋯ | 1.26 ± 0.05 | ⋯ | >0.007 | 3.21 ± 0.31 |
| 2005dz | 32.40 ± 2.84 | 81.86 ± 5.00 | 49.46 ± 4.91 | −16.57 ± 0.12 | −15.97 ± 0.12 | −13.42 ± 0.12 | 1.09 ± 0.03 | 0.36 ± 0.10 | ⋯ | >0.021 | 2.28 ± 0.25 |
| 2005J | 53.01 ± 1.93 | 97.01 ± 7.62 | 44.00 ± 7.26 | −17.28 ± 0.14 | −16.35 ± 0.14 | ⋯ | 1.51 ± 0.03 | 1.04 ± 0.02 | ⋯ | ⋯ | 2.93 ± 0.17 |
| 2005lw | ⋯ | 107.25 ± 10.44 | ⋯ | −17.07 ± 0.08 | −15.47 ± 0.08 | ⋯ | ⋯ | 2.04 ± 0.04 | ⋯ | ⋯ | 2.86 ± 0.70 |
| 2005Z | ⋯ | 78.88 ± 6.71 | ⋯ | −17.17 ± 0.11 | −16.17 ± 0.11 | ⋯ | ⋯ | 1.76 ± 0.01 | ⋯ | ⋯ | 3.04 ± 0.29 |
| 2006ai | 38.28 ± 0.46 | 63.26 ± 5.83 | 24.98 ± 5.02 | −18.06 ± 0.14 | −17.03 ± 0.14 | −14.53 ± 0.14 | 4.61 ± 0.10 | 2.05 ± 0.04 | 1.78 ± 0.24 | >0.050 | 2.02 ± 0.15 |
| 2006be | 43.81 ± 1.32 | 76.2 ± 6.71 | 32.39 ± 9.10 | −16.47 ± 0.29 | −16.08 ± 0.29 | ⋯ | 1.19 ± 0.08 | 0.63 ± 0.02 | ⋯ | ⋯ | 3.04 ± 0.11 |
| 2006bl | ⋯ | ⋯ | 17.3 ± 11.16 | −18.23 ± 0.07 | −16.52 ± 0.07 | ⋯ | 3.05 ± 0.54 | 2.41 ± 0.06 | ⋯ | ⋯ | 2.15 ± 0.38 |
| 2006ee | 59.04 ± 2.95 | 85.15 ± 5.00 | 26.11 ± 4.97 | −16.28 ± 0.15 | −16.04 ± 0.15 | ⋯ | 0.98 ± 0.29 | 0.17 ± 0.03 | ⋯ | ⋯ | 2.45 ± 0.19 |
| 2006it | ⋯ | ⋯ | ⋯ | −16.20 ± 0.15 | −15.97 ± 0.15 | ⋯ | ⋯ | 1.14 ± 0.10 | ⋯ | ⋯ | 3.98 ± 0.14 |
| 2006iw | ⋯ | ⋯ | ⋯ | −16.89 ± 0.07 | −16.18 ± 0.07 | ⋯ | ⋯ | 1.00 ± 0.03 | ⋯ | ⋯ | 2.24 ± 0.67 |
| 2006ms | ⋯ | ⋯ | 32.83 ± 6.62 | −16.18 ± 0.15 | −15.93 ± 0.15 | ⋯ | 1.65 ± 0.2 | −0.05 ± 0.45 | ⋯ | >0.056 | 4.12 ± 0.12 |
| 2006qr | ⋯ | 96.85 ± 7.62 | ⋯ | −15.99 ± 0.14 | −14.24 ± 0.14 | ⋯ | ⋯ | 1.40 ± 0.02 | ⋯ | ⋯ | 2.88 ± 0.45 |
| 2006Y | 24.69 ± 0.63 | 47.49 ± 5.00 | 22.8 ± 4.05 | −17.97 ± 0.06 | −16.98 ± 0.06 | −14.26 ± 0.06 | 5.84 ± 0.13 | 2.11 ± 0.18 | 4.75 ± 0.34 | >0.034 | 1.52 ± 0.25 |
| 2007aa | ⋯ | ⋯ | ⋯ | −16.32 ± 0.27 | −16.32 ± 0.27 | ⋯ | ⋯ | −0.05 ± 0.02 | ⋯ | ⋯ | ⋯ |
| 2007ab | ⋯ | 71.66 ± 10.44 | ⋯ | −16.98 ± 0.09 | −16.55 ± 0.09 | −14.22 ± 0.09 | ⋯ | 3.18 ± 0.06 | 2.31 ± 0.22 | >0.040 | ⋯ |
| 2007av | ⋯ | ⋯ | ⋯ | −16.27 ± 0.22 | −15.60 ± 0.22 | ⋯ | ⋯ | 0.92 ± 0.01 | ⋯ | >0.015 | 2.21 ± 0.13 |
| 2007bf | ⋯ | ⋯ | ⋯ | ⋯ | ⋯ | ⋯ | ⋯ | ⋯ | ⋯ | ⋯ | ⋯ |
| 2007hm | ⋯ | ⋯ | ⋯ | −16.47 ± 0.09 | −16.00 ± 0.09 | ⋯ | ⋯ | 1.52 ± 0.04 | ⋯ | >0.045 | 1.43 ± 0.28 |
| 2007il | 68.68 ± 2.43 | 103.4 ± 5.00 | 34.72 ± 4.68 | −16.78 ± 0.11 | −16.59 ± 0.11 | ⋯ | 1.06 ± 0.34 | 0.12 ± 0.04 | ⋯ | ⋯ | 2.21 ± 0.12 |
| 2007it | ⋯ | ⋯ | 13.95 ± 2.64 | −17.55 ± 0.50 | ⋯ | −14.83 ± 0.50 | 3.55 ± 1.06 | 1.33 ± 0.14 | 1.00 ± 0.01 |

|
2.67 ± 0.10 |
| 2007ld | ⋯ | ⋯ | ⋯ | −17.30 ± 0.09 | −16.53 ± 0.09 | ⋯ | ⋯ | 2.62 ± 0.04 | ⋯ | ⋯ | 2.13 ± 0.50 |
| 2007oc | 42.78 ± 0.59 | 71.62 ± 5.83 | 28.84 ± 3.06 | −16.68 ± 0.15 | −16.02 ± 0.15 | ⋯ | 2.87 ± 0.10 | 1.78 ± 0.01 | ⋯ | ⋯ | ⋯ |
| 2007od | ⋯ | ⋯ | 19.61 ± 5.06 | −17.87 ± 0.80 | −16.81 ± 0.80 | ⋯ | 2.56 ± 0.10 | 1.50 ± 0.02 | ⋯ | ⋯ | 2.37 ± 0.12 |
| 2007P | 61.34 ± 1.19 | 88.34 ± 5.83 | 27.00 ± 5.14 | −17.96 ± 0.05 | −16.75 ± 0.05 | ⋯ | 3.80 ± 0.16 | 1.40 ± 0.12 | ⋯ | ⋯ | 2.26 ± 0.38 |
| 2007sq | 44.66 ± 2.39 | 87.66 ± 5.00 | 43.00 ± 6.46 | −15.33 ± 0.13 | −14.52 ± 0.13 | ⋯ | 2.52 ± 0.37 | 1.29 ± 0.08 | ⋯ | ⋯ | ⋯ |
| 2007U | ⋯ | ⋯ | ⋯ | −17.87 ± 0.08 | −16.78 ± 0.08 | ⋯ | ⋯ | 2.27 ± 0.04 | ⋯ | ⋯ | 2.63 ± 0.35 |
| 2007W | 56.71 ± 2.57 | 83.59 ± 7.62 | 26.88 ± 7.46 | −15.80 ± 0.20 | −15.34 ± 0.20 | ⋯ | 0.83 ± 0.27 | 0.00 ± 0.04 | ⋯ | ⋯ | 2.39 ± 0.28 |
| 2007X | 53.92 ± 1.03 | 98.06 ± 5.83 | 44.14 ± 5.14 | −17.84 ± 0.21 | −16.70 ± 0.21 | ⋯ | 2.52 ± 0.07 | 1.37 ± 0.03 | ⋯ | ⋯ | 3.55 ± 0.15 |
| 2008ag | ⋯ | 105.3 ± 6.71 | ⋯ | −16.96 ± 0.15 | −16.66 ± 0.15 | ⋯ | ⋯ | 0.12 ± 0.01 | ⋯ | ⋯ | ⋯ |
| 2008aw | 37.91 ± 0.91 | 75.82 ± 10.44 | 37.91 ± 10.04 | −17.71 ± 0.19 | −16.60 ± 0.19 | −14.04 ± 0.19 | 3.27 ± 0.08 | 2.10 ± 0.05 | 1.97 ± 0.09 | >0.050 | 2.85 ± 0.16 |
| 2008bh | ⋯ | ⋯ | 20.68 ± 5.34 | −16.06 ± 0.14 | −15.11 ± 0.14 | ⋯ | 2.69 ± 0.23 | 1.20 ± 0.04 | ⋯ | ⋯ | 2.17 ± 0.38 |
| 2008bk | ⋯ | 107.22 ± 6.71 | ⋯ | −14.86 ± 0.05 | −14.59 ± 0.05 | −11.98 ± 0.05 | ⋯ | 0.26 ± 0.01 | 1.18 ± 0.02 |

|
⋯ |
| 2008bm | ⋯ | 87.04 ± 26.17 | ⋯ | −18.12 ± 0.07 | −16.32 ± 0.07 | −12.67 ± 0.07 | ⋯ | 2.50 ± 0.03 | ⋯ | >0.014 | ⋯ |
| 2008bp | ⋯ | 58.57 ± 9.49 | ⋯ | −14.00 ± 0.21 | −13.13 ± 0.21 | ⋯ | ⋯ | 2.79 ± 0.13 | ⋯ | ⋯ | 1.79 ± 0.42 |
| 2008br | ⋯ | ⋯ | ⋯ | −15.30 ± 0.20 | −14.94 ± 0.20 | ⋯ | ⋯ | 0.38 ± 0.04 | ⋯ | >0.026 | 2.19 ± 0.22 |
| 2008bu | ⋯ | 44.73 ± 7.62 | ⋯ | −17.14 ± 0.10 | −16.74 ± 0.10 | −13.71 ± 0.10 | ⋯ | 2.37 ± 0.18 | 2.69 ± 0.52 | >0.020 | 2.98 ± 0.37 |
| 2008ga | ⋯ | 73.14 ± 5.00 | ⋯ | −16.45 ± 0.14 | −16.20 ± 0.14 | ⋯ | ⋯ | 1.10 ± 0.07 | ⋯ | ⋯ | ⋯ |
| 2008gi | ⋯ | ⋯ | ⋯ | −17.31 ± 0.09 | −15.86 ± 0.09 | ⋯ | ⋯ | 2.63 ± 0.11 | ⋯ | ⋯ | 2.55 ± 1.35 |
| 2008gr | ⋯ | ⋯ | 9.00 ± 6.17 | −17.95 ± 0.10 | −16.43 ± 0.10 | ⋯ | 2.22 ± 0.13 | 1.61 ± 0.03 | ⋯ | ⋯ | 2.46 ± 0.11 |
| 2008H | ⋯ | ⋯ | ⋯ | ⋯ | ⋯ | ⋯ | ⋯ | ⋯ | ⋯ | ⋯ | ⋯ |
| 2008hg | ⋯ | ⋯ | ⋯ | −15.43 ± 0.12 | −15.59 ± 0.12 | ⋯ | ⋯ | −0.35 ± 0.08 | ⋯ | ⋯ | 3.25 ± 0.32 |
| 2008ho | ⋯ | ⋯ | ⋯ | −15.11 ± 0.23 | −15.03 ± 0.23 | ⋯ | ⋯ | 0.32 ± 0.07 | ⋯ | ⋯ | 2.39 ± 0.19 |
| 2008if | 51.04 ± 0.29 | 75.85 ± 5.83 | 24.81 ± 5.01 | −17.94 ± 0.17 | −16.79 ± 0.17 | −14.46 ± 0.17 | 4.15 ± 0.07 | 1.99 ± 0.02 | ⋯ | >0.063 | 1.76 ± 0.22 |
| 2008il | ⋯ | ⋯ | ⋯ | −16.61 ± 0.11 | −16.22 ± 0.11 | ⋯ | ⋯ | 0.71 ± 0.05 | ⋯ | ⋯ | 2.39 ± 0.15 |
| 2008in | ⋯ | 89.64 ± 6.71 | ⋯ | −15.40 ± 0.47 | −14.79 ± 0.47 | ⋯ | ⋯ | 0.91 ± 0.01 | ⋯ | ⋯ | 3.01 ± 0.13 |
| 2008K | ⋯ | 89.32 ± 5.00 | ⋯ | −17.45 ± 0.08 | −16.04 ± 0.08 | −13.40 ± 0.08 | ⋯ | 2.66 ± 0.02 | 2.07 ± 0.26 | >0.013 | 2.61 ± 0.84 |
| 2008M | 58.27 ± 0.27 | 75.35 ± 9.49 | 17.08 ± 9.00 | −16.75 ± 0.28 | −16.17 ± 0.28 | −13.41 ± 0.28 | 5.15 ± 0.27 | 0.94 ± 0.02 | 1.18 ± 0.26 |

|
1.79 ± 0.18 |
| 2008W | ⋯ | 85.84 ± 6.71 | ⋯ | −16.60 ± 0.11 | −16.05 ± 0.11 | ⋯ | ⋯ | 1.10 ± 0.04 | ⋯ | ⋯ | ⋯ |
| 2009aj | ⋯ | ⋯ | ⋯ | −18.07 ± 0.20 | −16.85 ± 0.20 | ⋯ | ⋯ | ⋯ | ⋯ | ⋯ | ⋯ |
| 2009ao | ⋯ | 41.68 ± 5.00 | ⋯ | −15.79 ± 0.20 | −15.78 ± 0.20 | ⋯ | ⋯ | −0.01 ± 0.12 | ⋯ | ⋯ | 1.75 ± 0.29 |
| 2009au | ⋯ | ⋯ | ⋯ | −16.34 ± 0.21 | −14.69 ± 0.21 | ⋯ | ⋯ | 3.03 ± 0.02 | ⋯ | ⋯ | 2.04 ± 0.31 |
| 2009bu | ⋯ | ⋯ | 37.35 ± 8.23 | −16.05 ± 0.19 | −15.87 ± 0.19 | ⋯ | 0.91 ± 0.14 | 0.13 ± 0.04 | ⋯ | ⋯ | ⋯ |
| 2009bz | ⋯ | ⋯ | ⋯ | −16.46 ± 0.19 | −16.26 ± 0.19 | ⋯ | ⋯ | 0.36 ± 0.03 | ⋯ | ⋯ | 2.14 ± 0.15 |
| 2009N | 66.73 ± 0.48 | 89.79 ± 5.83 | 23.06 ± 5.02 | −15.25 ± 0.40 | −14.90 ± 0.40 | ⋯ | 2.00 ± 0.29 | 0.22 ± 0.01 | ⋯ | ⋯ | 3.50 ± 0.06 |
Note. Same as Anderson et al. (2014b). In the first column, we list the SN name. Columns 2, 3, and 4 show the Pd, OPTd, and Cd. In columns 5, 6, and 7, we list the absolute magnitudes of Mmax, Mend, and Mtail respectively. These are followed by the decline rates: s1, s2, and s3, in columns 8, 9, and 10, respectively. In column 11, we present the derived 56Ni masses (or lower limits), while in column 12 the color gradient is shown. As is explained in Section 3, the Pd, s1, and s2 show differences with respect to Anderson et al. (2014b).
Besides the parameters defined by A14, we include two more parameters.
- 1. is defined as the color gradient. We measure this parameter in three different ranges: d, d, and d. Color gradients are calculated by fitting a low order polynomial to color curves and then taking the color from the fit at each epoch and calculating the gradient, by simply subtracting one epoch color from the other and dividing by the number of days of the interval.
- 2.Cd corresponds to the cooling phase durations (Cd), defined between t0 and ttran.


Figure 1 presents an example light curve, indicating all the above defined V-band parameters.
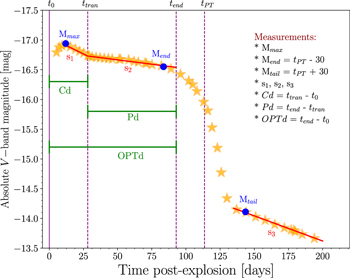
Figure 1. Example of the light-curve parameters measured for each SN within the sample in the V band. Observed absolute magnitude at peak, Mmax, Mend, and Mtail are shown in blue, as applied to the dummy data points (yellow stars) of an SN II. The positions of the three measured slopes, s1, s2, and s3, are shown in red. The cooling duration (Cd), plateau duration (Pd), and optically thick phase duration (OPTd), are indicated in green. Four time epochs are labeled: t0, the explosion epoch; ttran, the transition from s1 to s2; tend, the end of the optically thick phase; and tPT, the midpoint of the transition from plateau to radioactive tail.
Download figure:
Standard image High-resolution image4. Observed Parameters and Their Physical Implications
The basic properties of the progenitor stars and explosion that have a significant influence on SN II diversity are the explosion energy (E), ejecta mass ( ), pre-supernova radius (R0), the 56Ni mass, and progenitor metallicity (with many of these parameters likely to be directly linked to the zero age main sequence, ZAMS, mass). Theoretical works (e.g., Young 2004; Kasen & Woosley 2009; Dessart et al. 2013a) have studied how variations of these parameters influence SN II light curves and spectra. Specifically, such studies have directly linked observed parameters such as luminosities, expansion velocities, and the duration of the plateau to the above physical progenitor properties.
The most commonly used parameter to link observed SN properties to progenitor characteristics has been the duration of the plateau. It has been associated to the hydrogen envelope mass of the progenitor at the moment of the explosion. Theoretical models (e.g., Litvinova & Nadezhin 1983; Popov 1993; Dessart et al. 2010a; Morozova et al. 2015; Moriya et al. 2016) have shown that the plateau duration is a good indicator of the hydrogen envelope mass in the direction that larger envelope masses produce longer duration plateaus. This can be understood as the hydrogen recombination wave taking a longer time to travel back through the ionized ejecta in SNe with a larger hydrogen envelope. Traditionally, authors have referred to the "plateau duration" as the time from explosion to the epoch when each SN starts to transition to the nebular phase. However, such a definition then includes phases that are powered by different physical mechanisms (early-time light curves are powered by the release of shock deposited energy, while later phases during the true plateau are powered by hydrogen recombination (e.g., Grassberg et al. 1971; Chevalier 1976; Falk & Arnett 1977). In A14, two time durations were defined: OPTd, the optically thick phase duration, and Pd the plateau duration. The former is equivalent to the traditional definition of the plateau duration from explosion to the end of the plateau, while the latter is defined from the inflection point in the s1 and s2 decline rates to the end of the plateau. The newly defined Pd value should thus more accurately scale with hydrogen envelope mass, while OPTd includes both effects of changing the envelope mass together with radius differences affecting the time taken for the light curve to reach the hydrogen recombination powered s2 decline rate. Later, we provide additional evidence and arguments for this interpretation: overall correlations are stronger between Pd and other SN II measurements (particularly those other parameters linked to the envelope mass) than OPTd.
In addition to Pd, it was argued in A14 that decline rates during the radioactive phase, s3, can also give an indication of the ejecta mass. The expected s3 decline rate is 0.98 mag per 100 days assuming full trapping of the radioactive emission from 56Co decay (Woosley et al. 1989).
The expansion velocity and luminosity of SNe II are both set by the explosion energy (Kasen & Woosley 2009 and Bersten 2013): more energetic explosions produce higher photospheric velocities, and in turn, brighter events. These results have been shown observationally by Hamuy & Pinto (2002) and Hamuy (2003).
More recently, Dessart et al. (2010b) and Dessart et al. (2013a) showed that in SNe with small progenitor radii, the recombination phase starts earlier. This would imply that the phase between the explosion and ttran (cooling duration phase, Cd) is shorter in these SNe. Hence, we may expect a relation between Cd and progenitor radius. Moreover, Morozova et al. (2016) found that the early properties of the light curve are sensitive to the progenitor radius, which implies that the rise time has a relation with the radius at the time of the explosion. González-Gaitán et al. (2015) using a large sample of observed SNe II, concluded that SNe II progenitor radii are relatively small. We note, however, the recent results of Yaron et al. (2017), Morozova et al. (2017), Moriya et al. (2017), and Dessart et al. (2017). These investigations have provided evidence for and shown the effect of previously unaccounted for material close to the progenitor star. The interaction of the SN ejecta with such material may thus complicate the relation between early-time observations and progenitor radius.
In summary, we expect that the hydrogen envelope mass is directly related with Pd, s3; the explosion energy with the expansion velocities (vel), and the luminosities (Mmax, Mend); and the radius of the progenitor would have some influence in Cd.
5. Results
In this section, we investigate the spectral and photometric diversity of SNe II through correlations. Here we present the statistics of these correlations and their respective figures. As stated above, the spectral measurements were performed in the phases where the data were available; however, to characterize this diversity, the analysis is done at 30, 50, and 80 days with respect to the explosion epoch. In Table 2, we can see the average of the correlations for each parameter at 30, 50, and 80 days. The mean of these correlations shows a value of 0.323, 0.364, and 0.356 for each epoch, thus the following analysis is performed at 50 days, where more spectral measurements are available and the mean is higher. In Tables 3 and 4, the measured spectral parameters at 50 days are listed, while in Table 1 we present the photometric parameters.
Table 2. Average of Correlations
| Parameter | Average at 30 Days | Average at 50 Days | Average at 80 Days |
|---|---|---|---|
| Pd | 0.370 | 0.410 | 0.425 |
| OPTd | 0.305 | 0.316 | 0.342 |
| Cd | 0.225 | 0.228 | 0.233 |
| Mmax | 0.392 | 0.417 | 0.375 |
| Mend | 0.325 | 0.345 | 0.343 |
| Mtail | 0.406 | 0.423 | 0.456 |
| s1 | 0.355 | 0.391 | 0.344 |
| s2 | 0.304 | 0.348 | 0.325 |
| s3 | 0.334 | 0.374 | 0.363 |
| 56Ni | 0.449 | 0.520 | 0.550 |

|
0.208 | 0.219 | 0.213 |
V( ) ) |
0.361 | 0.468 | 0.452 |
V( ) ) |
0.416 | 0.479 | 0.441 |
| V(Fe ii 5018) | 0.380 | 0.450 | 0.325 |
| V(Fe ii 5169) | 0.415 | 0.477 | 0.393 |
| V(Na i D) | 0.450 | 0.519 | 0.480 |
pEW(
|
0.279 | 0.270 | 0.287 |
pEW(
|
0.138 | 0.362 | 0.427 |
| pEW(Fe ii 5018) | 0.329 | 0.339 | 0.218 |
| pEW(Fe ii 5169) | 0.167 | 0.209 | 0.189 |
| pEW(Na i D) | 0.238 | 0.242 | 0.354 |
| a/e | 0.269 | 0.328 | 0.316 |
 ( ( –Fe ii 5018) –Fe ii 5018) |
0.303 | 0.321 | 0.438 |
 (Na i D—Fe ii 5018) (Na i D—Fe ii 5018) |
0.403 | 0.426 | 0.419 |
 ( ( ) ) |
0.248 | 0.228 | 0.207 |
Note. Average of the correlations at 30, 50, and 80 days since explosion presented for 11 photometric parameters and 14 spectroscopic ones. In the first column, the SN II parameter is listed (described in 3), while in the second, third, and fourth columns are the averages.
Download table as: ASCIITypeset image
Table 3. Velocity Values at 50 Days from Explosion
| SN | vel( ) ) |
vel( ) ) |
vel( ) ) |
vel(Fe | vel(Fe ii | vel(Fe ii | vel(Fe ii | vel(Sc ii | vel(Na i D) | vel(Ba ii) | vel(Sc ii) | vel(O i) |
|---|---|---|---|---|---|---|---|---|---|---|---|---|
| II λ4924) | λ5018) | λ5169) | /Sc ii) | Mult.) | ||||||||
| (km s−1) | (km s−1) | (km s−1) | (km s−1) | (km s−1) | (km s−1) | (km s−1) | (km s−1) | (km s−1) | (km s−1) | (km s−1) | (km s−1) | |
| 1986L | 7707 ± 710 | 6204 ± 476 | 6722 ± 434 | 4946 ± 245 | 4311 ± 672 | 4406 ± 411 | 4778 ± 456 | 4316 ± 336 | 5512 ± 486 | ⋯ | ⋯ | ⋯ |
| 1990K | 7841 ± 432 | 6958 ± 426 | 6563 ± 381 | ⋯ | 4440 ± 298 | 3942 ± 204 | 4886 ± 450 | 4604 ± 239 | 6363 ± 391 | 4468 ± 312 | 4139 ± 238 | ⋯ |
| 1991al | 8897 ± 496 | 7950 ± 615 | 7789 ± 634 | 4921 ± 244 | 4790 ± 588 | 4982 ± 548 | 5256 ± 261 | 4575 ± 227 | 7835 ± 876 | 5696 ± 282 | 4149 ± 206 | ⋯ |
| 1992af | ⋯ | ⋯ | ⋯ | ⋯ | ⋯ | ⋯ | ⋯ | ⋯ | ⋯ | ⋯ | ⋯ | ⋯ |
| 1992ba | 6276 ± 665 | 4559 ± 439 | 5100 ± 374 | 3160 ± 157 | 3388 ± 487 | 3464 ± 483 | 3479 ± 173 | 3322 ± 165 | 4325 ± 847 | 3042 ± 151 | 3060 ± 152 | ⋯ |
| 1993K | 7099 ± 551 | 7151 ± 358 | 6326 ± 444 | 4903 ± 269 | 3536 ± 490 | 4390 ± 218 | 4479 ± 222 | 3767 ± 270 | 5488 ± 520 | 3998 ± 199 | 4053 ± 420 | 4500 ± 466 |
| 1993S | 7800 ± 630 | 6132 ± 620 | 6886 ± 670 | 3269 ± 340 | 4822 ± 470 | 4943 ± 300 | ⋯ | ⋯ | 6071 ± 620 | ⋯ | ⋯ | ⋯ |
| 1999br | 3611 ± 588 | 3082 ± 265 | 3191 ± 243 | 1511 ± 258 | 1753 ± 223 | 1746 ± 305 | 2101 ± 272 | 1527 ± 443 | 1519 ± 759 | 1229 ± 61 | 1891 ± 94 | 1100 ± 100 |
| 1999ca | 7375 ± 348 | 7039 ± 364 | 6840 ± 338 | ⋯ | 5618 ± 278 | 5191 ± 257 | 6103 ± 302 | 5727 ± 284 | 6825 ± 337 | 5833 ± 289 | 5043 ± 250 | ⋯ |
| 1999cr | 5960 ± 361 | 5477 ± 323 | 4932 ± 478 | ⋯ | 3495 ± 195 | 3655 ± 212 | ⋯ | 3909 ± 194 | 4504 ± 224 | ⋯ | ⋯ | ⋯ |
| 1999em | 6025 ± 622 | 5591 ± 595 | 5709 ± 626 | 3768 ± 187 | 3337 ± 394 | 3464 ± 365 | 3383 ± 168 | 2992 ± 149 | 3722 ± 451 | 3048 ± 152 | 3107 ± 154 | ⋯ |
| S0210 | 7955 ± 492 | 8197 ± 762 | 7050 ± 619 | ⋯ | 6846 ± 424 | 4998 ± 326 | 6276 ± 311 | 5374 ± 550 | 6810 ± 455 | ⋯ | ⋯ | ⋯ |
| 2002fa | 7649 ± 649 | 6184 ± 435 | 6359 ± 410 | 3567 ± 268 | 3832 ± 337 | 4133 ± 260 | 4163 ± 207 | 3603 ± 179 | 5741 ± 663 | ⋯ | ⋯ | ⋯ |
| 2002gd | 4138 ± 563 | 3717 ± 266 | 3414 ± 703 | 2257 ± 196 | 2730 ± 204 | 2448 ± 236 | 3165 ± 297 | 3005 ± 409 | 3406 ± 273 | 2105 ± 177 | 2414 ± 325 | 1870 ± 200 |
| 2002gw | 6674 ± 474 | 5454 ± 487 | 5299 ± 518 | 3253 ± 329 | 3295 ± 494 | 3623 ± 357 | 3221 ± 345 | 3233 ± 247 | 3889 ± 304 | 3036 ± 211 | 2976 ± 185 | 3120 ± 325 |
| 2002hj | 7933 ± 661 | 6540 ± 532 | 6447 ± 451 | 3432 ± 579 | 3787 ± 338 | 4192 ± 405 | 4645 ± 230 | 3592 ± 220 | 5239 ± 345 | ⋯ | ⋯ | 4080 ± 420 |
| 2002hx | 8070 ± 434 | 5722 ± 504 | 6455 ± 554 | 3255 ± 337 | 3506 ± 215 | 3806 ± 284 | 3021 ± 157 | 3623 ± 200 | 5408 ± 477 | 2532 ± 160 | 3213 ± 302 | ⋯ |
| 2002ig | ⋯ | ⋯ | ⋯ | ⋯ | ⋯ | ⋯ | ⋯ | ⋯ | ⋯ | ⋯ | ⋯ | ⋯ |
| 2003B | 6256 ± 339 | 4604 ± 622 | 5524 ± 478 | 3204 ± 575 | 3458 ± 297 | 3509 ± 251 | 3643 ± 260 | 3523 ± 307 | 4051 ± 228 | 3343 ± 265 | 3121 ± 188 | 2970 ± 270 |
| 2003bl | 3958 ± 481 | 3679 ± 435 | 3849 ± 326 | 4297 ± 255 | 2342 ± 213 | 2093 ± 190 | 2451 ± 263 | 2456 ± 207 | 2712 ± 582 | 2780 ± 426 | 2265 ± 184 | ⋯ |
| 2003bn | 6892 ± 638 | 5887 ± 545 | 5688 ± 471 | 3639 ± 265 | 3611 ± 607 | 3612 ± 530 | 3457 ± 302 | 3254 ± 327 | 4077 ± 397 | 3296 ± 300 | 3134 ± 178 | 3000 ± 280 |
| 2003ci | 7219 ± 280 | 5648 ± 357 | 5916 ± 293 | 3007 ± 150 | 3832 ± 190 | 3677 ± 183 | 4761 ± 236 | 4449 ± 483 | 5907 ± 292 | 3142 ± 156 | 4254 ± 211 | ⋯ |
| 2003cn | 5409 ± 293 | 4223 ± 501 | 4521 ± 946 | 2399 ± 119 | 2778 ± 138 | 2699 ± 197 | 2962 ± 147 | 2533 ± 126 | 3836 ± 695 | 2817 ± 140 | 2980 ± 148 | ⋯ |
| 2003cx | 9001 ± 870 | 5960 ± 600 | 7038 ± 720 | 4753 ± 460 | 4130 ± 400 | 4788 ± 420 | ⋯ | ⋯ | 5993 ± 610 | ⋯ | ⋯ | ⋯ |
| 2003E | ⋯ | ⋯ | ⋯ | ⋯ | ⋯ | ⋯ | ⋯ | ⋯ | ⋯ | ⋯ | ⋯ | ⋯ |
| 2003ef | 7703 ± 367 | 6416 ± 610 | 4261 ± 494 | 3930 ± 364 | 4121 ± 534 | 4116 ± 516 | 4044 ± 575 | 3738 ± 395 | 4316 ± 484 | 3582 ± 299 | 3638 ± 181 | 3750 ± 390 |
| 2003eg | 8560 ± 725 | 7619 ± 675 | 6705 ± 418 | ⋯ | 4669 ± 405 | 4727 ± 456 | 4168 ± 207 | 4235 ± 210 | 6993 ± 468 | 3100 ± 320 | 3390 ± 410 | ⋯ |
| 2003ej | 6897 ± 630 | 9181 ± 1000 | 5968 ± 600 | ⋯ | 4998 ± 480 | 4381 ± 405 | ⋯ | ⋯ | 6244 ± 600 | ⋯ | ⋯ | ⋯ |
| 2003fb | 7583 ± 561 | 6132 ± 625 | 5840 ± 854 | 3906 ± 754 | 4033 ± 738 | 3819 ± 722 | 3996 ± 704 | 3516 ± 677 | 4749 ± 668 | 4319 ± 649 | 3430 ± 627 | ⋯ |
| 2003gd | ⋯ | ⋯ | ⋯ | ⋯ | ⋯ | ⋯ | ⋯ | ⋯ | ⋯ | ⋯ | ⋯ | ⋯ |
| 2003hd | 7850 ± 519 | 6809 ± 539 | 5960 ± 717 | 3864 ± 192 | 3956 ± 260 | 4025 ± 289 | 3779 ± 188 | 3393 ± 169 | 4725 ± 234 | ⋯ | ⋯ | ⋯ |
| 2003hg | ⋯ | ⋯ | ⋯ | ⋯ | ⋯ | ⋯ | ⋯ | ⋯ | ⋯ | ⋯ | ⋯ | 4090 ± 420 |
| 2003hk | 6622 ± 349 | 7062 ± 328 | 5682 ± 281 | 4053 ± 201 | 4144 ± 206 | 4161 ± 207 | ⋯ | ⋯ | 5767 ± 286 | ⋯ | ⋯ | ⋯ |
| 2003hl | 6579 ± 738 | 5623 ± 462 | 4550 ± 439 | 3961 ± 382 | 3899 ± 287 | 3819 ± 402 | 3787 ± 329 | 3783 ± 283 | 4527 ± 318 | 3276 ± 252 | 3501 ± 244 | 3570 ± 368 |
| 2003hn | 7016 ± 387 | 6594 ± 462 | 5336 ± 442 | 3455 ± 281 | 3425 ± 249 | 3484 ± 379 | 3466 ± 286 | 3148 ± 293 | 4470 ± 339 | 3596 ± 189 | 3039 ± 375 | 3480 ± 360 |
| 2003ho | 8312 ± 755 | 7459 ± 520 | 6102 ± 302 | 3463 ± 172 | 3739 ± 186 | 3989 ± 198 | 4309 ± 214 | 3969 ± 197 | 5010 ± 248 | ⋯ | ⋯ | 3970 ± 410 |
| 2003ib | ⋯ | ⋯ | ⋯ | ⋯ | ⋯ | ⋯ | ⋯ | ⋯ | ⋯ | ⋯ | ⋯ | ⋯ |
| 2003ip | 8629 ± 486 | 8059 ± 533 | 6813 ± 388 | ⋯ | 5391 ± 341 | 4536 ± 309 | 5773 ± 286 | 5058 ± 251 | 6501 ± 413 | 4858 ± 241 | 5337 ± 264 | 6100 ± 600 |
| 2003iq | 7483 ± 741 | 5953 ± 386 | 5483 ± 350 | 4254 ± 211 | 4213 ± 225 | 4329 ± 216 | 4171 ± 207 | 3935 ± 195 | 5123 ± 360 | 3743 ± 186 | 3920 ± 195 | 3950 ± 330 |
| 2003T | 6954 ± 403 | 5994 ± 634 | 4039 ± 226 | 3967 ± 341 | 3807 ± 218 | 3896 ± 276 | 3777 ± 190 | 3390 ± 222 | 3996 ± 292 | 4223 ± 257 | 4039 ± 240 | ⋯ |
| 2004ej | 635 ± 501 | 5522 ± 429 | 5389 ± 600 | 3535 ± 505 | 3440 ± 307 | 3301 ± 221 | 3556 ± 536 | 3291 ± 319 | 4005 ± 326 | 2880 ± 191 | 3178 ± 223 | 3380 ± 350 |
| 2004er | 965 ± 582 | 8323 ± 549 | 7878 ± 600 | 6040 ± 427 | 5396 ± 386 | 5219 ± 436 | 5501 ± 311 | 3372 ± 470 | 5771 ± 506 | 5284 ± 634 | 5306 ± 475 | 5065 ± 520 |
| 2004fb | 769 ± 636 | 6678 ± 444 | 5884 ± 435 | 3926 ± 283 | 4228 ± 425 | 4178 ± 300 | 4368 ± 217 | 3750 ± 186 | 4798 ± 340 | 5254 ± 261 | 3805 ± 410 | ⋯ |
| 2004fc | 633 ± 645 | 5639 ± 976 | 4056 ± 329 | 3690 ± 236 | 3675 ± 291 | 3581 ± 256 | 3760 ± 270 | 3591 ± 261 | 4194 ± 541 | 3195 ± 229 | 3386 ± 266 | 3319 ± 325 |
| 2004fx | 572 ± 525 | 4856 ± 446 | 4194 ± 318 | 2385 ± 206 | 2700 ± 209 | 2786 ± 401 | 3002 ± 177 | 3386 ± 168 | 2884 ± 389 | 3180 ± 158 | 2459 ± 133 | 2300 ± 210 |
| 2005af | ⋯ | ⋯ | ⋯ | ⋯ | ⋯ | ⋯ | ⋯ | ⋯ | ⋯ | ⋯ | ⋯ | ⋯ |
| 2005an | 7656 ± 888 | 8325 ± 494 | 5346 ± 1497 | 4356 ± 219 | 4333 ± 325 | 4011 ± 303 | 4753 ± 289 | 4551 ± 293 | 4738 ± 560 | ⋯ | ⋯ | 4580 ± 470 |
| 2005dk | 7926 ± 531 | 6887 ± 470 | 6883 ± 359 | 4541 ± 312 | 4535 ± 289 | 4603 ± 306 | 4418 ± 311 | 3937 ± 329 | 6317 ± 709 | 5112 ± 457 | 4039 ± 256 | 4420 ± 420 |
| 2005dn | 9500 ± 672 | 8420 ± 576 | 7613 ± 484 | 2360 ± 118 | 5750 ± 1511 | 4712 ± 434 | ⋯ | 4857 ± 241 | 6518 ± 627 | ⋯ | ⋯ | ⋯ |
| 2005dt | ⋯ | ⋯ | ⋯ | ⋯ | ⋯ | ⋯ | ⋯ | ⋯ | ⋯ | ⋯ | ⋯ | ⋯ |
| 2005dx | ⋯ | ⋯ | ⋯ | ⋯ | ⋯ | ⋯ | ⋯ | ⋯ | ⋯ | ⋯ | ⋯ | ⋯ |
| 2005dz | 7591 ± 595 | 6182 ± 434 | 5934 ± 430 | 925 ± 88 | 3927 ± 499 | 4101 ± 310 | ⋯ | ⋯ | 7397 ± 735 | ⋯ | ⋯ | ⋯ |
| 2005J | 8434 ± 755 | 6353 ± 668 | 6380 ± 404 | 4235 ± 273 | 4129 ± 406 | 4224 ± 437 | 4151 ± 402 | 4190 ± 265 | 4994 ± 386 | 4097 ± 297 | 4581 ± 272 | 4500 ± 460 |
| 2005lw | ⋯ | ⋯ | ⋯ | ⋯ | ⋯ | ⋯ | ⋯ | ⋯ | ⋯ | ⋯ | ⋯ | ⋯ |
| 2005Z | 9479 ± 661 | 8538 ± 582 | 7879 ± 843 | 5673 ± 281 | 5646 ± 384 | 5196 ± 411 | 5633 ± 489 | 5435 ± 359 | 7375 ± 560 | 6432 ± 655 | 4671 ± 480 | 6040 ± 640 |
| 2006ai | 7480 ± 821 | 6949 ± 559 | 6301 ± 560 | 4135 ± 353 | 4424 ± 427 | 4623 ± 340 | 4396 ± 258 | 3379 ± 526 | 6184 ± 434 | ⋯ | ⋯ | 6750 ± 710 |
| 2006be | 7441 ± 474 | 6360 ± 625 | 5868 ± 755 | 3760 ± 742 | 3682 ± 738 | 3690 ± 722 | 3870 ± 694 | 3305 ± 677 | 4431 ± 668 | 4921 ± 620 | ⋯ | ⋯ |
| 2006bl | ⋯ | ⋯ | ⋯ | ⋯ | ⋯ | ⋯ | ⋯ | ⋯ | ⋯ | ⋯ | ⋯ | ⋯ |
| 2006ee | 5209 ± 426 | 5370 ± 675 | 3020 ± 619 | 3213 ± 254 | 3125 ± 194 | 3024 ± 255 | 3101 ± 299 | 2708 ± 316 | 3239 ± 267 | 2734 ± 262 | 2738 ± 202 | ⋯ |
| 2006it | ⋯ | ⋯ | ⋯ | ⋯ | ⋯ | ⋯ | ⋯ | ⋯ | ⋯ | ⋯ | ⋯ | ⋯ |
| 2006iw | 7373 ± 671 | 6104 ± 566 | 5337 ± 694 | 4352 ± 687 | 4127 ± 678 | 4148 ± 722 | 3790 ± 688 | 3352 ± 682 | 5074 ± 724 | ⋯ | ⋯ | ⋯ |
| 2006ms | ⋯ | ⋯ | ⋯ | ⋯ | ⋯ | ⋯ | ⋯ | ⋯ | ⋯ | ⋯ | ⋯ | ⋯ |
| 2006qr | 6501 ± 419 | 5558 ± 487 | 5103 ± 285 | 3166 ± 872 | 3593 ± 221 | 3643 ± 200 | 3780 ± 188 | 3529 ± 175 | 4844 ± 554 | 3795 ± 188 | 2932 ± 146 | ⋯ |
| 2006Y | 9007 ± 619 | 7770 ± 589 | 6958 ± 464 | 3748 ± 186 | 4946 ± 731 | 5076 ± 546 | ⋯ | ⋯ | 7004 ± 613 | ⋯ | ⋯ | ⋯ |
| 2007aa | 5985 ± 539 | 5102 ± 550 | 4264 ± 374 | 3148 ± 398 | 3179 ± 378 | 3148 ± 396 | 3099 ± 324 | 2880 ± 266 | 3864 ± 321 | 2697 ± 187 | 2907 ± 267 | 2650 ± 300 |
| 2007ab | 9768 ± 505 | 8495 ± 600 | 8205 ± 405 | ⋯ | 7140 ± 353 | 4776 ± 237 | 6957 ± 344 | 6418 ± 318 | 7285 ± 404 | 6743 ± 337 | 5949 ± 614 | ⋯ |
| 2007av | 7234 ± 338 | 6065 ± 402 | 5366 ± 311 | 3664 ± 182 | 3874 ± 192 | 3847 ± 191 | 3847 ± 191 | 3714 ± 185 | 3957 ± 605 | 3662 ± 182 | 3452 ± 172 | 3240 ± 299 |
| 2007bf | 5498 ± 580 | 3830 ± 410 | 4110 ± 420 | ⋯ | ⋯ | ⋯ | ⋯ | ⋯ | ⋯ | ⋯ | ⋯ | ⋯ |
| 2007hm | 8237 ± 383 | 6197 ± 544 | 6404 ± 432 | 4289 ± 213 | 4039 ± 201 | 4403 ± 515 | 4835 ± 240 | 3341 ± 166 | 5278 ± 262 | ⋯ | ⋯ | ⋯ |
| 2007il | 8022 ± 809 | 7390 ± 482 | 5916 ± 505 | 4220 ± 281 | 4100 ± 481 | 4282 ± 383 | 4017 ± 370 | 4493 ± 420 | 4798 ± 769 | 5544 ± 560 | 2709 ± 250 | ⋯ |
| 2007it | ⋯ | ⋯ | ⋯ | ⋯ | ⋯ | ⋯ | ⋯ | ⋯ | ⋯ | ⋯ | ⋯ | ⋯ |
| 2007ld | 7176 ± 700 | 11416 ± 990 | 6024 ± 580 | ⋯ | 3695 ± 350 | 3589 ± 350 | ⋯ | ⋯ | 5922 ± 600 | ⋯ | ⋯ | ⋯ |
| 2007oc | 6749 ± 492 | 7072 ± 435 | 5239 ± 436 | 2274 ± 198 | 3281 ± 315 | 3694 ± 343 | 4188 ± 480 | 3859 ± 378 | 5019 ± 450 | 2887 ± 218 | 3266 ± 291 | 4700 ± 500 |
| 2007od | 7171 ± 655 | 7163 ± 428 | 6698 ± 545 | ⋯ | 5188 ± 363 | 3863 ± 300 | ⋯ | 3876 ± 193 | 6202 ± 427 | 5100 ± 525 | 4846 ± 240 | ⋯ |
| 2007P | ⋯ | ⋯ | ⋯ | ⋯ | ⋯ | ⋯ | ⋯ | ⋯ | ⋯ | ⋯ | ⋯ | ⋯ |
| 2007sq | 8298 ± 943 | 8409 ± 437 | 7410 ± 366 | 5270 ± 390 | 5249 ± 260 | 5350 ± 265 | 4978 ± 247 | 4135 ± 205 | 5662 ± 280 | ⋯ | ⋯ | 44780 ± 430 |
| 2007U | 8037 ± 837 | 7395 ± 516 | 6911 ± 721 | ⋯ | 5541 ± 274 | 5439 ± 550 | 5923 ± 293 | 5429 ± 269 | 6480 ± 340 | ⋯ | ⋯ | ⋯ |
| 2007W | 4754 ± 935 | 4125 ± 558 | 3203 ± 269 | 2343 ± 182 | 2612 ± 337 | 2437 ± 454 | 2543 ± 156 | 2505 ± 164 | 2618 ± 186 | 2086 ± 104 | 2485 ± 124 | 2000 ± 195 |
| 2007X | 8597 ± 675 | 8418 ± 537 | 6685 ± 601 | ⋯ | 5466 ± 383 | 4619 ± 762 | 6339 ± 399 | 5555 ± 354 | 6170 ± 708 | 5160 ± 427 | 5021 ± 496 | 5980 ± 610 |
| 2008ag | 6906 ± 463 | 6284 ± 426 | 4583 ± 473 | 4045 ± 292 | 3951 ± 324 | 3939 ± 311 | 3862 ± 326 | 3521 ± 283 | 4215 ± 426 | 3223 ± 230 | 3499 ± 233 | 3460 ± 330 |
| 2008aw | 8257 ± 621 | 7783 ± 911 | 6641 ± 530 | 4728 ± 376 | 4724 ± 526 | 4532 ± 654 | 5027 ± 458 | 4429 ± 372 | 6436 ± 478 | 4545 ± 394 | 4458 ± 271 | ⋯ |
| 2008bh | 7824 ± 688 | 7263 ± 430 | 6297 ± 375 | 4236 ± 210 | 4339 ± 232 | 4189 ± 637 | 4327 ± 215 | 4180 ± 207 | 4683 ± 378 | 4466 ± 222 | 3990 ± 198 | ⋯ |
| 2008bk | 4115 ± 390 | 3313 ± 707 | 2401 ± 224 | 1867 ± 133 | 2256 ± 153 | 2910 ± 460 | 2266 ± 276 | 2437 ± 310 | 2019 ± 171 | 1846 ± 137 | 1998 ± 180 | 1780 ± 194 |
| 2008bm | 1765 ± 56 | 11118 ± 88 | 1385 ± 69 | 1559 ± 78 | 1649 ± 82 | 1277 ± 64 | ⋯ | ⋯ | 1762 ± 88 | ⋯ | ⋯ | ⋯ |
| 2008bp | 6795 ± 710 | 8613 ± 830 | 7497 ± 700 | ⋯ | ⋯ | ⋯ | ⋯ | ⋯ | ⋯ | ⋯ | ⋯ | ⋯ |
| 2008br | 4070 ± 491 | 3682 ± 258 | 2484 ± 169 | 1665 ± 178 | 1832 ± 142 | 1633 ± 218 | 2161 ± 108 | 2547 ± 127 | 1922 ± 96 | 1386 ± 69 | 1670 ± 83 | 1420 ± 180 |
| 2008bu | ⋯ | ⋯ | ⋯ | ⋯ | ⋯ | ⋯ | ⋯ | ⋯ | ⋯ | ⋯ | ⋯ | ⋯ |
| 2008ga | 7313 ± 589 | 6400 ± 653 | 5357 ± 768 | 3307 ± 754 | 3390 ± 732 | 3253 ± 757 | 4665 ± 694 | 3179 ± 677 | 4785 ± 663 | ⋯ | ⋯ | ⋯ |
| 2008gi | ⋯ | ⋯ | ⋯ | ⋯ | ⋯ | ⋯ | ⋯ | ⋯ | ⋯ | ⋯ | ⋯ | ⋯ |
| 2008gr | 8832 ± 752 | 8361 ± 435 | 7548 ± 385 | ⋯ | 5412 ± 268 | 5013 ± 249 | 5918 ± 293 | 5572 ± 276 | 7487 ± 708 | ⋯ | ⋯ | ⋯ |
| 2008H | 6608 ± 790 | 6734 ± 703 | 5355 ± 941 | 3863 ± 420 | 3791 ± 360 | 3738 ± 350 | 3821 ± 400 | 3678 ± 783 | 4669 ± 760 | 3390 ± 325 | 3430 ± 410 | ⋯ |
| 2008hg | ⋯ | ⋯ | ⋯ | ⋯ | ⋯ | ⋯ | ⋯ | ⋯ | ⋯ | ⋯ | ⋯ | ⋯ |
| 2008ho | ⋯ | ⋯ | ⋯ | ⋯ | ⋯ | ⋯ | ⋯ | ⋯ | ⋯ | ⋯ | ⋯ | ⋯ |
| 2008if | 8534 ± 1126 | 8717 ± 549 | 7226 ± 642 | 3198 ± 200 | 4929 ± 298 | 4758 ± 398 | 5062 ± 272 | 4785 ± 251 | 7404 ± 633 | 3802 ± 189 | 4619 ± 234 | 4975 ± 515 |
| 2008il | ⋯ | ⋯ | ⋯ | ⋯ | ⋯ | ⋯ | ⋯ | ⋯ | ⋯ | ⋯ | ⋯ | ⋯ |
| 2008in | 4283 ± 721 | 4422 ± 768 | 3234 ± 310 | 2768 ± 259 | 2839 ± 373 | 2831 ± 455 | 2679 ± 283 | 2680 ± 251 | 2917 ± 321 | 2378 ± 203 | 2574 ± 227 | 2430 ± 266 |
| 2008K | 7885 ± 619 | 7987 ± 793 | 6868 ± 701 | ⋯ | 6197 ± 352 | 5359 ± 437 | ⋯ | 5491 ± 301 | 7066 ± 501 | ⋯ | ⋯ | ⋯ |
| 2008M | 6872 ± 862 | 6123 ± 631 | 5709 ± 474 | 3508 ± 214 | 3457 ± 345 | 3647 ± 458 | 3772 ± 271 | 3616 ± 198 | 4793 ± 1056 | 3388 ± 217 | 3507 ± 275 | 3040 ± 290 |
| 2008W | 7013 ± 665 | 6016 ± 435 | 5873 ± 435 | 3455 ± 335 | 3743 ± 233 | 3846 ± 297 | 3733 ± 224 | 3506 ± 278 | 5244 ± 470 | 3094 ± 255 | 3314 ± 185 | 3100 ± 324 |
| 2009aj | 3112 ± 455 | 2800 ± 183 | 2814 ± 470 | 2090 ± 161 | 2431 ± 197 | 2849 ± 315 | ⋯ | ⋯ | 3026 ± 240 | ⋯ | ⋯ | 200 ± 80 |
| 2009ao | 5979 ± 859 | 6753 ± 544 | 5240 ± 471 | 3792 ± 334 | 3695 ± 256 | 3597 ± 210 | 4155 ± 206 | 3770 ± 230 | 4687 ± 335 | ⋯ | 3416 ± 170 | 3120 ± 290 |
| 2009au | 2586 ± 524 | 2613 ± 215 | 1985 ± 165 | 1618 ± 113 | 1732 ± 161 | 1474 ± 175 | 1775 ± 237 | 1919 ± 296 | 1949 ± 118 | 1289 ± 64 | 1704 ± 85 | 1520 ± 130 |
| 2009bu | 7400 ± 596 | 6430 ± 521 | 5567 ± 604 | 3996 ± 267 | 3975 ± 436 | 4034 ± 456 | 4233 ± 210 | 3460 ± 172 | 4378 ± 308 | ⋯ | ⋯ | ⋯ |
| 2009bz | ⋯ | ⋯ | ⋯ | ⋯ | ⋯ | ⋯ | ⋯ | ⋯ | ⋯ | ⋯ | ⋯ | ⋯ |
| 2009N | 4514 ± 377 | 4069 ± 909 | 2815 ± 259 | 2527 ± 282 | 2651 ± 299 | 2600 ± 439 | 2549 ± 238 | 2500 ± 195 | 2705 ± 186 | 2299 ± 206 | 2397 ± 156 | 2190 ± 185 |
Note. Columns: (1) SN name; (2) velocity of  absorption component; (3) velocity of
  emission component; (4) velocity of
  (5) velocity of Fe ii λ4924; (6) velocity of Fe ii λ5018; (7) velocity of Fe ii λ5169; (8) velocity of Fe ii/Sc ii; (9) velocity of Sc ii Multiplet; (10) velocity of Na i D; (11) velocity of Ba ii; (12) velocity of Sc ii; and (13) velocity of O i.
Table 4. pEW Values at 50 Days from Explosion
| SN |

|

|

|
Fe ii λ4924 | Fe ii λ5018 | Fe ii λ5169 | Fe ii/Sc ii | Sc ii Mult. | Na i D | Ba ii | Sc ii | a/e |
|---|---|---|---|---|---|---|---|---|---|---|---|---|
| (Å) | (Å) | (Å) | (Å) | (Å) | (Å) | (Å) | (Å) | (Å) | (Å) | (Å) | ||
| 1986L | 32.8 ± 4.1 | 144.2 ± 34.2 | 48.2 ± 3.6 | 1.2 ± 0.6 | 14.7 ± 1.8 | 36.7 ± 3.8 | 7.6 ± 2.9 | 10.4 ± 2.1 | 29.2 ± 2.7 | 0.0 ± 0.0 | 0.0 ± 0.0 | 0.23 ± 0.08 |
| 1988A | ⋯ | ⋯ | ⋯ | ⋯ | ⋯ | ⋯ | ⋯ | ⋯ | ⋯ | ⋯ | ⋯ | ⋯ |
| 1990E | ⋯ | ⋯ | ⋯ | ⋯ | ⋯ | ⋯ | ⋯ | ⋯ | ⋯ | ⋯ | ⋯ | ⋯ |
| 1990K | 42.7 ± 3.8 | 206.2 ± 27.4 | 71.9 ± 4.4 | 0.0 ± 0.0 | 10.9 ± 0.7 | 38.8 ± 2.1 | 8.9 ± 0.7 | 13.2 ± 1.6 | 50.3 ± 2.5 | 6.4 ± 0.4 | 5.9 ± 0.9 | 0.21 ± 0.05 |
| 1991al | 62.1 ± 5.8 | 214.2 ± 25.8 | 67.5 ± 5.2 | 4.8 ± 1.7 | 13.0 ± 1.7 | 27.2 ± 3.8 | 4.3 ± 1.9 | 6.5 ± 1.8 | 20.4 ± 1.2 | 6.4 ± 0.9 | 4.1 ± 1.2 | 0.29 ± 0.08 |
| 1992ad | ⋯ | ⋯ | ⋯ | ⋯ | ⋯ | ⋯ | ⋯ | ⋯ | ⋯ | ⋯ | ⋯ | ⋯ |
| 1992af | ⋯ | ⋯ | ⋯ | ⋯ | ⋯ | ⋯ | ⋯ | ⋯ | ⋯ | ⋯ | ⋯ | ⋯ |
| 1992am | ⋯ | ⋯ | ⋯ | ⋯ | ⋯ | ⋯ | ⋯ | ⋯ | ⋯ | ⋯ | ⋯ | ⋯ |
| 1992ba | 61.9 ± 4.2 | 119.3 ± 19.7 | 47.0 ± 3.9 | 7.6 ± 2.5 | 20.2 ± 2.5 | 30.1 ± 3.9 | 9.9 ± 1.5 | 13.7 ± 1.7 | 34.2 ± 3.7 | 7.9 ± 1.1 | 7.1 ± 0.9 | 0.52 ± 0.15 |
| 1993A | ⋯ | ⋯ | ⋯ | ⋯ | ⋯ | ⋯ | ⋯ | ⋯ | ⋯ | ⋯ | ⋯ | ⋯ |
| 1993K | 27.8 ± 3.8 | 126.1 ± 25.3 | 42.8 ± 2.7 | 6.4 ± 2.4 | 18.9 ± 3.8 | 28.7 ± 1.9 | 5.2 ± 1.2 | 7.3 ± 1.4 | 27.1 ± 1.9 |

|
3.8 ± 1.1 | 0.22 ± 0.08 |
| 1993S | ⋯ | ⋯ | ⋯ | ⋯ | ⋯ | ⋯ | ⋯ | ⋯ | ⋯ | ⋯ | ⋯ | ⋯ |
| 1999br | 56.0 ± 3.1 | 14.6 ± 10.6 | 33.8 ± 4.8 | 15.0 ± 1.7 | 25.2 ± 1.5 | 43.1 ± 3.1 | 15.1 ± 2.9 |

|
20.7 ± 1.9 | 12.9 ± 1.6 | 14.2 ± 1.0 | 3.84 ± 3.06 |
| 1999ca | 48.3 ± 2.7 | 169.4 ± 13.6 | 78.9 ± 3.9 | 0.0 ± 0.0 | 17.6 ± 1.3 | 64.1 ± 2.9 | 11.1 ± 1.1 | 19.6 ± 1.7 | 33.7 ± 2.1 | 5.4 ± 0.4 | 11.6 ± 0.8 | 0.29 ± 0.03 |
| 1999cr | 31.7 ± 4.2 | 137.5 ± 22.9 | 37.6 ± 4.1 | 0.0 ± 0.0 | 12.4 ± 1.7 | 24.9 ± 1.8 | 0.0 ± 0.0 | 6.4 ± 1.1 | 9.3 ± 2.2 | 0.0 ± 0.0 | 0.0 ± 0.0 | 0.23 ± 0.12 |
| 1999eg | ⋯ | ⋯ | ⋯ | ⋯ | ⋯ | ⋯ | ⋯ | ⋯ | ⋯ | ⋯ | ⋯ | ⋯ |
| 1999em | 75.8 ± 5.1 | 141.2 ± 40.2 | 40.3 ± 5.6 | 9.9 ± 1.6 | 23.8 ± 1.8 | 43.6 ± 2.5 | 11.7 ± 1.8 |

|
30.6 ± 1.8 | 6.7 ± 1.0 | 7.5 ± 1.2 | 0.54 ± 0.25 |
| S0210 |

|
287.4 ± 42.3 | 83.5 ± 4.9 | 0.0 ± 0.0 | 30.4 ± 2.5 | 70.1 ± 3.5 | 7.8 ± 1.2 | 40.4 ± 3.3 | 49.2 ± 3.2 | 0.0 ± 0.0 | 0.0 ± 0.0 | 0.13 ± 0.06 |
| 2002ew | ⋯ | ⋯ | ⋯ | ⋯ | ⋯ | ⋯ | ⋯ | ⋯ | ⋯ | ⋯ | ⋯ | ⋯ |
| 2002fa | 45.4 ± 3.9 | 125.1 ± 43.6 | 52.4 ± 7.2 | 6.1 ± 1.1 | 15.5 ± 3.1 | 36.5 ± 2.4 | 9.7 ± 2.4 | 13.1 ± 2.4 | 42.4 ± 2.4 | 0.0 ± 0.0 | 0.0 ± 0.0 | 0.36 ± 0.21 |
| 2002gd | 21.7 ± 3.3 | 106.8 ± 23.8 | 39.8 ± 3.3 | 5.8 ± 2.2 | 24.9 ± 3.5 | 59.3 ± 4.2 | 16.2 ± 2.8 | 26.9 ± 2.6 | 27.1 ± 5.1 | 3.8 ± 0.6 | 11.0 ± 2.1 | 0.20 ± 0.08 |
| 2002gw | 61.4 ± 4.6 | 205.5 ± 29.5 | 58.4 ± 4.6 | 6.9 ± 1.6 | 18.2 ± 2.1 | 31.3 ± 2.7 | 5.5 ± 1.7 | 5.8 ± 2.0 | 13.5 ± 1.3 | 3.1 ± 1.1 | 3.8 ± 1.5 | 0.30 ± 0.11 |
| 2002hj | 70.1 ± 5.3 | 207.5 ± 34.1 | 71.7 ± 5.5 | 2.8 ± 1.6 | 16.5 ± 2.9 | 40.8 ± 3.2 | 4.3 ± 2.5 | 10.2 ± 2.4 | 18.6 ± 1.9 | 0.0 ± 0.0 | 0.0 ± 0.0 | 0.34 ± 0.11 |
| 2002hx | 88.8 ± 6.1 | 135.6 ± 18.1 | 73.8 ± 4.8 | 9.8 ± 2.2 | 20.8 ± 2.2 | 35.5 ± 3.0 | 7.5 ± 1.1 | 17.9 ± 1.7 | 53.1 ± 4.1 | 8.6 ± 1.2 | 1.3 ± 2.1 | 0.65 ± 0.16 |
| 2002ig | ⋯ | ⋯ | ⋯ | ⋯ | ⋯ | ⋯ | ⋯ | ⋯ | ⋯ | ⋯ | 0.0 ± 0.0 | ⋯ |
| 2003B | 60.1 ± 5.3 | 148.6 ± 27.6 | 53.0 ± 4.5 | 10.5 ± 1.8 | 23.4 ± 2.5 | 38.1 ± 2.3 | 14.2 ± 1.4 | 20.3 ± 2.4 | 28.6 ± 2.2 | 3.9 ± 0.9 | 8.8 ± 1.5 | 0.40 ± 0.11 |
| 2003bl | 58.0 ± 4.3 | 116.5 ± 19.1 | 37.1 ± 2.1 | 15.1 ± 2.8 | 26.5 ± 2.5 | 38.3 ± 1.8 | 10.9 ± 2.9 | 17.0 ± 3.2 | 19.3 ± 1.6 | 11.7 ± 1.4 | 9.1 ± 1.9 | 0.51 ± 0.14 |
| 2003bn | 77.7 ± 5.4 | 144.4 ± 66.6 | 55.3 ± 6.5 | 7.1 ± 1.9 | 17.3 ± 2.6 | 36.0 ± 1.1 | 8.3 ± 2.1 | 9.1 ± 1.4 | 16.1 ± 2.3 | 3.2 ± 1.0 | 2.5 ± 1.1 | 0.54 ± 0.36 |
| 2003ci | 50.6 ± 2.5 | 166.2 ± 8.3 | 64.6 ± 3.2 | 1.3 ± 0.1 | 15.8 ± 0.8 | 46.2 ± 3.6 | 10.4 ± 0.5 | 20.7 ± 1.0 | 55.1 ± 1.8 | 7.7 ± 0.4 | 4.2 ± 0.2 | 0.31 ± 0.03 |
| 2003cn | 43.7 ± 2.9 | 141.6 ± 18.4 | 52.9 ± 4.7 | 12.6 ± 2.1 | 21.1 ± 3.4 | 35.1 ± 2.9 | 9.2 ± 1.8 | 17.2 ± 1.3 | 18.2 ± 1.7 | 7.4 ± 1.5 | 7.1 ± 1.2 | 0.31 ± 0.06 |
| 2003cx | ⋯ | ⋯ | ⋯ | ⋯ | ⋯ | ⋯ | ⋯ | ⋯ | ⋯ | ⋯ | ⋯ | ⋯ |
| 2003dq | ⋯ | ⋯ | ⋯ | ⋯ | ⋯ | ⋯ | ⋯ | ⋯ | ⋯ | ⋯ | ⋯ | ⋯ |
| 2003E | ⋯ | ⋯ | ⋯ | ⋯ | ⋯ | ⋯ | ⋯ | ⋯ | ⋯ | ⋯ | ⋯ | ⋯ |
| 2003ef | 91.4 ± 7.3 | 130.5 ± 14.3 | 27.9 ± 4.2 | 9.8 ± 1.3 | 20.4 ± 1.7 | 28.3 ± 3.4 | 10.8 ± 2.9 | 9.4 ± 1.2 |

|
1.9 ± 0.9 | 9.6 ± 1.2 | 0.70 ± 0.15 |
| 2003eg | 9.4 ± 1.1 | 244.2 ± 24.5 | 60.6 ± 3.4 | 0.0 ± 0.0 | 14.4 ± 1.5 | 38.6 ± 1.1 | 10.5 ± 2.4 | 14.2 ± 1.7 | 58.4 ± 1.3 | 7.1 ± 1.1 | 6.5 ± 0.8 | 0.04 ± 0.01 |
| 2003ej | ⋯ | ⋯ | ⋯ | ⋯ | ⋯ | ⋯ | ⋯ | ⋯ | ⋯ | ⋯ | ⋯ | ⋯ |
| 2003fb | 73.7 ± 6.3 | 185.1 ± 13.4 | 55.1 ± 2.2 | 8.1 ± 0.8 | 18.1 ± 0.8 |

|
7.9 ± 0.7 | 9.0 ± 1.1 | 25.0 ± 1.6 | 9.0 ± 1.8 | 7.1 ± 1.2 | 0.4 ± 0.06 |
| 2003gd | ⋯ | ⋯ | ⋯ | ⋯ | ⋯ | ⋯ | ⋯ | ⋯ | ⋯ | ⋯ | ⋯ | ⋯ |
| 2003hd | 78.1 ± 5.2 | 119.1 ± 30.9 | 56.8 ± 4.4 | 4.9 ± 1.1 | 16.1 ± 2.1 |

|
4.6 ± 1.8 | 7.9 ± 0.7 | 15.4 ± 2.3 | 0.0 ± 0.0 | 0.0 ± 0.0 | 0.65 ± 0.26 |
| 2003hg | ⋯ | ⋯ | ⋯ | ⋯ | ⋯ | ⋯ | ⋯ | ⋯ | ⋯ | ⋯ | ⋯ | ⋯ |
| 2003hk | 32.6 ± 2.4 | 123.2 ± 12.4 | 39.2 ± 3.7 | 9.3 ± 2.9 | 17.6 ± 2.3 | 34.6 ± 2.6 | 0.0 ± 0.0 | 0.0 ± 0.0 | 44.3 ± 1.1 | 0.0 ± 0.0 | 0.0 ± 0.0 | 0.26 ± 0.18 |
| 2003hl | 50.4 ± 3.1 | 118.3 ± 22.1 | 32.6 ± 5.9 | 6.8 ± 2.4 | 22.1 ± 2.9 | 39.5 ± 3.1 | 15.4 ± 1.9 | 19.2 ± 2.1 | 35.9 ± 2.5 | 5.6 ± 1.6 | 1.1 ± 1.2 | 0.43 ± 0.13 |
| 2003hn | 61.4 ± 4.0 | 178.7 ± 22.4 | 60.0 ± 4.4 | 7.2 ± 1.1 | 17.5 ± 1.5 | 39.1 ± 3.7 | 10.2 ± 0.8 | 13.3 ± 1.5 | 31.5 ± 2.6 | 4.3 ± 0.9 | 5.3 ± 0.8 | 0.34 ± 0.07 |
| 2003ho | 68.4 ± 4.8 | 269.8 ± 54.9 | 69.1 ± 4.6 | 5.4 ± 1.3 | 16.9 ± 1.9 | 42.7 ± 3.2 | 7.9 ± 1.1 | 8.3 ± 0.7 | 36.1 ± 1.9 | 0.0 ± 0.0 | 0.0 ± 0.0 | 0.25 ± 0.08 |
| 2003ib | ⋯ | ⋯ | ⋯ | ⋯ | ⋯ | ⋯ | ⋯ | ⋯ | ⋯ | ⋯ | ⋯ | ⋯ |
| 2003ip | 60.9 ± 4.2 | 191.4 ± 18.1 | 71.2 ± 6.8 | 0.0 ± 0.0 | 9.3 ± 2.2 |

|
6.5 ± 1.4 | 12.0 ± 1.0 | 33.2 ± 2.6 | 4.9 ± 0.6 | 5.9 ± 1.1 | 0.32 ± 0.05 |
| 2003iq | 84.2 ± 5.6 | 157.9 ± 14.4 | 46.2 ± 4.2 | 7.8 ± 2.1 | 21.3 ± 1.8 | 37.7 ± 3.1 | 10.4 ± 2.6 | 10.7 ± 0.9 | 32.3 ± 2.9 | 3.4 ± 1.2 | 6.0 ± 1.0 | 0.53 ± 0.13 |
| 2003T |

|
153.6 ± 29.6 | 27.6 ± 3.1 | 11.5 ± 3.7 | 22.9 ± 1.9 | 38.2 ± 3.6 | 14.0 ± 2.9 | 14.9 ± 1.3 | 35.1 ± 2.5 | 18.7 ± 6.7 | 10.2 ± 1.2 | 0.38 ± 0.21 |
| 2004dy | ⋯ | ⋯ | ⋯ | ⋯ | ⋯ | ⋯ | ⋯ | ⋯ | ⋯ | ⋯ | ⋯ | ⋯ |
| 2004ej | 57.1 ± 3.8 | 114.6 ± 20.3 | 48.6 ± 4.7 | 9.1 ± 2.1 | 20.7 ± 1.7 | 44.0 ± 4.3 | 14.7 ± 2.3 | 21.8 ± 2.9 | 37.2 ± 3.1 | 6.4 ± 1.6 | 5.9 ± 1.7 | 0.50 ± 0.17 |
| 2004er | 74.4 ± 5.7 | 154.3 ± 23.7 | 59.2 ± 4.7 | 3.2 ± 1.5 | 10.7 ± 2.3 | 34.3 ± 2.8 | 3.6 ± 0.7 | 6.4 ± 1.4 | 16.2 ± 2.3 | 0.4 ± 0.6 | 2.6 ± 0.7 | 0.48 ± 0.14 |
| 2004fb | 70.1 ± 7.2 | 165.5 ± 26.1 | 59.1 ± 3.4 | 6.9 ± 0.5 | 18.7 ± 2.1 | 46.9 ± 4.4 | 11.6 ± 1.2 | 16.8 ± 2.1 | 41.6 ± 2.8 | 10.8 ± 1.0 | 10.4 ± 1.2 | 0.42 ± 0.29 |
| 2004fc | 34.8 ± 6.2 | 85.6 ± 37.9 | 16.2 ± 4.8 | 7.9 ± 2.1 | 18.7 ± 2.8 | 28.2 ± 3.1 | 10.2 ± 1.9 | 14.4 ± 1.7 | 23.1 ± 2.3 | 5.0 ± 1.1 | 6.6 ± 1.8 | 0.41 ± 0.36 |
| 2004fx | 70.6 ± 4.7 | 168.9 ± 35.7 | 55.7 ± 3.3 | 8.6 ± 2.3 | 18.6 ± 3.1 | 30.7 ± 2.0 | 7.2 ± 2.5 | 4.4 ± 0.6 | 11.3 ± 1.2 | 2.7 ± 1.2 | 4.8 ± 1.4 | 0.42 ± 0.15 |
| 2005af | ⋯ | ⋯ | ⋯ | ⋯ | ⋯ | ⋯ | ⋯ | ⋯ | ⋯ | ⋯ | ⋯ | ⋯ |
| 2005an | 51.9 ± 3.8 | 210.8 ± 27.1 | 74.4 ± 5.7 | 4.1 ± 0.4 | 15.4 ± 1.6 | 42.8 ± 2.9 | 12.1 ± 2.1 | 22.2 ± 2.5 | 18.4 ± 1.8 | 0.0 ± 0.0 | 10.5 ± 0.9 | 0.25 ± 0.06 |
| 2005dk | 49.0 ± 3.3 | 166.6 ± 19.0 | 57.6 ± 3.5 | 5.4 ± 0.7 | 13.4 ± 1.2 | 32.7 ± 3.2 | 8.9 ± 2.3 | 11.1 ± 1.3 | 32.1 ± 1.6 | 4.2 ± 0.9 | 4.6 ± 0.9 | 0.29 ± 0.08 |
| 2005dn | 66.6 ± 4.1 | 238.9 ± 54.3 | 77.9 ± 4.5 | 1.1 ± 2.2 | 3.9 ± 1.1 | 48.0 ± 3.1 | 0.0 ± 0.0 | 10.5 ± 1.2 | 30.7 ± 2.4 | 0.0 ± 0.0 | 0.0 ± 0.0 | 0.28 ± 0.09 |
| 2005dt | ⋯ | ⋯ | ⋯ | ⋯ | ⋯ | ⋯ | ⋯ | ⋯ | ⋯ | ⋯ | ⋯ | ⋯ |
| 2005dw | ⋯ | ⋯ | ⋯ | ⋯ | ⋯ | ⋯ | ⋯ | ⋯ | ⋯ | ⋯ | ⋯ | ⋯ |
| 2005dx | ⋯ | ⋯ | ⋯ | ⋯ | ⋯ | ⋯ | ⋯ | ⋯ | ⋯ | ⋯ | ⋯ | ⋯ |
| 2005dz | 77.2 ± 3.4 |

|
50.4 ± 4.1 | 0.0 ± 0.0 | 20.3 ± 2.3 | 34.4 ± 2.8 | 0.0 ± 0.0 | 0.0 ± 0.0 | 0.0 ± 0.0 | 0.0 ± 0.0 | 0.0 ± 0.0 | 0.38 ± 0.141 |
| 2005es | ⋯ | ⋯ | ⋯ | ⋯ | ⋯ | ⋯ | ⋯ | ⋯ | ⋯ | ⋯ | ⋯ | ⋯ |
| 2005J | 77.2 ± 5.5 | 133.7 ± 30.3 | 64.0 ± 2.5 | 5.5 ± 1.8 | 15.9 ± 2.5 | 36.6 ± 2.4 | 8.6 ± 1.8 | 12.2 ± 1.4 | 23.2 ± 1.4 | 4.8 ± 1.7 | 3.9 ± 1.3 | 0.58 ± 0.201 |
| 2005K | ⋯ | ⋯ | ⋯ | ⋯ | ⋯ | ⋯ | ⋯ | ⋯ | ⋯ | ⋯ | ⋯ | ⋯ |
| 2005lw | 45.1 ± 4.2 | 210.0 ± 15.2 | 50.1 ± 3.4 | 0.0 ± 0.0 | 9.2 ± 1.5 | 60.0 ± 3.1 | 6.1 ± 1.7 | 7.0 ± 0.7 | 26.0 ± 2.1 | 3.5 ± 1.2 | 4.9 ± 1.6 | 0.21 ± 0.17 |
| 2005me | ⋯ | ⋯ | ⋯ | ⋯ | ⋯ | ⋯ | ⋯ | ⋯ | ⋯ | ⋯ | ⋯ | ⋯ |
| 2005Z | 65.9 ± 3.4 | 192.1 ± 35.7 | 56.8 ± 4.3 | 6.9 ± 1.5 | 12.7 ± 1.6 | 36.1 ± 3.7 | 10.4 ± 2.2 | 13.9 ± 1.6 | 49.2 ± 2.9 | 0.0 ± 0.0 | 0.0 ± 0.0 | 0.34 ± 0.118 |
| 2006ai | 15.4 ± 2.6 | 173.2 ± 22.5 | 38.5 ± 3.4 | 3.2 ± 1.2 | 15.0 ± 2.1 | 36.8 ± 4.1 | 6.5 ± 2.5 | 7.8 ± 1.7 | 35.4 ± 2.1 | 0.0 ± 0.0 | 0.0 ± 0.0 | 0.09 ± 0.038 |
| 2006bc | ⋯ | ⋯ | ⋯ | ⋯ | ⋯ | ⋯ | ⋯ | ⋯ | ⋯ | ⋯ | ⋯ | ⋯ |
| 2006be | 62.2 ± 3.3 |

|
68.1 ± 3.0 | 5.6 ± 1.3 | 15.1 ± 0.7 | 26.0 ± 2.1 | 8.0 ± 1.2 | 12.0 ± 1.2 | 20.0 ± 1.2 | 5.3 ± 1.0 | 0.0 ± 0.0 | 0.34 ± 0.037 |
| 2006bl | ⋯ | ⋯ | ⋯ | ⋯ | ⋯ | ⋯ | ⋯ | ⋯ | ⋯ | ⋯ | ⋯ | ⋯ |
| 2006ee | 62.6 ± 6.2 | 122.1 ± 22.5 | 24.5 ± 4.5 | 15.2 ± 3.2 | 26.6 ± 2.9 | 42.4 ± 2.8 | 14.6 ± 1.5 | 18.1 ± 2.2 | 39.1 ± 2.8 | 13.1 ± 1.8 | 14.1 ± 1.2 | 0.51 ± 0.227 |
| 2006it | ⋯ | ⋯ | ⋯ | ⋯ | ⋯ | ⋯ | ⋯ | ⋯ | ⋯ | ⋯ | ⋯ | ⋯ |
| 2006iw | 40.6 ± 4.2 | 94.7 ± 12.2 | 38.1 ± 3.3 | 3.5 ± 1.6 | 10.0 ± 0.7 | 16.0 ± 1.6 | 5.0 ± 0.8 | 6.7 ± 1.2 |

|
0.0 ± 0.0 | 0.0 ± 0.0 | 0.43 ± 0.097 |
| 2006ms | ⋯ | ⋯ | ⋯ | ⋯ | ⋯ | ⋯ | ⋯ | ⋯ | ⋯ | ⋯ | ⋯ | ⋯ |
| 2006qr | 69.7 ± 4.6 | 133.1 ± 15.1 | 61.9 ± 5.3 | 11.5 ± 0.6 | 22.1 ± 1.9 | 44.0 ± 4.2 | 16.3 ± 3.1 | 20.2 ± 2.6 | 33.6 ± 2.4 | 8.8 ± 1.9 | 12.6 ± 1.2 | 0.52 ± 0.214 |
| 2006Y | 10.4 ± 2.9 | 123.7 ± 27.3 | 25.5 ± 2.8 | 1.6 ± 0.5 | 6.7 ± 1.8 | 16.3 ± 3.1 | 0.0 ± 0.0 | 0.0 ± 0.0 |

|
0.0 ± 0.0 | 0.0 ± 0.0 | 0.08 ± 0.042 |
| 2007aa | 74.5 ± 6.5 | 119.7 ± 11.0 | 52.5 ± 5.8 | 9.6 ± 1.1 | 20.7 ± 1.8 | 35.1 ± 2.5 | 10.7 ± 2.1 | 13.1 ± 1.5 | 31.8 ± 2.9 | 1.1 ± 0.9 | 5.7 ± 1.6 | 0.62 ± 0.145 |
| 2007ab | 72.4 ± 5.1 | 232.1 ± 26.4 | 84.6 ± 5.4 | 0.0 ± 0.0 | 17.5 ± 3.6 | 77.2 ± 3.4 | 6.6 ± 2.6 | 23.0 ± 2.4 |

|
8.0 ± 1.1 | 12.0 ± 2.3 | 0.31 ± 0.083 |
| 2007av |

|
164.9 ± 22.2 | 46.4 ± 3.3 | 8.6 ± 1.5 | 21.8 ± 1.4 | 43.9 ± 2.5 | 10.9 ± 2.8 | 12.3 ± 1.8 | 29.4 ± 3.2 | 7.6 ± 1.9 | 8.3 ± 1.5 | 0.59 ± 0.119 |
| 2007bf | ⋯ | ⋯ | ⋯ | ⋯ | ⋯ | ⋯ | ⋯ | ⋯ | ⋯ | ⋯ | ⋯ | ⋯ |
| 2007hm | 44.1 ± 4.3 | 180.7 ± 36.8 | 56.2 ± 5.9 | 8.3 ± 0.7 | 16.6 ± 3.3 | 29.1 ± 3.3 | 9.8 ± 1.6 | 14.3 ± 1.4 | 22.3 ± 2.2 | 0.0 ± 0.0 | 0.0 ± 0.0 | 0.24 ± 0.105 |
| 2007il | 63.9 ± 5.4 | 190.2 ± 36.5 | 66.4 ± 4.2 | 2.8 ± 2.1 | 13.4 ± 2.5 | 28.2 ± 6.3 | 0.0 ± 0.0 | 0.0 ± 0.0 | 15.6 ± 1.1 | 0.0 ± 0.0 | 0.0 ± 0.0 | 0.34 ± 0.114 |
| 2007it | ⋯ | ⋯ | ⋯ | ⋯ | ⋯ | ⋯ | ⋯ | ⋯ | ⋯ | ⋯ | ⋯ | ⋯ |
| 2007ld | ⋯ | ⋯ | ⋯ | ⋯ | ⋯ | ⋯ | ⋯ | ⋯ | ⋯ | ⋯ | ⋯ | ⋯ |
| 2007oc | 35.5 ± 2.8 | 267.1 ± 22.4 | 70.1 ± 6.9 | 4.5 ± 1.5 | 8.0 ± 1.9 | 46.5 ± 4.6 | 4.3 ± 1.9 | 14.4 ± 1.9 | 43.6 ± 1.8 | 3.5 ± 1.5 | 2.9 ± 1.0 | 0.13 ± 0.022 |
| 2007od | 32.9 ± 3.1 | 184.0 ± 22.5 | 65.2 ± 5.1 | 0.0 ± 0.0 | 14.7 ± 2.7 | 36.0 ± 3.8 | 0.0 ± 0.0 | 15.2 ± 1.7 | 16.4 ± 0.9 | 3.5 ± 0.6 | 5.3 ± 1.4 | 0.18 ± 0.039 |
| 2007P | ⋯ | ⋯ | ⋯ | ⋯ | ⋯ | ⋯ | ⋯ | ⋯ | ⋯ | ⋯ | ⋯ | ⋯ |
| 2007sq | 37.5 ± 4.2 | 125.9 ± 36.4 |

|

|
6.8 ± 1.9 | 31.8 ± 3.5 | 5.1 ± 1.7 | 7.7 ± 0.9 | 22.4 ± 0.9 | 0.0 ± 0.0 | 0.0 ± 0.0 | 0.30 ± 0.167 |
| 2007U | 31.1 ± 3.2 | 142.8 ± 32.4 | 54.3 ± 4.2 | 0.0 ± 0.0 | 12.0 ± 2.1 | 40.9 ± 2.3 | 10.0 ± 2.1 | 15.6 ± 2.1 | 17.1 ± 1.7 | 0.0 ± 0.0 | 0.0 ± 0.0 | 0.22 ± 0.079 |
| 2007W | 67.2 ± 3.6 | 131.2 ± 21.7 | 38.1 ± 5.9 |

|
21.7 ± 2.6 | 36.5 ± 2.8 | 10.2 ± 2.6 | 16.0 ± 1.8 | 13.5 ± 2.2 | 4.6 ± 1.3 | 4.1 ± 1.3 | 0.51 ± 0.127 |
| 2007X | 45.2 ± 2.8 | 223.8 ± 32.8 | 77.1 ± 4.7 | 0.0 ± 0.0 | 13.9 ± 2.9 | 49.4 ± 2.1 | 10.3 ± 3.2 | 16.4 ± 1.6 | 22.9 ± 1.2 | 5.6 ± 0.9 | 9.1 ± 1.4 | 0.20 ± 0.06 |
| 2007Z | ⋯ | ⋯ | ⋯ | ⋯ | ⋯ | ⋯ | ⋯ | ⋯ | ⋯ | ⋯ | ⋯ | ⋯ |
| 2008ag | 60.6 ± 5.2 | 185.2 ± 15.8 | 39.3 ± 3.2 | 10.7 ± 2.1 | 22.3 ± 1.7 | 38.9 ± 2.6 | 10.1 ± 1.9 | 14.6 ± 1.7 | 38.4 ± 2.1 | 3.3 ± 1.8 | 5.5 ± 1.2 | 0.33 ± 0.072 |
| 2008aw | 17.8 ± 2.3 | 175.8 ± 18.8 | 47.1 ± 4.6 | 3.1 ± 1.3 | 12.4 ± 1.4 | 37.8 ± 1.4 | 6.4 ± 1.2 | 8.2 ± 0.6 | 38.8 ± 2.9 | 3.6 ± 1.6 | 3.6 ± 1.3 | 0.10 ± 0.051 |
| 2008bh | 55.8 ± 4.2 | 216.8 ± 41.7 | 54.4 ± 5.6 | 4.7 ± 1.3 | 16.2 ± 2.0 | 36.2 ± 1.1 | 8.3 ± 2.2 | 9.8 ± 1.0 | 16.7 ± 1.9 | 5.2 ± 0.9 | 5.2 ± 0.8 | 0.26 ± 0.101 |
| 2008bk | 57.5 ± 4.8 | 94.3 ± 12.0 | 31.9 ± 3.9 | 16.3 ± 1.2 | 24.6 ± 2.1 | 43.7 ± 3.5 | 14.8 ± 1.7 | 21.8 ± 2.1 | 20.1 ± 1.7 | 11.8 ± 1.2 | 10.5 ± 1.1 | 0.61 ± 0.16 |
| 2008bm | 4.6 ± 0.2 | 16.1 ± 0.8 | 19.2 ± 1.3 | 9.1 ± 0.5 | 11.6 ± 0.6 | 19.8 ± 2.1 | 0.0 ± 0.0 | 0.0 ± 0.0 | 3.4 ± 0.6 | 0.0 ± 0.0 | 0.0 ± 0.0 | 0.29 ± 0.027 |
| 2008bp | ⋯ | ⋯ | ⋯ | ⋯ | ⋯ | ⋯ | ⋯ | ⋯ | ⋯ | ⋯ | ⋯ | ⋯ |
| 2008br | 15.8 ± 3.0 | 23.3 ± 17.9 | 22.3 ± 3.2 | 7.1 ± 1.8 | 7.2 ± 1.1 | 9.7 ± 2.8 | 8.8 ± 1.9 | 12.9 ± 1.1 | 12.4 ± 0.7 | 9.4 ± 1.1 | 6.7 ± 2.5 | 0.69 ± 0.752 |
| 2008bu | ⋯ | ⋯ | ⋯ | ⋯ | ⋯ | ⋯ | ⋯ | ⋯ | ⋯ | ⋯ | ⋯ | ⋯ |
| 2008F | ⋯ | ⋯ | ⋯ | ⋯ | ⋯ | ⋯ | ⋯ | ⋯ | ⋯ | ⋯ | ⋯ | ⋯ |
| 2008ga |

|
234.1 ± 13.2 | 60.0 ± 2.3 | 6.8 ± 1.5 | 17.0 ± 1.5 | 35.1 ± 2.1 | 7.1 ± 1.8 | 15.0 ± 1.7 | 55.0 ± 2.1 | 0.0 ± 0.0 | 0.0 ± 0.0 | 0.36 ± 0.045 |
| 2008gi | ⋯ | ⋯ | ⋯ | ⋯ | ⋯ | ⋯ | ⋯ | ⋯ | ⋯ | ⋯ | ⋯ | ⋯ |
| 2008gr | 35.5 ± 3.5 | 186.4 ± 41.5 | 56.6 ± 3.6 | 0.0 ± 0.0 | 7.3 ± 0.9 | 34.1 ± 2.6 | 4.7 ± 1.8 | 7.8 ± 1.0 | 30.9 ± 2.5 | 0.0 ± 0.0 | 0.0 ± 0.0 | 0.19 ± 0.099 |
| 2008H | 63.3 ± 5.1 | 150.2 ± 21.0 | 33.0 ± 3.1 | 10.0 ± 2.1 | 22.2 ± 1.7 | 51.0 ± 3.2 |

|
20.0 ± 2.1 | 54.1 ± 3.1 | 15.0 ± 2.2 | 14.0 ± 1.8 | 0.42 ± 0.132 |
| 2008hg | ⋯ | ⋯ | ⋯ | ⋯ | ⋯ | ⋯ | ⋯ | ⋯ | ⋯ | ⋯ | ⋯ | ⋯ |
| 2008ho | ⋯ | ⋯ | ⋯ | ⋯ | ⋯ | ⋯ | ⋯ | ⋯ | ⋯ | ⋯ | ⋯ | ⋯ |
| 2008if | 26.1 ± 2.3 | 239.2 ± 58.9 | 61.8 ± 3.7 | 2.4 ± 1.1 | 9.3 ± 1.3 | 30.2 ± 3.3 | 4.7 ± 1.2 | 6.9 ± 1.3 | 48.3 ± 3.2 | 1.2 ± 0.5 | 3.7 ± 0.9 | 0.11 ± 0.06 |
| 2008il | ⋯ | ⋯ | ⋯ | ⋯ | ⋯ | ⋯ | ⋯ | ⋯ | ⋯ | ⋯ | ⋯ | ⋯ |
| 2008in | 54.8 ± 7.3 | 157.6 ± 49.6 | 36.6 ± 3.1 | 14.5 ± 3.1 | 26.9 ± 1.9 | 42.9 ± 2.7 | 14.7 ± 2.6 | 18.3 ± 1.4 | 38.8 ± 2.3 | 6.4 ± 1.4 | 8.3 ± 1.8 | 0.35 ± 0.22 |
| 2008K | 40.5 ± 4.5 | 250.8 ± 44.5 | 80.4 ± 4.2 | 0.0 ± 0.0 | 17.4 ± 2.6 | 62.8 ± 1.8 | 0.0 ± 0.0 | 19.1 ± 2.1 | 41.5 ± 3.1 | 0.0 ± 0.0 | 0.0 ± 0.0 | 0.16 ± 0.07 |
| 2008M | 54.0 ± 5.5 | 208.7 ± 27.7 | 72.9 ± 3.8 | 5.3 ± 2.1 | 20.2 ± 3.4 | 34.0 ± 1.9 | 4.9 ± 2.1 | 7.5 ± 1.4 | 30.3 ± 2.8 | 2.5 ± 0.9 | 1.6 ± 1.1 | 0.26 ± 0.06 |
| 2008W | 46.7 ± 4.2 | 200.2 ± 21.9 | 60.4 ± 3.4 | 5.1 ± 1.9 | 16.4 ± 2.9 | 36.9 ± 2.8 | 7.7 ± 1.9 | 12.7 ± 1.1 | 45.9 ± 1.7 | 3.5 ± 1.4 | 4.6 ± 1.7 | 0.23 ± 0.08 |
| 2009aj | 8.1 ± 1.6 | 46.7 ± 6.1 |

|
6.2 ± 1.6 | 8.5 ± 0.9 | 13.9 ± 3.1 | 0.0 ± 0.0 | 0.0 ± 0.0 | 1.7 ± 0.6 | 0.0 ± 0.0 | 0.0 ± 0.0 | 0.17 ± 0.06 |
| 2009ao | 40.2 ± 3.1 |

|
54.5 ± 3.4 | 5.8 ± 6.2 | 18.5 ± 1.4 | 41.8 ± 2.7 | 9.3 ± 1.6 | 19.4 ± 2.1 | 24.2 ± 1.6 | 0.0 ± 0.0 | 9.1 ± 1.8 | 0.27 ± 0.04 |
| 2009au | 5.9 ± 1.4 | 34.3 ± 11.1 | 12.8 ± 2.7 | 8.8 ± 2.8 | 11.9 ± 1.7 | 17.2 ± 2.5 | 6.1 ± 1.8 | 7.3 ± 2.3 | 7.9 ± 0.8 | 3.3 ± 0.6 | 5.6 ± 1.3 | 0.17 ± 0.09 |
| 2009bu | 84.6 ± 5.3 | 146.5 ± 23.3 | 55.9 ± 3.1 | 3.6 ± 1.1 | 14.2 ± 1.9 | 26.4 ± 1.8 | 5.7 ± 2.2 | 6.1 ± 2.5 | 15.1 ± 1.5 | 0.0 ± 0.0 | 0.0 ± 0.0 | 0.58 ± 0.14 |
| 2009bz | ⋯ | ⋯ | ⋯ | ⋯ | ⋯ | ⋯ | ⋯ | ⋯ | ⋯ | ⋯ | ⋯ | ⋯ |
| 2009N | 75.7 ± 3.1 | 118.5 ± 20.7 | 39.1 ± 3.9 | 15.2 ± 1.9 | 25.4 ± 1.6 | 34.4 ± 2.1 | 13.7 ± 1.1 | 20.8 ± 2.1 | 24.5 ± 1.2 | 10.3 ± 1.6 | 9.6 ± 1.1 | 0.64 ± 0.22 |
| 2009W | ⋯ | ⋯ | ⋯ | ⋯ | ⋯ | ⋯ | ⋯ | ⋯ | ⋯ | ⋯ | ⋯ | ⋯ |
Note. Columns: (1) SN name; (2) pEW of  absorption component; (3) pEW of
  emission component; (4) pEW of
  (5) pEW of Fe ii λ4924; (6) pEW of Fe ii λ5018; (7) pEW of Fe ii λ5169; (8) pEW of Fe ii/Sc ii; (9) pEW of Sc ii Multiplet; (10) pEW of Na i D; (11) pEW of Ba ii; (12) pEW of Sc ii; (13) ratio of absoprtion to emission (a/e) of
  P-Cygni profile.
5.1. Spectral Correlations in the Photospheric Phase
We analyze the spectral properties of SNe II, focusing on correlations between pEWs, expansion velocities, velocity decline rate, and velocity differences. Figure 2 shows the correlation matrix of the velocity measurements at 50 days obtained by estimating the Pearson correlation coefficient. Correlation coefficients are displayed in color: darkest colors (green and purple) represent the highest correlation found with the Pearson correlation test (−1 and 1, respectively), while white colors (0) mean no correlation. These colors are presented in the lower triangle, while the upper triangle shows the Pearson correlation value (ρ). It is generally considered that correlation coefficients between 0 and 0.19 represent close to zero correlation, 0.2–0.39 weak, 0.4–0.59 moderate, 0.6–0.89 strong, and 0.8–1.0 very strong (Evans 1996), while also noting the statistical significance of these correlation coefficients in many cases. We will use these descriptions for the following discussion. As shown in Figure 2, all velocities strongly correlate positively with each other, as we would expect for an homologous expansion ( ). Taking an average, v(Sc ii/Fe ii)
  , v(O i)
  , and v(Sc ii)
  show the highest correlations with the other parameters, with values of 0.887, 0.883, and 0.875, respectively, while Fe ii
  shows the lowest (0.714). The Sc ii
  line velocities correlate strongly with Fe ii
  and Sc ii/Fe ii
  , with a value of
  and
and  . It is important to note that while the velocities all correlate, they are offset. In general, the differences in the velocities are related to the optical depth for each line and the proximity of the line forming region to the photosphere. As
  displays the highest velocities, it is mostly formed in the outer shell of the ejecta and its optical depth is much larger than the Fe ii lines, which are forming near to the photosphere.
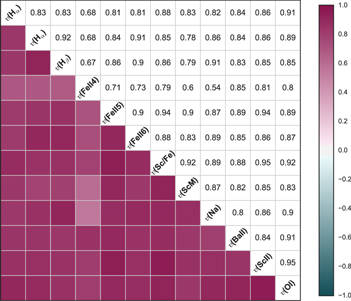
Figure 2. Correlation matrix of the individual velocity measurements at 50 days. Colors indicate the Pearson correlation coefficient ρ. The diagonal middle line shows the name of the parameter:  from FWHM and from the minimum absorption flux,
  , Fe ii
  , Fe ii
  , Fe ii
  , Sc ii/Fe ii
  , Sc ii M
  , Na i D, Ba ii
  , Sc ii
  , and O i
  velocities.
Download figure:
Standard image High-resolution imageFigure 3 shows the correlation matrix of the pEW measurements at 50 days. Searching for correlations of pEWs with each other, we find that Sc ii/Fe ii  seems to be the dominant parameter to correlate with all the other pEWs (on average 0.404), while the pEW of the
  absorption component shows very weak correlations with other pEWs. The strongest correlations are displayed by the iron-group lines with each other. We can see moderate correlations between the pEW of O i
  and
and  . In the case of a/e, we find a moderate correlation only with Fe ii
  (
( ) and anticorrelation with pEW of
  emission (
 ). While
  shows a weak correlation with the
  absorption component (
 ), the correlation with the
  emission component is strong, with a
  . The lack of correlation between
  and
and  absorption features could be due to (a) blending effects of Fe ii, Sc ii, and Ba ii lines with
  , and/or (b) the effects of Cachito (Paper I) on the profile of
  .
.

Figure 3. Correlation matrix of the individual pEW measurements at 50 days. Colors indicate the Pearson correlation coefficient ρ. The diagonal middle line shows the name of the parameter: pEW( ) of absorption component, pEW(
 ) of emission component, pEW(
 ), pEW(Fe ii
  ), pEW(Fe ii
  ), pEW(Fe ii
  ), pEW(Sc ii/Fe ii
  ), pEW(Sc ii M
  ), pEW(Na i D), pEW(Ba ii
  ), pEW(Sc ii
  ), pEW(O i
  ), and a/e.
Download figure:
Standard image High-resolution imageFigures 4–6, show the relations between the  , Fe ii
  , and Na i D velocities and the pEWs for the 11 features explained above at 50 days. Checking these correlations, we see that velocities correlate positively with Balmer and Na i D lines, but negatively with Fe ii lines. For
  , we present the pEW of the absorption and emission component in the first two panels, respectively. In the three figures are shown five objects with the lowest velocities and smallest pEW values. Three of these SNe show signs of interaction (narrow emision lines) at early times (SN 2008bm, 2009au, and 2009bu, these SNe also display abnormally low velocities for their brightness). The other two SNe are SN 2008br and SN 2002gd. In those panels plotting pEWs of Fe ii
  , Sc ii/Fe ii
  , Sc ii
  , Ba ii
  , and Sc ii
  , one can see that there are many SNe with pEW = 0. In these spectra, we do not detect these lines.
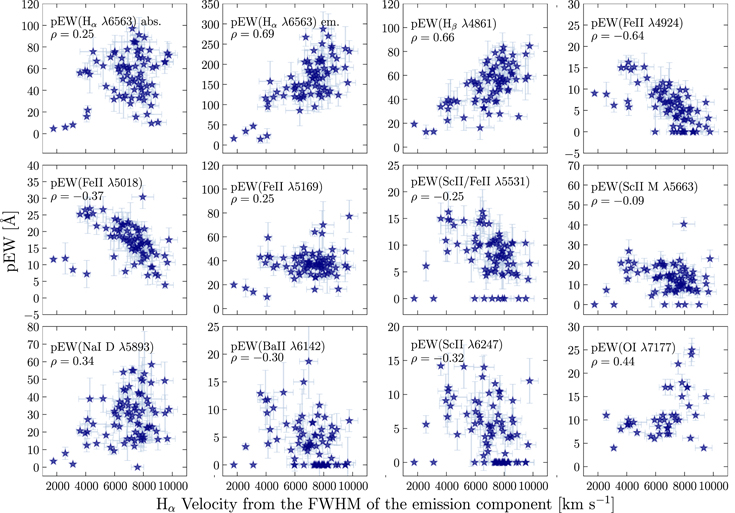
Figure 4. Relations between  velocities and the pEWs of
  of absorption and emission component,
  , Fe ii
  , Fe ii
  , Fe ii
  , Sc ii/Fe ii
  , Sc ii multiplet, Na i D, Ba ii
  , Sc ii
  , and O i
  . On the top left of each panel, the spectral feature name is displayed, together with the Pearson correlation value.
Download figure:
Standard image High-resolution image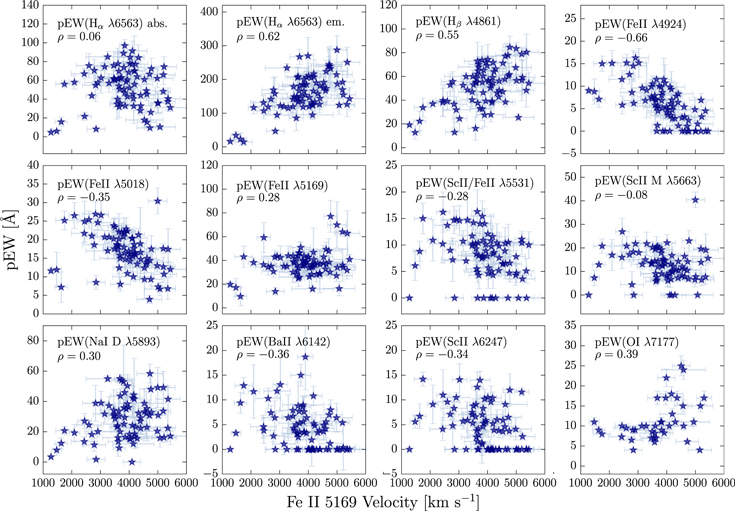
Figure 5. Same as Figure 4 but for Fe ii 5169 velocities.
Download figure:
Standard image High-resolution image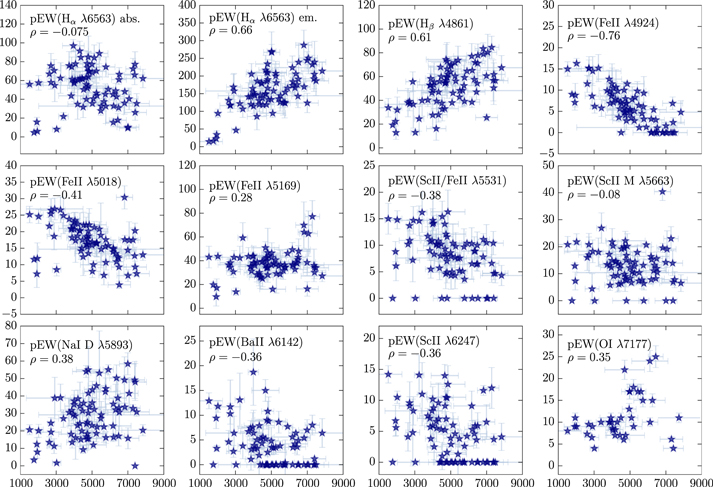
Figure 6. Same as Figure 4 but for Na i D velocities.
Download figure:
Standard image High-resolution imageIn Figure 4, we can see that the  velocities do not show correlations with pEW(
 ) of the absorption component, pEW(Fe ii
  ), pEW(Sc ii/Fe ii
  ), pEW(Sc ii multiplet), pEW(Na i D), pEW(Ba ii
  ), and pEW(Sc ii
  ). The strongest correlations are shown with pEW(
 ) of the emission component,
  , and anticorrelations with Fe ii
  and Fe ii
  . Figures 5 and 6 show that Fe ii
  and Na i D velocities present more scatter in their relations than those shown by
  velocities.
The expansion velocities with  (
( show anticorrelations, which are stronger at late epochs (between 50 and 80 days) than at early phases (15 to 30 days, 15 to 50 days, and 30 to 50 days). Meanwhile,
  (
( Fe ii
Fe ii  ) and
) and  (Na i D−Fe ii
  ) show correlations with the expansion velocities at 50 days (see Figure 7).
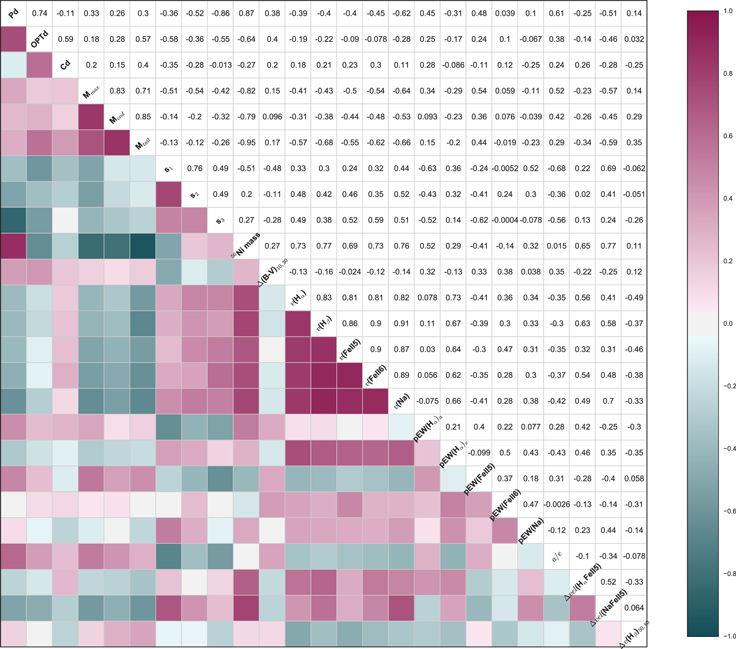
Figure 7. Correlation matrix of the individual spectral and photometric parameters at 50 days. Colors indicate the Pearson correlation coefficient ρ. In the diagonal line is shown Pd: plateau duration; OPTd: optically thick duration; Cd: cooling duration; Mmax: magnitude at maximum; Mend: magnitude at the end of the plateau; Mtail: magnitude in the radioactive tail phase; s1: initial decline; s2: plateau decline; s3: radioactive tail decline; 56Ni mass: nickel mass;  : color gradient between 10 and 30 days from explosion; v(
 ):
):  velocity obtained from the FWHM of the emission component; v(
 ):
):  velocity; v(FeII5): Fe ii 5018 velocity; v(FeII6): Fe ii 5169 velocity; v(Na): Na i D velocity, pEW(
 : pEW of
  absorption component; pEW(
 : pEW of the
  emission component, pEW(
 : pEW of
  , pEW(FeII5): pEW of Fe ii 5018, pEW(FeII6): pEW of Fe ii 5169; pEW(Na): pEW ofNa i D, a/e: ratio of absortion to emission component of
  P-Cygni profile;
  (
( FeII5):
  (
( Fe ii 5018),
  (NaFeII5):
  (Na i D−Fe ii 5018); and
  :
:  in a range of
 ![$[+50,+80]$](https://content.cld.iop.org/journals/0004-637X/850/1/90/revision1/apjaa8f42ieqn201.gif) days.
days.
Download figure:
Standard image High-resolution image5.2. Spectroscopic and Photometric Properties
We now present a comparison of spectroscopic and photometric properties of SNe II. While we have defined and measured 31 spectroscopic and 13 photometric parameters, here we choose a smaller number of parameters to focus on and search for correlations between them. Thus, we employ 14 spectral and 11 photometric parameters: v( ) obtained from the FWHM of the emission component, v(
 ), v(Fe ii 5018), v(Fe ii 5169), v(Na i D), pEW(
 ), pEW(
 , pEW(
 ), pEW(Fe ii 5018), pEW(Fe ii 5169), pEW(Na i D), a/e,
  in a range of
  d,
d,  (
( Fe ii 5018),
  (Na i D−Fe ii 5018), OPTd, Pd, Cd, Mmax, Mend, Mtail, s1, s2, s3,
  in a range of
  d, and the 56Ni mass.
Figure 7 shows the correlation matrix of the spectroscopic parameters (obtained at 50 days from explosion) and photometric properties. Although photometric correlations have been shown in previous works (e.g., A14, Valenti et al. 2016), the incorporation of numerous spectral parameters can aid in furthering our understanding of the link between observed parameters and underlying SN II physics. As in the previous matrix of correlation, darkest colors indicate higher correlation and white colors, no correlation.
Focusing on the photometric correlations, one can see that many of these are stronger than in A14. As discussed previously, this is because some parameters have been remeasured with new techniques (L. Galbany et al. 2017, in preparation). Interestingly, the number of SNe II with measured values of both Pd and s3 show an increase from 4 in A14 to 8 in this work. As explained above, both parameters can give us an idea of the of hydrogen envelope mass at the moment of explosion, thus some relation is expected. Figure 8 shows an evident trend between both parameters, with a correlation coefficient of  (although we note the low number of SNe). SNe II with smaller Pd have higher s3 decline rates, providing further evidence of a dominant role in defining light-curve morphology of the hydrogen envelope mass, while also providing further support for the use of Pd and s3 as envelope mass indicators (given their relatively strong correlation).
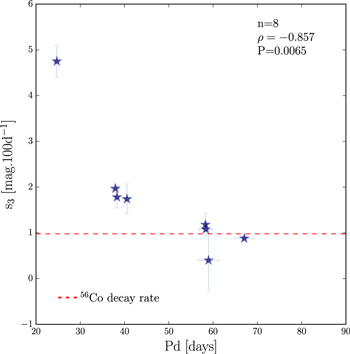
Figure 8. Correlation between Pd vs. s3. On the top of the figure, n = number of events, ρ = Pearsons correlation coefficient, and P = probability of detecting a correlation by chance. The dashed horizontal line shows the expected decline rate on the radioactive tail, assuming full trapping of gamma-rays from 56Co to 56Fe decay.
Download figure:
Standard image High-resolution imageFrom Figure 7, we can also see that Pd has a moderate correlation with velocities. Although we find a strong correlation between Pd and 56Ni mass, in agreement to the theoretical predictions (e.g., Kasen & Woosley 2009), we are not in a position to support this result because the correlation is produced only with three points. However, when we include the lower limits for the 56Ni mass, the correlation disappears (see the top panel in Figure 9). In general, the correlations between the 56Ni mass and all other parameters decrease when we use the lower limits. In the bottom panel of the same plot (Figure 9), it is possible to see how the scatter increases using these values. The correlation goes from  to
to  . The fact that correlations become weaker when using lower 56Ni mass limits suggests that one should be careful analyzing such masses when insufficient data are available for their estimation.
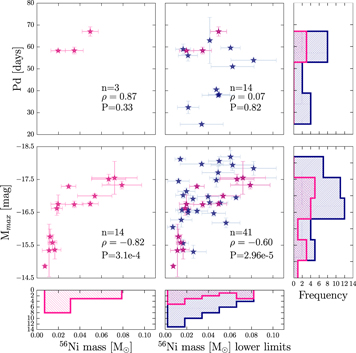
Figure 9. Top: correlations between Pd and the 56Ni mass with the accurate values (left) and including the lower limits (right). Bottom: correlations between Mmax and the 56Ni mass with the accurate values (left) and including the lower limits (right). The accurate values for 56Ni mass are displayed in red. On the top of each figure, n = number of events, ρ = Pearsons correlation coefficient, and P = probability of detecting a correlation by chance. Histograms along the x- and y-axes show the distributions of the various parameters plotted on each axis. Each histogram displays the  found using the Shapiro–Wilk normalization. When the
  , the data set comes from a population that has a normal distribution.
Download figure:
Standard image High-resolution imageContinuing the analysis of Pd, we can see that it has a moderate correlation with pEW( ) of the absorption component and strong correlation with a/e. The correlation coefficients are
  and
and  , respectively. In Figure 10, we present these correlations together with the best-fit line obtained using the linmix_err13
package (Kelly 2007) and the variance with respect to the fit line. The trend shows that SNe with shorter Pd values are brighter, have faster declining light curves, lower pEW(
, respectively. In Figure 10, we present these correlations together with the best-fit line obtained using the linmix_err13
package (Kelly 2007) and the variance with respect to the fit line. The trend shows that SNe with shorter Pd values are brighter, have faster declining light curves, lower pEW( ) of the absorption component and a/e values, and higher velocities; however, the scatter is large. In many cases, this scatter is significantly larger than the that which could be ascribed to the errors on individual data points. This suggests that this scatter is due to differing underlying physics driving diversity in different parameters plotted on each axis. For example, while we argue here that Pd is a good indicator of the hydrogen envelope mass, theory also predicts this parameter to be influenced by the 56Ni mass (Kasen & Woosley 2009). Meanwhile, SN luminosities and velocities will be affected by both explosion energy and the ejecta/envelope mass. Interaction of the SN ejecta with CSM material at early times (e.g., Dessart et al. 2017; Moriya et al. 2017; Morozova et al. 2017) may also play a role in producing dispersion in our presented trends.

Figure 10. Correlations between Pd and six different parameters: Mmax, s2, 56Ni mass,  velocity, pEW of
  absorption component, a/e. On the top of the figure, n = number of events, ρ = Pearsons correlation coefficient, and P = probability of detecting a correlation by chance. In addition, each plot shows the corresponding best fit (linmix_err; Kelly 2007) as a solid orange line, while the orange shaded area indicates the variance with respect to the fit line. Histograms along the x- and y-axes show the distributions of the various parameters plotted on each axis. Each histogram displays the
  found using the Shapiro–Wilk normalization. When the
  , the data set comes from a population that has a normal distribution.
Download figure:
Standard image High-resolution imageThe fact that we see a significant anticorrelation between Pd and s2 is in line with historical understanding of the nature of fast declining SNe II. If Pd is an indicator of the extent of the hydrogen envelope, then it follows that faster declining SNe II have a smaller hydrogen envelope at the epoch of explosion, consistent with previous theoretical predictions (e.g Litvinova & Nadezhin 1983; Bartunov & Blinnikov 1992; Popov 1993; Moriya et al. 2016).
In Figure 11, we test the correlation found by Hamuy & Pinto (2002) between the magnitude and the photospheric expansion velocity. Unlike Hamuy & Pinto (2002), who only used SNe IIP and the  in the middle of the plateau, we use all our SN II sample (no distinction between SNe IIP and SNe IIL) and the magnitude at different phases: at maximum (Mmax), at the end of the plateau (Mend), and at the radioactive tail phase (Mtail). We can see that brighter events (in all phases) display higher expansion velocities, confirming the result of Hamuy & Pinto (2002). The correlations between Fe ii
  velocity (a proxy of the photospheric velocity) at 50 days and luminosity during the optically thick phase are moderate (
 with Mmax and
  with Mend), and strong (
 ) in the radioactive tail phase. However, we again note the outliers in these figures, where the correlation appears much stronger when removing these events (the outliers are mainly the same SNe discussed previously that show abnormal spectral properties). Interestingly, correlations are higher between spectral velocities and Mmax than with Mend (the Standardized Candle Method, SCM, is generally applied using a magnitude during the plateau, more similar to Mend). Analyzing the variance along the best-fit line, we find that the dispersion in velocity is larger in brighter SNe. Although the magnitudes and the expansion velocities are both directly related with the explosion energy, this scatter could suggest an extra influence by an external parameter. In the three main outliers in this plot, we observe signs of weak interaction at early times (see spectra presented in Paper I). In these three obvious cases, but also in other more "normal" SNe II, interaction could play a role in influencing both the magnitudes and velocities observed. CSM interaction is likely to produce more dispersion within brighter SNe II as it will generally increase the early-time luminosity while possibly decreasing velocities, hence pushing SNe II away from the classic magnitude–velocity relation. In addition, the unaccounted for effects of host galaxy reddenning will produce additional dispersion.
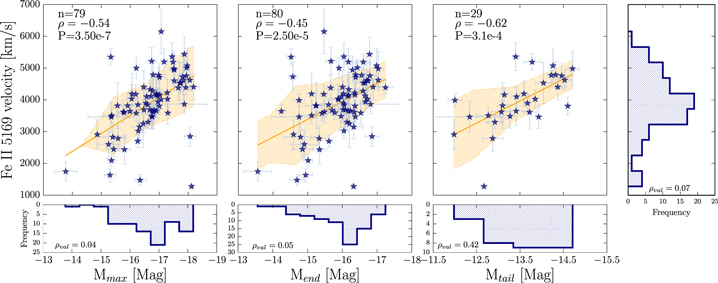
Figure 11. Correlations between (Fe ii λ5169) velocity and the magnitudes: Mmax, Mend, and Mtail. In the top left of each plot the following values are given: n = number of events, ρ = Pearsons correlation coefficient, and P = probability of detecting a correlation by chance. In addition, each plot shows the corresponding best fit (linmix_err; Kelly 2007) as a solid orange line, while the orange shaded area indicates the variance with respect to the fit line. Histograms along the x- and y-axes show the distributions of the various parameters plotted on each axis. Each histogram displays the  found using the Shapiro–Wilk normalization. When the
  , the data set comes from a population that has a normal distribution.
Download figure:
Standard image High-resolution imageThe expansion velocities show a strong correlation with 56Ni mass (see Figure 12). This suggests that more energetic explosions produce more 56Ni. Additionally, the luminosities have a very strong correlation with the 56Ni mass, which supports the results obtained by Hamuy (2003), Pejcha & Prieto (2015a, 2015b), and more recently by Müller et al. (2017). It is possible to see that these three parameters (luminosities, velocities, and 56Ni mass) are related and they can be explained through a correlation of both parameters with explosion energy: more energetic explosions produce brighter SNe with faster velocities (as shown in the models of Dessart et al. 2010a). For those correlations that we do not plot, the reader can see the strength of correlation in Figure 7.
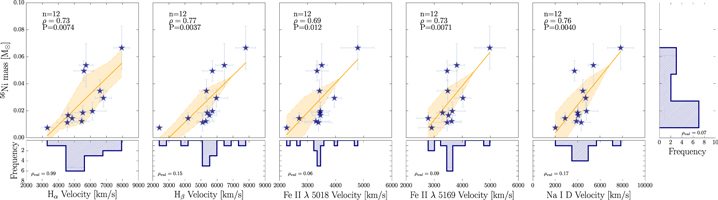
Figure 12. Correlations between 56Ni and the expansion velocities. On the top of the figure, n = number of events, ρ = Pearsons correlation coefficient, and P = probability of detecting a correlation by chance. In addition, each plot shows the corresponding best fit (linmix_err; Kelly 2007) as a solid orange line, while the orange shaded area indicates the variance with respect to the fit line. Histograms along the x-and y-axes show the distributions of the various parameters plotted on each axis. Each histogram displays the  found using the Shapiro–Wilk normalization. When the
  , the data set comes from a population that has a normal distribution.
Download figure:
Standard image High-resolution imageFigure 13 presents correlations between Mmax and the pEWs of  , Fe ii 5018, and Na i D. We observe a weak correlation with the pEW(
 ) absorption component, a moderate (
 ) correlation with pEW(Fe ii 5018), and no correlations with pEW(Na i D).

Figure 13. Top panel: correlations between Mmax and the expansion velocities. Bottom panel: correlations between Mmax and the pEWs. On the top of the figure, n = number of events, ρ = Pearsons correlation coefficient, and P = probability of detecting a correlation by chance. In addition, each plot shows the corresponding best fit (linmix_err; Kelly 2007) as a solid orange line, while the orange shaded area indicates the variance with respect to the fit line. Histograms along the x- and y-axes show the distributions of the various parameters plotted on each axis. Each histogram displays the  found using the Shapiro–Wilk normalization. When the
  , the data set comes from a population that has a normal distribution.
Download figure:
Standard image High-resolution imageIn Figure 14, we repeat the correlations presented by A14, which show that a faster declining SN at one epoch is generally also a fast decliner at other epochs. Although the correlation of s3 and Mmax is moderate, it is driven by an outlier event, SN 2006Y. As A14 noted, this SN presents an atypical behavior in photometry, but here we confirm its strange behavior in the spectra. If we remove this SN from the analysis, the correlations decrease significantly. The correlations between s3 and the velocities are moderate. In the last panel of Figure 14, the correlation between s3 and the pEW(Fe ii 5018) is presented, which, like Mmax is driven by SN 2006Y. Summarizing, s3 has weak correlations with the pEWs and the magnitudes.

Figure 14. Correlations between s3 and five different parameters: s1, s2, Mmax,  velocity, pEW(Fe ii λ 5018). On the top of the figure, n = number of events, ρ = Pearsons correlation coefficient, and P = probability of detecting a correlation by chance. Histograms along the x- and y-axes show the distributions of the various parameters plotted on each axis. Each histogram displays the
  found using the Shapiro–Wilk normalization. When the
  , the data set comes from a population that has a normal distribution.
Download figure:
Standard image High-resolution image6. Discussion
Using numerous defined spectral and photometric parameters, we have searched for correlations between different observed properties of SNe II. We argue that Pd is a better parameter than OPTd for constraining the pre-SN hydrogen envelope mass. Our analysis shows a strong correlation between Pd and s3, arguing that both of these parameters are strongly linked to the hydrogen envelope mass/ejecta mass. While expansion velocities and SN II magnitudes display a significant degree of correlation, they show only weak/moderate correlations with Pd and s3, suggesting that explosion energy—observed through diversity in velocities and luminosity—and hydrogen envelope mass vary somewhat independently between SNe II.
We now qualitatively compare our results with those found in previous studies, both observational and theoretical, attempting to tie these correlations to the underlying physics of SNe II.
6.1. The Influence of Explosion Energy
Hamuy & Pinto (2002) found that the luminosity of the SNe IIP correlates with the photospheric velocity (Fe ii velocity) at 50 days from explosion. Brighter SNe II have higher ejecta expansion velocities. This correlation has enabled the use of SNe II as distance indicators. In Figure 11, we show the same relation, but in generalized form; velocities correlate with SN II brightness at all epochs. In addition, we show that this luminosity–velocity correlation is stronger at peak brightness (Mmax) than during the plateau. Dessart et al. (2013a) has shown that more energetic explosions produce more 56Ni mass, brighter SNe II with faster expanding velocities. This is consistent with our results, and suggests that explosion energy is indeed a primary parameter that influences SN II diversity, and that is traced through SN II brightness, velocities and 56Ni mass.
6.2. The Influence of Hydrogen Envelope Mass
According to theoretical models, faster declining SNe II can be explained by the explosion of stars with low hydrogen envelope mass (e.g., Litvinova & Nadezhin 1983; Bartunov & Blinnikov 1992; Popov 1993 and Moriya et al. 2016). As discussed previously, differences in envelope mass are likely to directly affect the length of the plateau, Pd (we again stress the difference between this parameter and OPTd, with the latter traditionally being assumed to be related to the envelope mass). This is because the plateau, Pd, is powered by the recombination of hydrogen in the expanding ejecta, and the lower the hydrogen envelope mass the quicker the recombination wave reaches its inner edge. The fact that Pd also correlates with s3 (Figure 8) further supports this view, given that higher s3 can be interpreted as being due to a lower ejecta mass (A14) that can trap the radioactive emission (which is powering the light curve at these late epochs). With respect to faster declining SNe II, we observe a significant trend in that SNe II with higher s2 having smaller Pd values, implying that the former is indeed related to the hydrogen envelope mass as has been predicted and discussed for many years. Recent observational works (e.g., A14, Valenti et al. 2016) suggested that the phase between the explosion date and the end of the plateau (historically known as the plateau duration, but here named OPTd) is the key parameter constraining the envelope mass. However, Pd shows higher degrees of correlation with other parameters, in particular, s2 and s3. This suggests that Pd is indeed a better tracer of envelope mass than OPTd. In addition, we find that a/e shows strong and moderate correlation with Pd and s3, respectively, suggesting that this spectral parameter is also a useful tracer of envelope mass (as already argued in Gutiérrez et al. 2014).
From the the correlation matrix (Figure 7), we can observe stronger relations between Pd and s2, as well as with the expansion velocity, than between OPTd and the same parameters. This is because all these parameters are measured during the recombination phase, where they have similar physical conditions. On the other hand, OPTd conveys information on the physical parameters that dominate the early phases of the light curve, plus the hydrogen envelope recombination. Consequently, the correlations are weaker.
In Figure 7, we can see that 56Ni mass shows a strong correlation with Pd, while with OPTd it displays an anticorrelation. Analyzing these findings (Figure 15), we can see that the relation between 56Ni mass and the Pd is produced by only three measurements, and therefore the probability of this correlation being real is very small (P = 0.33). In the case of the OPTd–56Ni mass plot, this anticorrelation is driven by a number of outliers.
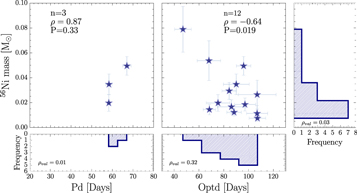
Figure 15. Correlations between 56Ni mass and Pd (on left) and OPTd (on right). On the top of the figure, n = number of events, ρ = Pearsons correlation coefficient, and P = probability of detecting a correlation by chance. Histograms along the x- and y-axes show the distributions of the various parameters plotted on each axis. Each histogram displays the  found using the Shapiro–Wilk normalization. When the
  , the data set comes from a population that has a normal distribution.
Download figure:
Standard image High-resolution imageFrom Figure 7, we also see that OPTd has stronger correlations with Cd, s1, and Mtail than with Pd. The strong relation between OPTd and Cd is expected because the former, by definition, includes the latter one (the same applies to OPTd and Pd; see the OPTd definition in Figure 1). However, Pd and Cd are not related, because they are most likely associated with different physical properties of SNe II. Between OPTd and s1 the correlation is moderate, but again, it is driven by the physical parameters that dominate the early phases of the light curve, which, by definition, are included in OPTd. One interesting correlation is displayed between OPTd and Mtail: SNe II with larger OPTd values are fainter in the radioactive tail phase. This relation may be understood given that the epoch of the Mtail measurement directly arises from the length of OPTd. This means that, if the optically thick phase takes more time, the Mtail will be measured later, which in turn, implies fainter magnitudes (for the same 56Ni mass that is powering the late-time LC). This suggests that, the correlation between OPTd and Mtail is essentially based on the total duration of the optically thick phase, i.e., the photospheric phase.
In summary, we observe three key SN II parameters that we believe are strongly related to the extent of the hydrogen envelope mass at the moment of explosion: Pd, s3, and a/e.
6.3. The Influence of Explosion Energy on the Strength of Spectral Lines
Figures 4–6 display some interesting trends. While the strength of each correlation is complicated by the obvious outliers together with those SNe where no spectral line detection was made, in general, it seems that expansion velocities correlate positively with the strength of the Balmer lines and Na i D, and negatively with the strength of metal lines. The strength of metal lines at any given epoch is most strongly related to the temperature of the line forming region. We therefore conclude that more energetic explosions produce SNe II that stay at higher temperatures for longer leading to lower metal-line pEWs. With respect to the Balmer lines (at least the emission component of  and the absorption component of
  ) this would then imply that more energetic explosions lead to relatively stronger line strengths. The exact physical interpretation of this is unclear. Brighter, i.e., more energetic SNe II also display weaker metal lines (Figure 7 and specifically Figure 13 bottom middle panel). Finally, we also note that differences in progenitor metallicity will also affect the strength of metal lines within spectra, as argued by Dessart et al. (2014) and Anderson et al. (2016; but probably to a lower degree, at least in the current sample).
6.4.
P-Cygni Diversity

A large diversity in the  P-Cygni profile had been shown by Patat et al. (1994) and Gutiérrez et al. (2014). They found that SNe II with smaller a/e values are brighter, and have higher velocities and steeper decline rates. With our analysis at 50 days, we confirm these results; however, the correlations presented here are of lower strength than those in Gutiérrez et al. (2014). This is most likely due to the epoch of the measurements, where in Gutiérrez et al. (2014) measurements were made at
  (where ttran is the transitional epoch between s1 and s2). Here we chose to use epochs with respect to explosion to measure our spectral parameters. This enables us to analyze the full range of events within our sample (in many SNe II, it is not possible to define ttran). The difference in correlation strength therefore arises from the measurements in Gutiérrez et al. (2014) being made when SNe II are likely to be under more consistent physical conditions. Here, using an epoch of 50 days post-explosion different SNe are at different phases of their evolution.
It has previously been argued that the  P-Cygni diversity is directly related to the hydrogen envelope mass (Schlegel 1996; Gutiérrez et al. 2014). The results we present here also support this view, with the absorption component of
  —and in particular the absorption in relation to the emission, a/e—showing correlation with both Pd and s3, parameters that we have already argued are direct tracers of the envelope mass. We also note, however, that the measurement of
  absorption is complicated by the detection and diversity of Cachito (Paper I). It is quite possible, therefore, that the vast majority of the underlying diversity of
  morphology is determined by the hydrogen envelope mass, but complications in the latter's measurement introduce much of the dispersion we see (in, e.g., Figure 10, bottom right).
6.5. Other Comparisons
As discussed in Patat et al. (1994), A14 and more recently Valenti et al. (2016), Galbany et al. (2016), and Rubin et al. (2016), we find that faster declining SNe II are brighter events (see Figure 10). In addition, we also find that SNe II with brighter luminosities have greater expansion velocities and produce more 56Ni. In Figures 12 and 13, we show a few examples of these correlations. Similar results were found by several authors in observational (e.g., Hamuy 2003; Spiro et al. 2014; Valenti et al. 2016; Müller et al. 2017) and theoretical (e.g., Kasen & Woosley 2009) works.
Theoretical models show that an increase in the 56Ni mass leads to an increase in the plateau duration (e.g., Kasen & Woosley 2009 and Nakar et al. 2016). We do not find any observational evidence for such a trend. There are only three data points in the correlation between Pd and 56Ni, therefore strong conclusions are not warranted. If we include lower mass 56Ni limits, we also see no evidence for correlation. This may suggest that observationally Pd does not depend on the mass of 56Ni mass. However, given the inclusion of lower mass 56Ni limits, this warrants caution.
Many authors have found (e.g., Dessart & Hillier 2011) that SN II color evolution could be related with the radius of the progenitor star. Although we include the color gradient ( ) between 10 and 30 days post-explosion in our analysis, we do not find significant correlations associated to this parameter. However, we do note low-level correlation between
  and the strength of Fe ii λ5018 and Fe ii λ5169 (Figure 7), in the direction one would expect: SNe II that cool more quickly (higher
  ) display stronger metal-line pEWs. Cd also does not display significant correlation with other parameters. While above we linked Cd to progenitor radius, as predicted by, e.g., Dessart et al. (2013a), the direct influence of radius on Cd is complicated by any presence of CSM close to the progenitor and may explain the lack of correlations.
Dessart et al. (2014) showed that differences in metallicity strongly influence in the SN II spectra, more precisely in the strength of the metal lines. Anderson et al. (2016) supported this result showing a correlation between the strength of Fe ii λ5018 with the oxygen abundance of host H ii regions. They showed that SNe II exploding in lower metallicity regions have lower iron absorption. Looking for relations with the pEW(Fe ii λ5018), we find a correlation of 0.48 with the Pd and −0.62 with s3. Assuming that the pEW(Fe ii λ5018) gives an idea of the metallicity where the SN explode, this correlation would mean that higher metallicity produces SNe with longer plateaus, which is in the opposite direction of the predictions (e.g., Dessart et al. 2013a). However, when we correlate Pd with the oxygen abundance determined by Anderson et al. (2016), we do not find any relation. As in Anderson et al. (2016) we therefore conclude that (at least in the current sample), the strength of metal lines is dependent more on temperature than progenitor metallicity.
7. Conclusions
In this work, we have presented an analysis of correlations between a range of spectral and photometric parameters of 123 SNe II, with the purpose of understanding their diversity. To study this diversity, we use the expansion velocities and pseudo-equivalent widths for 11 features in the photospheric phase (from explosion to ∼120 days):  ,
,  , Fe ii 4924, Fe ii λ5018, Fe ii λ5169, Sc ii/Fe ii λ5531, Sc ii M, Na i D, Ba ii λ6142, Sc ii λ6247, and O i λ7774; the ratio absorption to emission (a/e) of the
  P-Cygni profile; the velocity decline rate of
  (
( (
( ) and the velocity difference between
  and Fe ii λ5018, and Na i D and Fe ii λ5018 (
 ). From the light curves, we employed three magnitude measurements at different epochs (Mmax, Mend, Mtail); three decline rates (s1, s2, s3); three time durations (OPTd, Pd, Cd); the 56Ni mass, and the color gradient,
  . We searched for correlations at 30, 50, and 80 days, finding that correlations are stronger at 50 days post-explosion. We suggest this happens because at 50 days SNe II are under similar physical conditions: at 30 and 80 days, not all SNe II are in the same stage, some are in the cooling (at early phases) and some are in the transition to the nebular phase (at the end of the plateau).
Our main results are summarized as follows.
- 1.We confirm previous results showing that brighter SNe II have higher expansion velocities. Here we show that this finding is true for all SN II decline rates, and also extends to magnitudes measured at maximum and during the radioactive tail. These results are most easily explained through differences in explosion energy: more energetic explosions produce brighter and higher velocity SNe II. Additionally, we find that more energetic (brighter and faster) events produce more 56Ni.
- 2.We highlight our different definition of the plateau duration (Pd) in this work as compared with the literature: from the s1–s2 transition to the end of the plateau, and conclude that it is a more robust parameter connected to H-rich envelope mass. Indeed, we find that Pd shows much stronger correlations with other parameters than the traditionally used definition (OPTd in our nomenclature). We conclude that Pd, s3, and a/e are most directly affected by the hydrogen envelope mass at explosion epoch.
- 3.While we have found many different trends and correlations between different spectral and photometric parameters of SNe II, hinting at underlying physical trends driving diversity (explosion energy, hydrogen envelope mass, and 56Ni mass), we conclude there is no one parameter dominating these trends.
- 4.As expected, expansion velocities measured for different spectral lines correlate strongly with each other. However, velocities for different lines for individual SNe II are significantly offset, suggesting that they form at different regions at differing distances from the photosphere.
- 5.Brighter SNe have higher velocities, smaller pEWs, shorter a/e, steeper declines, and small Pd and OPTd values.
C.P.G. and S.G.G. acknowledge support by projects IC120009 "Millennium Institute of Astrophysics (MAS)" and P10-064-F "Millennium Center for Supernova Science" of the Iniciativa Cientfica Milenio del Ministerio Economa, Fomento y Turismo de Chile. C.P.G. acknowledges support from EU/FP7-ERC grant No. [615929]. M.D.S. is supported by the Danish Agency for Science and Technology and Innovation realized through a Sapere Aude Level 2 grant and by a research grant (13261) from the VILLUM FONDEN. We gratefully acknowledge support of the CSP by the NSF under grants AST0306969, AST0908886, AST0607438, and AST1008343. This research has made use of the NASA/IPAC Extragalactic Database (NED), which is operated by the Jet Propulsion Laboratory, California Institute of Technology, under contract with the National Aeronautics and Space Administration (NASA).
Footnotes
- *
This paper includes data gathered with the 6.5 m Magellan Telescopes located at Las Campanas Observatory, Chile; and the Gemini Observatory, Cerro Pachon, Chile (Gemini Program GS- 2008B-Q-56). Based on observations collected at the European Organisation for Astronomical Research in the Southern Hemisphere, Chile (ESO Programs 076.A-0156, 078.D-0048, 080.A-0516, and 082.A-0526).
- 12
As the SN 87A-like objects have different light-curve properties than "normal" SNe II, we also exclude them from our analysis.
- 13
A Bayesian approach to linear regression with errors in both X and Y.