

Abstract
In this study, the effect of the core thickness of the sandwich composite on its flexural strength was investigated. E-glass fibre reinforced epoxy-based laminates were used as the skin materials whereas a polyurethane foam was used as the core material with varying thickness of 5, 7, and 9 mm. The experimental/theoretical and FEA analysis were carried out. Results indicated that as core thickness increased, the axial face stresses/core shear stresses and total deformation decreased. This improved the composite structural properties. This improvement was accompanied by a minor increase in weight. A good concurrence was observed between theoretical and FEA results. These results allow us to compare and select optimum parameters for aerospace applications.
Export citation and abstract BibTeX RIS

Original content from this work may be used under the terms of the Creative Commons Attribution 4.0 licence. Any further distribution of this work must maintain attribution to the author(s) and the title of the work, journal citation and DOI.
1. Introduction
Sandwich structures are a class of engineering structural materials with the advantages of low density and high mechanical performance. Sandwich composites (figure 1) fabricated by using the polyurethane (PU) foam as core and face skins made up of glass fibre fabric and epoxy are widely used in aerospace structures [1–5]. These are preferred for various structural applications due to the properties like low weight, high stiffness, corrosion resistance, and cost-effectiveness. The bending test is a unique method to understand the mechanical behaviour of the materials because it provides extensive information about the material properties as compared to the standard tensile or compressive tests. The test samples under bending load were subjected to tensile, compressive, and shear stresses simultaneously and these properties were dependent on the core thickness [6–8]. Thus, the main aim of this study was to understand the effect of core thickness on the flexural and related properties of the sandwich composites. This study will help in the optimization and selection of materials for specific aerospace applications.
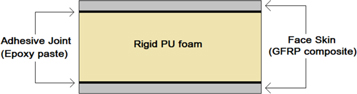
Figure 1. Sandwich composite.
Download figure:
Standard image High-resolution imageIn this analysis, theoretical, experimental, and numerical methods were used to obtain conclusive results for different core thicknesses of the sandwich composite. Numerical/FEA simulation was used to validate the theoretical results [9–11]. Face stresses, deflection, and core shear stresses were recorded and analysed. The simulation also provided layer-wise information [12–14] which may be used for the design and calculations for various aero-dynamic structural applications.
2. Background study
2.1. Theoretical analysis
Standard bending load equations were implemented for theoretical calculations. The load was applied at the mid-span and the sandwich composite was modelled as a beam under bending.
The stresses in the face sheets were given by:

Here, C is ¼ for a 3-point bending test.
For the core, shear stress was expressed as

For the three-point bending test, the total elastic displacement of the load applicator was found by summing the flexural and shear deflections.

Here, P—bending load (N), L—span length (mm), b—composite breadth (mm), t—face skin thickness (mm), d—core thickness (mm),  —face stress (MPa), w—total normal deflection (mm), w1—flexural deflection (mm) and w2—shear deflection (mm).
2.2. Finite-element-analysis
Numerical simulations were conducted to validate the theoretical results. The three-point bending test was replicated through ANSYS. Three different sandwich configurations were considered. The sandwich composite was modelled in the ACP module. Fabrics, orientation, layer thickness, and material properties were assigned suitably. The test loading rollers were designed and imported from Solidworks. A static structural analysis was performed. For meshing, SHELL181 and SOLID182 elements were used for the composite and loading rollers respectively (figure 2). Cohesive interaction between composite layers and bonded contact between the sandwich and the rollers was considered. The combined core and bilinear elastic glass fibre behaviour was accurately modelled for numerical simulation.
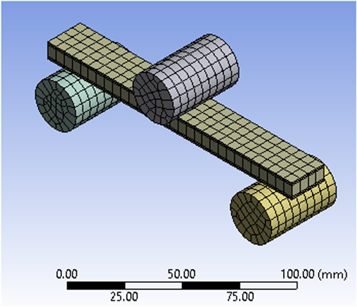
Figure 2. FEA meshing of model along with its loading and support arrangements.
Download figure:
Standard image High-resolution imageThe analysis was divided into sub-steps to obtain a list of response values. Outputs for face skin stresses, core shear stress, and deformation were extracted for each sandwich configuration and recorded. Individual ply wise data was obtained to give insights into the effect of distance from the neutral axis on the aforementioned parameters.
2.3. Experimental
2.3.1. Material selection
The bisphenol-A epoxy resin (Lapox L-12) along with the amine-based hardener (Lapox K-6) was used for the preparation of the matrix. Both of these materials were procured from Atul Ltd, Gujarat (India). The rigid PU foam, procured from the General Plastics, Bangalore, India, was used as the core material. The plain weave glass fibre mat of 450 gsm was procured from M/s Harshdeep Industry, Gujarat, (India) with approximately 1000 filaments per tow with the filament diameter of 10 μm and used to make the skin of the composites. Table 1 shows the material properties of the above-mentioned raw materials (suppliers' data).
Table 1. Properties of the raw materials.
| Constituents | Young's modulus | Poisson's ratio | Density(g cc−1) |
|---|---|---|---|
| Glass fibre | 60 GPa | 0.25 | 2.5 |
| Epoxy | 3416 MPa | 0.33 | 1.2 |
| Foam core (polyurethane) | 73.6 MPa | 0.308 | 0.433 |
2.3.2. Composite fabrication
The setup comprised two flat metal plates covered with aluminum foil, Teflon sheets, epoxy, glass fibre sheets, and foam core panels. The glass fibre and foam were cut to the required dimensions (length 150 mm, width 20 mm) and the foam thickness was reduced as required. The metal plates were covered by Teflon sheets to improve surface smoothness and facilitate easy release. The epoxy and hardener (10:1 ratio by weight) were mixed for 5 min. This mixture, the fibre sheets, and the foam core were applied and stacked on the metal plate as per the required configurations. The epoxy mixture was evenly spread using a roller and brush for each layer to ensure its uniform distribution. Uniform pressure was applied and the composite was pre-cured for 24 h. The laminate was post-cured at 80 °C in an oven for 3 h and then machined to get accurate dimensions. Three composite configurations were prepared (table 2) and their response to the applied load was recorded.
Table 2. Details of composites.
| Number of fibre layers (Skin) | 2 | 2 | 2 |
| Fibre orientation(degrees) | 0/90, ±45 | 0/90, ±45 | 0/90, ±45 |
| Core thickness (mm) | 5 | 7 | 9 |
2.4. Flexural test
The study of flexural properties is essential to designers and engineers for structure design. In this study, the flexural test was performed accurately to characterize the composite properties. The 3-point bending test (ASTM C393) was performed by using an Instron universal Testing Machine (UTM). The dimensions of the test specimens were in agreement with test standards. The samples were placed on two roller supports. The load was applied at the mid-span through a cylindrical applicator (figure 3).

Figure 3. Bending test Instron machine.
Download figure:
Standard image High-resolution imageThe composite may be compared to a beam with minor overhang. Stress varied along with its depth (figure 4). The stress was compressive at C, reduced to zero at N, and became tensile below to it (T). This was due to the simultaneous extension and compression of different layers. The top layers were compressed while lower layers were extended. The neutral axis AB experienced no change in length. In addition to the above, shear stresses were present in the sample as well. In bending, face skins carried the bending stresses while the core-skin interface and the core carried shear stresses.

Figure 4. Stress trend in deflected sandwich laminate.
Download figure:
Standard image High-resolution imageIn this test, the specimens were subjected to shear, compressive, and tensile forces, as they would be under realistic loading conditions. The test parameters are mentioned in table 3. The test output data provided insights into the failure load, deflection properties, and face stresses. This data was then used in theoretical and FEA calculations.
Table 3. Test parameters.
| Parameter | Crosshead speed (mm min−1) | Span (mm) | Span to depth ratio (dimensionless) | Pin diameter (mm) |
|---|---|---|---|---|
| Values | 2.5 | 120 | 13.33 | 25 |
3. Results and discussions
3.1. Experimental results
The 3-point bending test was conducted as per the procedure outlined in the previous section. The material properties and sample dimensions were entered into the controlling programme before testing. Sensors on the UTM recorded forces acting on the test sample and its normal deflection at the mid-span. This data along with material and sample data was used to calculate parameters like maximum load and flexure stress, and generate the load versus deflection graph.
Figure 5 shows the bending test setup and the Load (N) versus Deflection (mm) test results for 5 mm core thickness sample. The result shows that, as the mid-span deflection increased, the load increased proportionally and reached a maximum point. This was the linear elastic region prior to cracking. Crack initiation caused a sudden drop in load, as this reduced the ability of the sample to bear additional load. This was followed by crack propagation, with a constant decrease in load which indicated the progressive failure of the specimen.

Figure 5. (a) Bending test setup and (b) the load (N) versus deflection (mm) test results (sample with 5 mm core thickness).
Download figure:
Standard image High-resolution imageBoth the sandwich composite and its foam core were tested independently. Tests showed that the foam bore only 10% of the load (table 4). This indicated that the face skins were almost entirely responsible for the strength of the composite.
Table 4. Experimental results of the sandwich composite and foam core.
| Sl. No. | Specimen label | Type | Maximum Load (N) | Maximum Flexure Stress (MPa) |
|---|---|---|---|---|
| 1 | 001 | Sandwich | 238.37 | 17.162 70 |
| 2 | 001 | Foam | 27.45 | 1.976 25 |
3.2. Theoretical calculation
Standard bending load formulae and material properties were used to calculate various mechanical properties for the three composite configurations. For all calculations, the force applied was the same (235 N), which was obtained from experimental results (figure 5).
The parameters such as face stresses, mid-span deflection, and core shear stress were calculated (section 2.1) and plotted (figure 6).
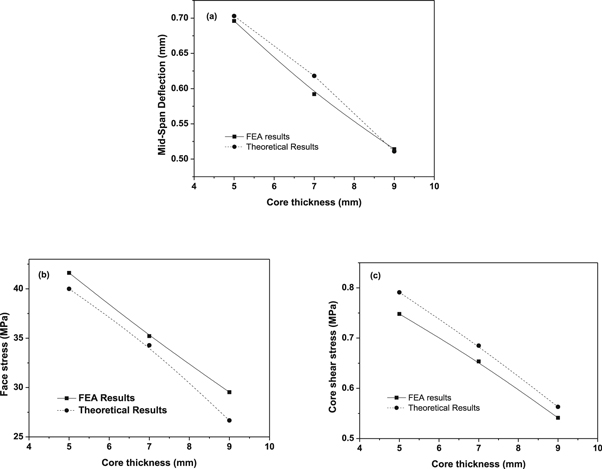
Figure 6. (a) Mid span deflection versus core thickness, (b) face stress versus core thickness, (c) core shear stress versus core thickness of the sandwich composite.
Download figure:
Standard image High-resolution imageIt was observed that as core thickness increased the face stress, deflection, and core shear stresses decreased. As thickness increased, the moment of inertia and stress distribution improved as well. This trend indicated that the composite's mechanical response improved with an increase in core thickness.
3.3. Finite element modelling results
The simulation provided layer-wise properties of the sandwich composite (figures 7–8). Face skins bore the majority of the axial stress (tensile and compressive) and were responsible for composite strength. Here, core thicknesses of 5, 7, and 9 mm were modelled with 2 fabric layers on each face. Figure 6 displays the variation of the calculated mechanical properties on changing core thickness. As the core thickness increase, the properties of the sandwich composite improve. For the same load conditions, stresses and deflection are less. Because of the increase of in core thickness, the cross-sectional area and moment of inertia increased. This led to a decrease in stresses in the face skins, deflection, and core shear stress. The presence of more material distributed the forces thorough a larger region and improved the composite properties without significant weight increase. Thus, the mechanical strength increased with increased core thickness. The numerical model indicated that compressive and tensile stresses are present in the top and bottom face skins respectively. This was in agreement with the expected material behaviour. FEA of the samples for varying parameters provided results that were concurrent with theoretical calculations.

Figure 7. (a) Composite central deflection and (b) normal face stress (tensile).
Download figure:
Standard image High-resolution image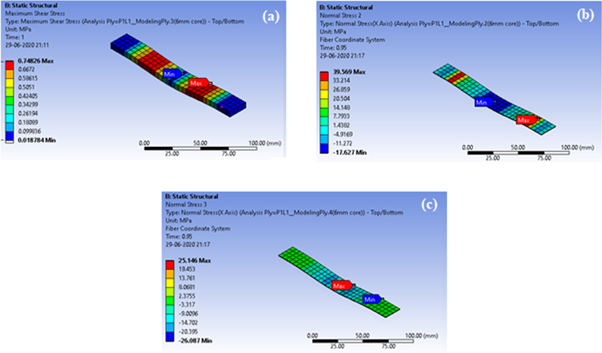
Figure 8. (a) Core shear stress (b) normal stress in the interphase adhesive layer between the top laminate and the core, (c) normal stress in in the interphase adhesive layer between the bottom laminate and the core.
Download figure:
Standard image High-resolution image
Theoretical results were verified through FEA analysis. A good concurrence was obtained between the theoretical calculations and simulation results. Load increased linearly with deflection until the state of crack initiation, beyond which stiffness decreased (figure 6).
The general concurrency of the theoretical results and the simulation validated the theoretical results. It indicates that the assumptions made in the FEM model regarding contact types, geometry, interactions, and boundary conditions were valid.
4. Conclusions
In this paper, a sandwich composite made from glass fibre, epoxy, and foam core was studied. The flexural properties were evaluated using theoretical, experimental, and numerical methods, through the 3-point bending test.
In agreement with standard composite behaviour, bending of the sandwich sample led to the presence of compressive and tensile stresses in the upper and lower face skins respectively. Shear stresses were present in the core. Up to crack initiation, a linear relation was observed between applied load and deflection. The crack on the lower face implied that glass fibre is stronger in tension than in compression.
The variation of properties with respect to PU foam core thickness was studied. An increase in core thickness led to a decrease in axial stresses in the faces, shear stress in the core, and normal deflection. Higher thickness provided a greater moment of inertia. This increased the flexure strength and rigidity without a significant weight increase.
These results will help in material characterization and selection for various aerospace and other applications.
Data availability statement
All data that support the findings of this study are included within the article (and any supplementary information files).