
Abstract
We describe the fabrication and characterisation of a touch-mode capacitive pressure sensor (TMCPS) with a robust design that comprises a graphene-polymer heterostructure film, laminated onto the silicon dioxide surface of a silicon wafer, incorporating a SU-8 spacer grid structure. The spacer grid structure allows the flexible graphene-polymer film to be partially suspended above the substrate, such that a pressure on the membrane results in a reproducible deflection, even after exposing the membrane to pressures over 10 times the operating range. Sensors show reproducible pressure transduction in water submersion at varying depths under static and dynamic loading. The measured capacitance change in response to pressure is in good agreement with an analytical model of clamped plates in touch mode. The device shows a pressure sensitivity of 27.1  0.5 fF Pa−1 over a pressure range of 0.5 kPa–8.5 kPa. In addition, we demonstrate the operation of this device as a force-touch sensor in air.
Export citation and abstract BibTeX RIS

Original content from this work may be used under the terms of the Creative Commons Attribution 3.0 licence. Any further distribution of this work must maintain attribution to the author(s) and the title of the work, journal citation and DOI.
Introduction
Capacitive pressure sensors are used for a broad range of applications due to their high pressure sensitivity, low temperature dependence and low power consumption [1, 2]. A capacitive pressure sensor typically comprises a thin conductive membrane which is suspended above a fixed counter-electrode in a parallel plate geometry [3]. However, the output of such conventional capacitive pressure sensors is nonlinear with respect to the pressure applied perpendicular to the conductive membrane and the sensitivity of the near-linear regime of the sensors performance is low compared to the parasitic capacitance of the sensor. A higher sensitivity is achieved by increasing the suspended membrane area, reducing the dielectric gap or using a membrane material with a lower bulk elastic modulus. Since the conductive membrane is freely suspended in close proximity to the counter electrode, the fabrication of large area membranes with a small air gap often results in membrane collapse driven by capillary forces and stiction issues due to electrostatics during fabrication or device testing [4, 5]. This not only results in reliability issues in high-sensitivity devices, but also calls for complex multiple-sensor architectures for applications where a high sensitivity as well as a large range is required.
Touch-mode capacitive pressure sensors (TMCPS) have shown much promise in overcoming these challenges [6, 7]. A TMCPS is designed to operate in the pressure range where the diaphragm is allowed to contact the substrate with a thin insulating layer between the conductive portion of the membrane and the conductive substrate. The large operating range of these devices makes them attractive for application in harsh environments, such as hydraulic pressure sensing, and tyre-pressure monitoring systems [6, 8]. TMCPSs were initially demonstrated in 1990 by Ding et al [9], in which doped single-crystal silicon membranes were utilised to realise a high-pressure sensors. Since then, TMCPS have been developed using a range of membrane and substrate materials in order to adapt the sensing technology for applications in harsh environments. Beyond single-crystal silicon, other membrane materials such as polysilicon [10], polymer/ceramic multi-layers [11], low temperature co-fired ceramics [12], and silicon carbide [13, 14] have been demonstrated. One limitation of TMCPS is that the optimum pressure range for linear operation is not near the equilibrium pressure point, as a significant force is required to cause the membrane to touch the substrate. Therefore TMCPSs are limited to applications that have a constant pressure bias or a constant electrical bias between the two capacitor plates.
Graphene-polymer heterostructure membranes [15], a multi-layered composite film, comprising a laminate of a CVD-graphene layer and one or more polymer layers, are regarded as a promising material for micro- and nano-electromechanical systems (MEMS and NEMS) due to their high elasticity, tuneable elastic modulus and high tensile strength [16, 17]. Freely suspended graphene-polymer membranes are formed by a transfer method that uses solely the van der Waals adhesion between the graphene layer and the underlying substrate to clamp the membrane in place. By varying the polymers thickness and elastic modulus the bending rigidity and thus the adhesion to underlying substrates of the graphene-polymer membrane can be precisely tailored. In this paper we demonstrate a graphene-polymer TMCPS that is permanently in touch-mode, extending the linear regime of the sensor into the low pressure limit. Moreover, the low elastic modulus of the graphene-polymer and the high yield-strength of the graphene-polymer interface give high pressure sensitivity and a large pressure range for the graphene-polymer TMCPS device.
For the purpose of this study we specifically select a multi-layer polymer structure for its compatibility for underwater applications. In the underwater environment, sensors are in constant submersion in a liquid environment and therefore require being absolutely leak-proof in order to prevent electrical shorts and charge leakages. Moreover, underwater environments often contain corrosive chemicals, therefore demanding that all external facing members of the underwater pressure sensor is resistant to corrosion. For this reason, the graphene-polymer pressure sensor presented in this paper comprises a one polymer layer that has anti-corrosion properties and a second that provides a moisture barrier to protect the conducting graphene layer.
Structure and operation of the TMCPS device
A 3D schematic of the component layers of a TMCPS device is shown in figure 1(a), where a thin conductive membrane lies on top of a square shaped cavity in an insulating layer that is on top of a conducting substrate. When assembled, the conductive membrane and the conductive substrate together form a capacitive structure with the insulating layer acting as the dielectric separating the two capacitor electrodes. In order to describe the behaviour of the TMCPS device, first we identify two distinct operating modes that are defined by the membrane being freely suspended across the cavity (normal mode) or touching the base of the cavity (touch-mode) as shown in figure 1(b). In the later mode, two different membrane morphologies are distinguished by their conformation to the cavity and are thus defined by their capacitive response; The regime in which the membrane initially laminates onto the base of the cavity is known as the linear regime and the regime where the membrane is almost fully conformal to the cavity is known as the saturation regime. Figure 1(c) shows a capacitance curve demonstrating these different operating modes of the device. At low pressures the device is in normal mode, where the membrane is freely suspended across the entire cavity, such as a conventional capacitive pressure sensor. In this operational mode the sensor experiences a sharp increase in sensitivity with pressure as the electromechanical coupling between the parallel plates increases with decreasing air gap.
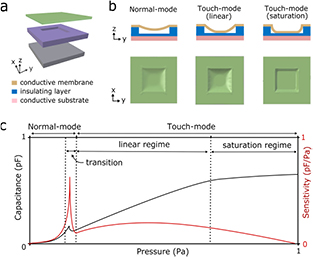
Figure 1. Capacitance-pressure curve describing the behaviour of the TMCPS device. (a) A schematic of the typical device components of a TMCPS. (b) Schematics demonstrating the morphology of the pressure sensor in the three different operation regimes of the device. (c) A plot showing the typical capacitance (black line) and sensitivity (red line) of a TMCPS with increasing pressure. The units in the plot have been normalised as these are highly dependent on the material properties and geometry of the TMCPS.
Download figure:
Standard image High-resolution imageWhen the membrane touches the bottom of the cavity a non-linear relation between capacitance/sensitivity and pressure occurs and the sensor transitions into touch-mode. At pressures above the transition point the device is in touch-mode and the membrane is in direct contact with the insulating layer. In this regime an increase in pressure results in a steady lamination of the membrane onto the insulating layer resulting in a linear capacitance and relatively constant device sensitivity. This regime is typically the desired pressure range of operation. At pressures beyond the linear-regime the membrane lamination saturates and the device sensitivity drops down to zero as the membrane becomes fully compressed into the cavity.
Analytical model of TMCPS
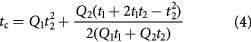
By using the linear elastic approximation for the clamped membrane it is possible to obtain an expression for the capacitance of the device. Whilst our experimental device comprises a square cavity geometry defined by cavity length  and spacer height
  as shown in figure 2, for simplicity of the analysis we assume a cell with circular geometry of radius
  to account for a slight increase in deflection sensitivity of a square membrane with length
  in comparison to a circular membrane with radius
  . We consider the membrane to behave as a uniformly loaded plate with a deflection profile given by

Figure 2. Geometry and material properties of TMCPS device. (a) A schematic cross-section showing the dimensions, forces and capacitance contributions of a single unit cell of the TMCPS device. (b) A schematic cross-section of the TMCPS comprising an array of sensing cells operating in touch-mode. (c) A magnified schematic cross-section shows the electric field lines of the suspended area of a sensing cell. (d) A schematic cross-section of the graphene-polymer heterostructure membrane, showing the material property definitions.
Download figure:
Standard image High-resolution imageWhere  is the radial distance from the center of the cavity and
  is the bending rigidity of membrane [18]. Since the graphene-polymer heterostructure membrane is composed of multiple materials, we apply a composite analysis to determine an effective bending rigidity of the membrane
  . The effective bending rigidity of a composite with
  layers is given by
where  and the subscript
  refer to the material properties of the
  th layer in the compound plate [19]. For example, a compound material comprising two materials as shown in figure 2 has an effect bending modulus of
where
and  represents the length between the base of the compound plate and the effective mid-plane, as shown in figure 2. In this paper, as an example of an industrial use scenario, we construct and demonstrate the operation of this pressure sensor device submerged in a water environment. Thus, we consider a three-layer stack where Material 1 is an electrically conductive layer with thickness
  that forms the top plate of the parallel capacitor, Material 2 is a moisture barrier layer with thickness
  preventing moisture from shorting the capacitive device, and Material 3 is an anti-corrosion layer with thickness
  , protecting the sensor from the saline environment. In order to model the performance of the capacitive pressure sensor we construct an electromechanical model for the capacitance as a function of applied pressure. The capacitance of an entire device with an array of
  pressure sensing cells is given by summing over all of the rows i and columns j of the array given by
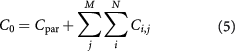
where  is a lumped sum of all of the parasitic capacitances in the pressure sensor chip and
  is the capacitance of sensing cell in row
  and column
  . The capacitance of each cell in the array is given by a sum of the capacitance of the supported area of the membrane
  , the area that is in touch-mode
  and the suspended area
  . For the touch-mode and supported area the sensing cell we assume a parallel capacitor plate model. For the touch-mode area we assume a circular area with capacitance
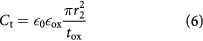
where  is the dielectric constant of the oxide layer,
  is the radius of the touch-mode area of the sensor and
  is the thickness of the oxide.
Similarly for the supported area the capacitance is given by
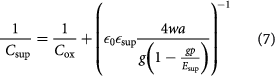
where  is the capacitance of the oxide layer below the support structure given by
  ,
,  is the dielectric constant of the support structure,
  is the width of the support structure, and
  is the elastic modulus of the support structure.
The suspended area of the membrane does not lie parallel to the silicon substrate and is therefore solved by the use of axial symmetry of the boundary condition approximation. By approximating the curved geometry of the suspended area with a simple gradient defined by the angle  the electrical field flux lines are approximated as directional arcs as shown in figure 1(b). The electrical field intensity is therefore given by
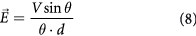
where  is the applied voltage between the two capacitor plates during measurement and
  is a vertical line between a point on the membrane and the silicon substrate, given by
  [20]. Thus the capacitance of the suspended area can be approximates as
  , where the capacitance of the air gap of the suspended section is given by
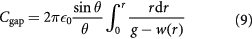
where  is the deflection profile of a the membrane as given in equation (1). When evaluated the final result is given by
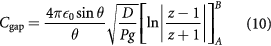
where  is the integrand and the limits of integration
  and
and  are defined as
  and
and  .
.
This electromechanical model along with the material properties (supplementary table 1) (stacks.iop.org/TDM/5/015025/mmedia) and device geometries (table 1) were used to calculate the deflection profiles and graphene-polymer TMCPS performance. A more detailed discussion including the assumptions made during the calculation is given in supplementary discussion 1.
Table 1. Dimensions of TMCPS.
| Membrane dimensions | Cavity dimensions | Substrate dimensions | |||
|---|---|---|---|---|---|
PU thickness,  |
10 µm | Cavity height,  |
10 µm | Silicon oxide thickness,  |
290 nm |
Parylene-C thickness,  |
2.5 µm | Cavity length,  |
450 µm | Active sensing area,  |
14 mm × 14 mm |
CVD-graphene thickness,  |
0.35 nm | Cavity width,  |
50 µm | Total sensor area,  |
20 mm × 20 mm |
Sensors are fabricated from CVD graphene grown on copper foils according to Ciuk et al [22], following a two-step transfer process; the CVD graphene is first coated with 2.5 µm of parylene-C and then transferred from a square piece of copper foil of 15 mm × 15 mm size on to a flat silicon dioxide surface of a silicon substrate (SiO2/Si) using a poly(methyl methacrylate) (PMMA) transfer polymer and a wet transfer process described in supplementary discussion 2 and elsewhere [21] (figure 3, step 1). A 10 µm thick film of polyurethane (PU) is then coated onto the silicon substrate comprising the graphene-parylene-C membrane and is subsequently lifted off the SiO2/Si surface using an aqueous potassium hydroxide (KOH) etch (figure 3, step 2).
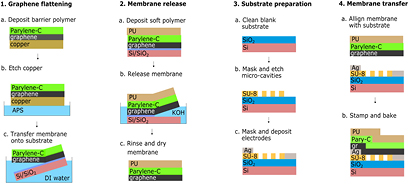
Figure 3. Fabrication steps and schematics of a TMCPS device. (1) Graphene flattening, (2) membrane release, (3) substrate preparation, (4) membrane transfer.
Download figure:
Standard image High-resolution imageWe do not directly transfer the graphene from the copper foil onto the cavity baring substrate because the parylene-C coating on the graphene is not homogeneous due to undulations in the underlying copper foil. On a separate substrate, a SU-8 positive photoresist spacer grid is patterned onto the surface of a 20 mm × 20 mm piece of Si/SiO2 wafer using UV lithography and a mask aligner. On the surface of this chip, surrounding the region of the SU-8 spacer, metal electrodes are formed using a silver epoxy (figure 3, step 3). In the final step the graphene-polymer membrane is aligned and stamped onto the cavity baring substrate using a tape supported transfer process described elsewhere (figure 1, step 4) [21]. By baking this final structure at 90 °C for 30 min, the graphene-polymer membrane is allowed to fully conform to the substrate and any residual moisture inside the cavity is evaporated off. This stage also allows the membrane to soften and deflect into permanent touch-mode without the use of any external pressure. Each sensor array now comprises a monolayer graphene membrane with a parylene-C moisture barrier layer and a PU corrosion-resistant layer of thickness  and
and  on top. The graphene-polymer membrane is suspended over an array of square cavities each of length 2a and height
  . A SiO2 dielectric of thickness tox exists at the base of each cavity, beneath which lies the highly doped Si substrate which acts as the counter electrode of the capacitive sensor. An array of such cavities covers an area of 14 mm × 14 mm. Since the cavities are now sealed by the graphene-polymer membrane, an equilibrium pressure p0 exists within each cavity.
When the external pressure is changed to a value p > p0 (positive pressure), the suspended portion of the membrane deflects in to the cavity and the area of the membrane that is in contact with the SiO2 surface is increased. The deflection of the membrane and increase in membrane-oxide contact area results in a change in capacitance which is measured and correlated to the change in pressure. A detailed description of the entire fabrication protocol is given in supplementary discussion 2. The device dimensions in relation to the schematic of the device are given in table 1. In addition the material properties of the device's constituent materials are given in supplementary table 1.
Physical characterisation of sensor arrays
Characterising the morphology of the graphene-polymer membranes in the TMCPS device is crucial in accurately modelling the pressure sensor performance. In order to characterise the membrane integrity over large areas we employed a series of optical and mechanical techniques. Sensors were first imaged by optical microscopy to check for defects in the graphene-polymer membrane. Figures 4(a) and (b) shows an optical micrograph in reflective-mode at 5× magnification of a section of pressure sensing cells before and after the graphene-polymer membrane has been transferred, respectively. We can identify that the transferred membrane adheres to the center of each cavity by the optical contrast change in the membrane as the blue coloured region is suspended and the grey coloured area is touching the insulating layer.
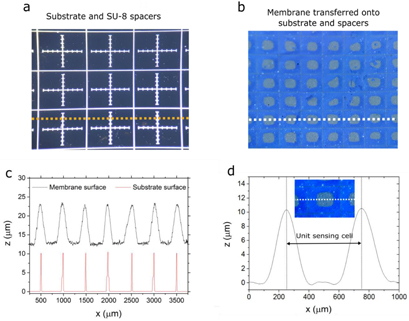
Figure 4. Sensor structure characterisation. Figures (a) and (b) show optical micrographs of the bare substrate with SU-8 spacer structure and the graphene-polymer membrane after transfer onto the substrate with spacer, respectively. The orange and white dotted lines indicate the lines along which the profiles in (c) are measured. Figure (d) shows the surface profile of single sensing unit in its equilibrium state. The inset shows an optical micrograph and the profilometer trace of the cell.
Download figure:
Standard image High-resolution imageSamples with full coverage and a homogenous film transfer were subsequently analysed by a Dektak profilometer and Raman spectroscopy. Figure 4(c) shows the cross-sectional profile of the bare substrate and graphene-polymer membrane along the white dotted lines in optical micrographs of figures 4(a) and (b) respectively. The cross-section shows that the array of membranes are suspended homogenously over the spacer structure. Figure 4(d) shows the cross-section of a single sensing cell of the TMCPS device as indicated by the white dotted line in figure 4(b). The cross-section shows a smooth membrane surface and a homogenous height of the spacer-supported area of the membrane. The slight brow in the contact-region of the cell is attributed to compressive strain on the top surface of the membrane.
In order to confirm that the graphene layer of the membrane maintained its integrity throughout the fabrication process we conducted Raman spectroscopy measurements at multiple reference points across the sample. A detailed discussion of this measurement is given in supplementary discussion 3.
Experimental setup
Fully characterised TMCPS devices with full coverage, 100% yield and minimal defects with dimensions as described in table 1 were electrically contacted to a BNC cable using silver epoxy and mounted onto a custom built sensor housing as shown in figures 5(a)–(c). The sensor housing was then submerged into a water tank of 1 m depth and mounted onto a vertically aligned steel bar that can move along the z-axis using a stepper motor controlled through a LabVIEW program, as shown in figure 5(d). This system allows us to move the sensor housing back and forth in the vertical direction with an accuracy of 0.5 mm. The depth of the sensor was taken as the vertical distance between the water/air interface of the tank and the mid-point of the sensing area of the TMCPS sensor as shown in figure 5(c). The BNC cable used for capacitance measurement was positioned such that motion of the sensor does not affect the parasitic capacitance of the measurement cables. This was achieved by submerging an additional 1 m of cable in the tank such that the section of the cable at the water/air interface is motionless during movement of the sensor. In order to calibrate the drift of the capacitance, samples were measured for 1 h at a depth of 90 cm. During this period we observed a drift of 0.15% of the total capacitance. A detailed description of the pressure sensor calibration is given in supplementary discussion 4.
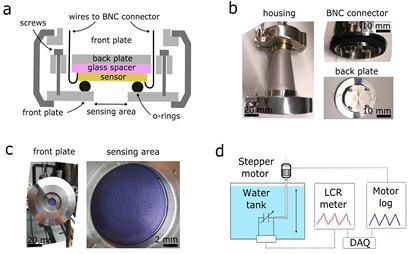
Figure 5. Underwater pressure sensing setup. (a) A schematic of the sensor housing. (b) Photographs of the custom underwater housing, consisting of a conical vacuum flange which has the sensor clamped against a steel plate on the wider end and hermetically sealed BNC connectors on the thinner end. (c) Photographs of the front side of the sensor housing where the sensing area is exposed. (d) A schematic of the measurement setup.
Download figure:
Standard image High-resolution imageThe depth of the sensor was then varied between 50 mm and 850 mm at various speeds and time intervals in order to characterise the sensor response. The effective hydrostatic pressures at these depths are 0.5 kPa and 8.5 kPa respectively. As the pressure difference between the inside and the outside of the cavity is increased by submerging the sensor deeper into the water tank the graphene-polymer membranes are pressed into the cavities with a force proportional to the hydrostatic pressure and hence the depth of the sensor inside the water tank. Simultaneously the capacitance between the graphene layer and the doped silicon substrate is measured using a high precision LCR meter with a resolution of 5 pF in typical operating conditions. Capacitance measurements were taken at 1 kHz with a bias of 1 V, giving a noise limited capacitance accuracy of 0.1%.
Pressure cycling measurements
Devices were compared to identical devices fabricated in parallel, but without an SU-8 spacer structure (without cavities) on the surface of the substrate. This allowed us to confirm that it is truly the deflection of graphene-polymer membranes that is causing the change in capacitance, as shown in figure 6. The device with the spacer structure shows a strong correlation between the pressure and capacitance in comparison to the reference device without the spacer structure, clearly demonstrating the device's sensitivity to pressure due to the presence of the SU-8 spacer structure. We are able to extract the sensitivity of devices containing cavities from the slope of the curve in figure 6 as 27.1  0.5 fF Pa−1.
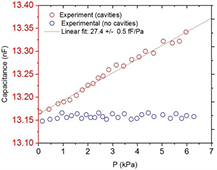
Figure 6. Measured capacitance of the TMCPS device as a function of hydrostatic pressure, P.
Download figure:
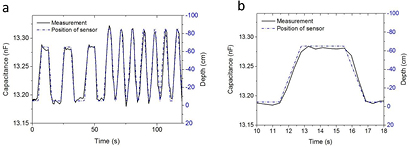
Standard image High-resolution imageNext we cycled devices containing cavities between a depth of 5 cm and 65 cm with a cycling period of 20 s and a 6 s pause at each depth, giving a pressure variation of 0.5 kPa to 6.5 kPa. This was followed by another cycle between 5 cm and 85 cm (0.5–8.5 kPa) with a period of 10 s and without an intermediate pause at each depth. Figure 7(a) shows the measured capacitance as a function of time of these two cycling experiments. The depth of the sensor and effective hydrostatic pressure on the sensor are also plotted in blue for reference. The device's response to the continuous change in pressure is reproducible to a precision of 4% of the first cycle's pressure range and to 6.5% of the second cycle's pressure range. This decrease in reproducibility is attributed to the greater turbulences in the water tank that are created by moving the sensor housing moving through the water at an increasing speed. Moreover, the first cycling period, including the short pauses between varying depths, shows unsettled capacitance signals during each pause. These artefacts are also attributed to the effect of moving water inside the test tank as the sensor housing changes momentum. It was found that these fluctuations are more prominent when the sensor comes close to the top surface of the water tank (5 cm depth). This suggests that the surface movement of the water tank also plays a role in the pressure signal measured.
Figure 7. Depth cycling performance of the TMCPS deviceor. (a) Depth cycling (static pressure variation) of the TMCPS device in a water tank at varying cycling speeds. Capacitance, C values are a total of the device and the stray capacitance from electrical connections. (b) The capacitance of the TMCPS during a single short cycle of 5 s.
Download figure:
Standard image High-resolution image
Finally, we measured the capacitance of the sensor during a single cycle of 11 s between a depth of 50 cm and 65 cm in order to probe the sensor's response time. Figure 7(b) shows that measured capacitance and reference pressure signals correlate well and minimal drift is observed over the complete cycle. Although a slight delay is observed in the response to the cycle, we note that the time resolution of the LCR meter is 0.9 s and is therefore insufficient in giving a reliable measurement of the time delay.
In order to confirm that the observed capacitance change is solely due to the deflection of the graphene-polymer membrane and that the aqueous environment is independent of the device capacitance, we also measured the samples in an oil bath (supplementary discussion 5). Despite the robust design of the TMCPS device, our experimental setup was restricted to pressure range of 0.5–8.5 kPa, however our previous measurements on graphene-polymer membranes comprising a graphene/parylene-C bilayer showed that membrane deflections are reproducible up to a strain of 1.4%, without any slippage at the graphene-polymer interface. Assuming that the graphene/parylene-C interface of the membrane used in this study has a comparative structural integrity as the previously tested graphene/parylene-C interface, using equation (10) and the geometry of the sensor given in table 1, we estimate the TMCPS device can withstand pressures up to 125 kPa whilst maintaining membrane strains below 1.4%. Further details of this estimation are given in supplementary discussion 1.
In order to compare the measured sensitivity value with our electro-mechanical model, we carried out a detailed characterisation of the TMCPS geometry. First we conducted profilometry measurements at 12 randomly distributed 4000 µm traces (as shown by the black curve in figure 4(c)), giving a data set of 64 unit cell profiles. These measurements were then used to extract a distribution and hence an average value for the device geometries including the  value, as defined by the angle in the black dotted triangle in figure 2(b). Using a
  value of
  and the sensor geometry parameters from table 1, the calculated touch-mode sensitivity is 36
  fF Pa−1 according to equation (10). A breakdown of this calculation and the associated assumptions made is given in supplementary discussion 1.
With the graphene-polymer pressure sensor in its early stage of development, it remains a challenge to accomplish a large area array of suspended membranes with uniform performance characteristics. Such non-uniformities arise from a combination of variations in the membrane thickness, inhomogeneties in residual stress in the membrane. The membrane thickness, when measured across the entire array, shows a variation of  3.5%. Considering these variations in the membrane thickness we expect deviations in the TMCPS's sensitivity of 0.4% based on our electro-mechanical model. Further, optical micrographs of the graphene-polymer membranes in touch-mode highlight the variations in membrane stress, as the area in contact with the SiO2 (green region in the optical micrograph in figure 4(b)) often deviates from the rounded square shape, as is expected for a square shaped cavity. Although we could not quantify these variations in stress, the variations in the membrane profiles were considered when modelling the TMCPS devices. A further discussion on the effect of stress on the TMCPS performance is given in supplementary discussion 1.
Increasing the number of cavities within the device therefore provides a strategy towards improving the reproducibility of the device, however this approach is limited due to the cost of increasing the device footprint by adding more cavities. A more direct approach to solve the issue of reproducibility is to improve the control over the method of laminating the graphene-polymer film onto the cavity-baring substrate, thus regulating the mechanical properties of the individual suspended membranes. Moreover, by further reducing the thickness of the polymer layer a reduction in gas-leakage can be obtained as previously shown in the aforementioned study on graphene/parylene-C membranes.
We attribute the difference between our calculation and measurements to a combination of charge leakage through the SiO2 layer and along the surface of the sensor chip as well as due to an overestimation of the analytical model. In order to reduce the noise level in future iterations we propose the use of a pinhole free dielectric or deposition of a barrier layer [23]. In the second case, an overestimation of the touch-mode model is anticipated and the assumed circular symmetry of the model not being entirely accurate in describing the deflection of square shape geometry of the unit sensing cell in the fabricated device. Despite the scaling of the unit cell radius  to account for an increase in deflection sensitivity of a square membrane with length
  in comparison to a circular membrane with radius
  , the square membranes in the experiment incur additional stresses in touch mode that are not accounted for by our current analysis.
Discussion
The TCMPS design is aimed at withstanding high-loadings, resist sudden shocks and give a linear pressure response with a high pressure sensitivity. This makes TMCPSs especially suitable for applications in harsh environments. Harsh environments can typically be subdivided into four categories, including high temperature, corrosion resistant, high loading, and biocompatible. The crucial component in providing a pressure sensor's compatibility with any one of these harsh environments is its membrane, as this member is directly exposed to the environment and determines the intrinsic performance of the sensor. TMCPSs for application in harsh environments typically employ either silicon carbide-based (SiC) or polymer-based membranes. Whilst both of these materials are resistant to corrosive chemicals, their compatibility with high temperatures differs considerably. Whilst SiC-based membranes are relatively stable up to 600 °C, polymer-based membranes are typically only stable up to 150–200 °C [11, 24]. Moreover, the difference in the mechanical properties of these two sensors gives rise to great differences in their pressure sensing performance. Examples of typical SiC and polymer-based TMCPSs are shown in table 2.
Table 2. Comparison of TMCPS technologies.
| Category | SiC-metal [25] | Polyimide-metal [29] | Graphene-polymer (measured) |
|---|---|---|---|
| Membrane elastic modulus | 350 GPa [30] | 8.9 GPa [31] | 0.5 GPa |
| Pressure sensitivity | 5.6 aF Pa−1 | 30 fF Pa−1 | 27.4 fF Pa−1 |
| Operating pressure range | 205 kPa | 35 kPa | >125 kPa |
| Linear range | 122–176 kPa | 20–30 kPa | 0.5–8.5 kPa (0–125 kPa |
| Device area | 3 × 3 mm | 16 × 18 mm | 14 × 14 mm |
The high elastic modulus of the SiC-based TMCPS (350 GPa) operates in a broad pressure range (205 kPa) and requires a large bias pressure (120 kPa) in order to operate in the linear range of the touch-mode [25]. On the other hand, the polymer-based device, including a polyimide-metal membrane, is significantly softer (8.9 GPa), can operate in a lower pressure range (35 kPa) and is almost permanently in touch-mode, making such devices extremely sensitive [26–28]. The combination of a soft membrane material and a unique curved-cavity design lends the TMCPS sensor its excellent sensitivity; however the response is non-linear over a small pressure range.
On further comparison of the performance characteristics of the SiC and polymer-based TMCPS to that of the graphene-polymer TMCPS, the present device positions itself in the property space which currently includes polymer-based sensors, but also extends into the performance gap between polymer and SiC-based sensors in terms of sensitivity and linear pressure range. The present device enables a large pressure range (125 kPa) as the membrane is in permanent touch-mode and the graphene-polymer membrane has excellent elasticity with a high critical strain. The stiffness of the membranes used lies in the lower range of polymer-based sensors (0.5 GPa) and the membrane transfer technique enables the fabrication of densely packed suspended membranes on the wafer scale. Whilst, the stiffness of the graphene-polymer membrane was designed to operate in a specific pressure range, the elastic properties of the membrane can be tuned by modifying either the polymer thicknesses or number of graphene layers.
Furthermore, the graphene-polymer membrane structure aims to overcome several reliability issues faced in current SiC and polymer-based TMCPS technologies. First, the deposition of SiC requires extremely high temperatures that limit the use of on-chip integrated circuitry or necessitate for a high temperature/pressure wafer bonding process in order to deposit the SiC layer. In addition, the use of sacrificial layers in the processing of SiC puts several limitations on device architecture and material design; materials must be resistant to aggressive etchants and have sufficient stability to overcome capillary forces [33, 34]. By transferring the active mechanical component directly onto a pre-patterned micro-cavity in air we avoid trapping liquids that initiate membrane collapse and completely seal the micro-cavity.
Another limitation of existing TMCPS technologies is the non-linear pressure sensitivity and significant hysteresis. This is most common in polymer-based TMCPSs, as the polymer membrane strongly adheres to the bottom of the cavity during touch-mode. This requires complex calibration protocols when operating the sensors and a voltage bias is typically applied in order to reduce the hysteresis [29]. In comparison, the graphene-polymer TMCPS shows a linear response in the entire range it is tested in the present study. Moreover, the graphene/silicon oxide interface at the base of the cavity has a very weak adhesion strength [35]. This enables the TMCPS device to operate without any significant hysteresis.
The present study concerns pressure sensing in underwater environments, whereby the sensor is designed to withstand corrosive environments and high shock loadings, whilst operating in a low pressure range (<10 kPa). Therefore, it is appropriate to also compare the sensor performance to other pressure sensing technologies that are designed to operate in the same application space. An example of other underwater pressure sensing devices is shown in table 3. In order to compare the sensitivities of the devices, the sensitivity of the graphene-polymer TMCPS is converted into µV Pa−1 by considering a typical AC bridge circuit with a capacitance-to-voltage conversion sensitivity of 0.54 µV/fF, giving a pressure sensitivity of 14.8 µV Pa−1 [36]. This places the graphene-polymer TMCPS in the same performance-space as existing piezoresistive pressure sensors.
Table 3. Comparison of underwater pressure sensors.
| Membrane material | Sensing mechanism | Pressure range | Sensitivity | Repeatability |
|---|---|---|---|---|
| LMK 458 (commercial) [37] | Piezoresistive | 0–4 kPa | n/a | 0.25% (accuracy) |
| Si/SiO2/metal [38] | Piezoresistive | 0–2 kPa | 1 µV Pa−1 | n/a |
| LCP-metal [27] | Piezoresistive | 0–1.5 kPa | 14.3 µV Pa−1 | 2.5% |
| PDMS-carbon black composite [39] | Piezoresistive | 0–1 kPa |  13 × 10−6 13 × 10−6 |
14% |
| Graphene-polymer (this work) | TMCPS | 0.5–8.5 kPa (up to 125 kPa) |
14.8 µV Pa−1 |
4% |
LCP = liquid crystal polymer. aPressure at which membrane strain is ~0.4%. bCapacitance to voltage conversion based on AC bridge circuit with sensitivity of 0.54 µV/fF [36].
Although we recognise that the graphene-polymer TMCPS does not out-perform current underwater sensing technologies in terms of repeatability in its current form, the touch-mode structure provides increased durability and an extended operating range which existing technology cannot achieve. Moreover, capacitive pressure sensing has significantly lower power consumption and typically shows an improved thermal stability compared to piezoresistive pressure sensors. Therefore we believe that the graphene-polymer TMCPS has significant advantages over existing underwater pressure sensing technologies.
Whilst we recognise that the reproducibility and hence the accuracy of the graphene-polymer TMCPS presented here is not comparable to commercial pressure sensors, the aim of the present study is to demonstrate the significant engineering benefits, such as ease of fabrication and the ability to develop low-powered, low-cost, arrays with a robust sensor design. Moreover, we identify inaccuracies in the pressure cycling data as engineering challenges which will be addressed by refining the sensor fabrication technique and design. For example, by pre-patterning the CVD graphene before the polymer deposition step in the fabrication of the device, the adhesion of the graphene-base of the membrane to the cavity bottom can be optimised. Further, by integrating the sensors into a protective canal-bore, pressure fluctuations due to water turbulences and surface-chop can be minimised [40].
Considering the performance of the graphene-polymer TMCPS device we envisage both static and dynamic pressure sensing applications in liquid environments. Whilst the initial testing of the device demonstrates the device as a robust level or depth sensor [41], the device can equally be applied to industrial processes, where the pressure of corrosive liquids are monitored [7]. Moreover, the fast response time of the TMCPS device also allows for mid-frequency applications such as MEMS flow sensors or implantation of an artificial lateral line, in which time resolutions of ~0.1 s and pressure resolution of ~10 Pa are required [40]. For high-frequency applications that require a time response on the other of 1 µs and a sub 1 Pa pressure resolution, such as underwater acoustics, the current sensor architecture will require further optimisations.
We also tested the TMCPS device as a force sensor by measuring the capacitance whilst pressing down on the sensing area. A schematic diagram and the pressure response of the force sensor is shown in supplementary discussion 6 and the force-sensor in operation is also shown in the supplementary video. Whilst, we did not perform calibrated force measurements on this device, an estimated pressure of 5 kPa, approximated by a finger applying a uniform force of 1 N across the entire sensor array (194 mm2) showed a capacitance change of 145 pF, giving a sensitivity of 28.4 fF Pa−1. Moreover, this estimated sensitivity is in good agreement with our previous measurements in water. This force-sensor test demonstrates that the graphene-polymer TMCPS could also be used in tactile applications such as touch interfaces or force sensors in robotics. Further, we note that the silicon substrate can be easily replaced for a flexible substrate, as all other materials in the sensor are entirely flexible. This enables the TMCPS device to be mounted onto curved surfaces and allows flexing of the device when its supporting member is exposed to shocks or vibrations.
Beyond this initial demonstration of a capacitive pressure sensor, we aim to develop more sophisticated MEMS and NEMS devices using graphene-polymer membranes. The excellent elasticity and high-temperature compatibility of graphene makes graphene-polymer membranes attractive for pressure sensing in harsh environments, where shock and elevated temperatures would cause significant damage to tradition silicon MEMS. Whilst we note that the polymer layer is likely to be the limiting material in harsh environment applications, the large variety of polymers available as ultra-thin coatings also allows us to fabricate a range of ultra-thin membranes with properties tuned to specific applications, where the polymer layer not only acts as a mechanical reinforcement but also gives additional functionality to the membrane [42, 43]. In view of the latter, we also envisage the use of graphene-polymer membranes in polymer MEMS devices ranging from micron-scale pumps and valves in micro-fluidics [44] and lab-on-chip devices [45] to pressure sensors and actuators in biomedical applications [46].
Conclusion
We have demonstrated the fabrication and characterisation protocol of a touch-mode capacitive sensor with a graphene-polymer membrane as the active sensing material. Using a custom membrane transfer method we were able to fabricate and package devices for underwater depth testing experiments. The device design consists of an array of 28 × 28 SU-8 polymer cavities patterned on a Si/SiO2 substrate that has a thin graphene-polymer membrane partially suspended on top of the SU-8 polymer structure. The fabrication results in a permanent-touch-mode morphology of the graphene-polymer membrane that enables high-sensitivity pressure transduction and is robust to high overpressures and harsh sensing environments. The pressure sensors are tested in a water tank by changing the depth of the sensor relative to the water/air interface of the sensor, causing a change in hydrostatic pressure on the sensor. We measure a pressure sensitivity of 27.4 fF Pa−1 over a hydrostatic pressure range of 0.5 kPa to 8.5 kPa. Finally we discuss the current challenges in state of the art harsh-environment pressure sensing technologies and how graphene-polymer TMCPS can enable highly sensitive devices with a large operating range and excellent reliability.
Acknowledgments
AV and CB acknowledge funding from Engineering and Physical Sciences Research Council (EPSRC) Industrial Cooperative Awards in Science & Technology (CASE) scheme, EP/L505547/1. Authors acknowledge support from Ashley Nathan Smith and Danial Collyer of Merck Chemicals Ltd.
Author contributions
AV & CB conceived and designed the experiments conducted data analysis and interpretation. WS prepared CVD-graphene on copper films. CB & RP conducted fabrication of TMCPS devices. CB conducted characterisation and pressure experiments. CB, RP & AV contributed to drafting this manuscript.
Additional information
Supplementary information accompanies this paper.
Competing financial interests: The authors declare no competing financial interests.