
Abstract
Mycobacterium avium ssp. paratuberculosis (MAP) causes chronic granulomatous enteritis in ruminants. Bacterial growth is still the diagnostic 'gold standard', but is very time consuming. MAP-specific volatile organic compounds (VOCs) above media could accelerate cultural diagnosis. The aim of this project was to assess the kinetics of a VOC profile linked to the growth of MAP in vitro. The following sources of variability were taken into account: five different culture media, three different MAP strains, inoculation with different bacterial counts, and different periods of incubation. Needle-trap microextraction was employed for pre-concentration of VOCs, and gas chromatography–mass spectrometry for subsequent analysis. All volatiles were identified and calibrated by analysing pure references at different concentration levels.
More than 100 VOCs were measured in headspaces above MAP-inoculated and control slants. Results confirmed different VOC profiles above different culture media. Emissions could be assigned to either egg-containing media or synthetic ingredients. 43 VOCs were identified as potential biomarkers of MAP growth on Herrold's Egg Yolk Medium without significant differences between the tree MAP strains. Substances belonged to the classes of alcohols, aldehydes, esters, ketones, aliphatic and aromatic hydrocarbons. With increasing bacterial density the VOC concentrations above MAP expressed different patterns: the majority of substances increased (although a few decreased after reaching a peak), but nine VOCs clearly decreased.
Data support the hypotheses that (i) bacteria emit different metabolites on different culture media; (ii) different MAP strains show uniform VOC patterns; and (iii) cultural diagnosis can be accelerated by taking specific VOC profiles into account.
Export citation and abstract BibTeX RIS

Original content from this work may be used under the terms of the Creative Commons Attribution 3.0 licence. Any further distribution of this work must maintain attribution to the author(s) and the title of the work, journal citation and DOI.
1. Introduction
Mycobacterium avium ssp. paratuberculosis (MAP) causes chronic granulomatous enteritis in ruminants. The corresponding disease, paratuberculosis or Johne's disease, occurs worldwide and has strong economic relevance, especially for dairy farms. The pathogen has also been suggested as being involved in Crohn's disease in humans [1]. Unfortunately, the period of incubation can last for years, and there is no effective therapy, while infected animals can shed huge amounts of pathogens, as described by Antagnoli et al [2]. To estimate the prevalence and control the disease, it is important to have a sensitive and rapid diagnostic option for each animal.
The most sensitive diagnostic method currently available is direct detection of the bacteria via cultural isolation from feces or tissue samples [3]. Due to the long generation time of 1.3–4.4 d [4] and high requirements for the media [5], cultivation on solid media is very labour-intensive and time consuming, often taking 10 weeks or longer. This determines the risk of contamination with yeast or fungi [3]. Cultivation on liquid media was evaluated for its potential to accelerate diagnosis of MAP. Further improvements were undertaken by defining the readout parameters of bacterial growth such as oxygen consumption or gas pressure; unfortunately, these parameters are non-specific, demonstrating only bacterial metabolism. After direct detection of bacteria, identifying the strain is mandatory, for example via polymerase chain reaction (PCR). There is a need for an accelerated, sensitive and specific diagnostic approach. Thus far, alternative diagnostic procedures have not proved sufficiently sensitive, and the labour-intensive procedure cannot be reduced from a two-step to a one-step method [3].
Volatile organic compounds (VOCs) emitted from the bacteria reflect the metabolome of the bacteria during different processes [6]. Furthermore, a number of different clinical studies linked VOC profiles to infections with specific pathogens [7]. However, before analyzing VOC emissions in vivo, precise knowledge is needed about volatiles resulting from pathogens in vitro [8, 9]. Within the last decade, a number of in vitro studies have been carried out, analysing VOCs from different kinds of bacteria, including MAP. These studies aimed to define specific VOC profiles [10, 11]. The kinetics of bacterial growth and subsequent effects on VOC emissions have been addressed for other bacteria by means of proton transfer reaction–mass spectrometry (PTR-MS) [12, 13] and gas chromatography–mass spectrometry (GC-MS) [14, 15]. Such information, however, is still lacking for MAP. In addition, confounding effects generated by different culture media available for the growth of Mycobacteria, and variability between different strains of MAP have yet to be defined. The importance of different ambient and nutrition conditions in vitro has already been demonstrated for other bacteria such as Staphylococcus aureus [13]. Taking all these aspects into account, the aims of our project were:
- (I)to track VOC emissions during cultural growth and correlate them to bacterial replication;
- (II)to define a MAP-related VOC profile;
- (III)to evaluate factors with a significant impact on the composition of VOC emissions and therefore on a possible diagnostic approach.
Hence, we examined effects of different initial inocula, durations of incubation, different culture media and inter-strain variability.
2. Materials and methods
2.1. Study designs
The following three MAP strains (A, B, C) were included in the project:
- (A)MAP 44133 (type-II, reference strain, bovine origin, DSMZ GmbH, German Collection of Microorganisms and Cell Cultures, Braunschweig, Germany);
- (B)MAP 04 A 0386 (type-III, field isolate from sheep);
- (C)MAP 12 MA 1245 (type-II, field isolate from cattle).
Field strains were isolates from tissue or feces, and were isolated and cultivated according to standard protocols recommended by the National Reference Laboratory for Paratuberculosis.
Two independent studies were performed consecutively (figure 1).

Figure 1. Experimental designs of study I (culture media: n = 5, MAP strains: n = 3, and duration of incubation: 5 weeks) and study II (one culture medium, MAP strains: n = 3, and three durations of incubation, i.e. 2, 4, and 6 weeks). MAP—Mycobacterium avium ssp. paratuberculosis.
Download figure:
Standard image High-resolution imageStudy I focused on evaluating the influence of culture media on VOC profiles. The following five media (1–5) were included:
- (1)HEYM: Herrold's Egg Yolk Medium containing Mycobactin J and amphotericin, nalidixic acid and vancomycin (Becton Dickinson, Sparks, USA);
- (2)Sto: Stonebrink Medium with Polymyxin B, Amphotericin B, carbenicillin, trimethoprim, and pyruvate and Mycobactin J (Bioservice Waldenburg GmbH, Germany);
- (3)LJ: Löwenstein–Jensen containing Polymyxin B, Amphotericin B, carbenicillin, and glycerol and Mycobactin J (Bioservice Waldenburg GmbH, Germany);
- (4)Du: Dubos Oleic Agar with Mycobactin J (produced according to accredited instructions from the National Reference Laboratory for MAP);
- (5)MB: Middlebrook 7H10 Medium with Mycobactin J containing oleic acid, albumin, dextrose, catalase and polymyxin B, amphotericin B, carbenicillin and trimethoprim (produced according to accredited instructions from the National Reference Laboratory for MAP).
At least eight vials per medium were used for each of the three MAP strains (A, B, C). In total, 123 vials inoculated with bacteria (about 24 of each medium) were compared to 18 control vials (2–5 of each medium).
For inoculation, three loops of cultured bacteria were added to 4 ml of phosphate buffered saline containing disodium, potassium dihydrogen orthophosphate, and sodium chloride (PBS). The bacterial suspension was thoroughly vortexed and diluted to an optical density of 0.312 ± 0.039, measured via a spectral photometer (Dr Lange Cadas 30, Dr Bruno Lange GmbH, Düsseldorf, Germany), which resulted in a bacterial count of 7.44 ± 13 * 108 cfu ml−1. Dilutions of 10−2, 10−4 and 10−6 were then prepared from the original bacterial suspension. Next, 100 µl of the bacterial suspensions of each dilution were inoculated onto each of six slants of each medium. The vials were sealed with Silicone/Teflon septa (Si/PTFE, PAS Technology Deutschland GmbH, Magdala, Germany). Cultures were incubated at 37 °C in a horizontal position for two weeks and then a further three weeks in an upright position. They were then kept at room temperature (21 ± 1 °C) until sampling (see section 2.2).
Study II aimed to assess the time-dependent formation of VOCs during cultivation. The three MAP strains (A, B, C) were cultivated on HEYM only. In total, 71 inoculated vials and 28 control vials were included in this study.
We added 2 ml of original bacterial suspension containing PBS originating from study I to 8 ml of Middlebrook 7H9 liquid medium containing oleic acid, albumin, dextrose, catalase and polymyxin B, amphotericin B, carbenicillin and trimethoprim (MB-Bouillon, produced according to accredited instructions by the National Reference Laboratory for MAP). This suspension was incubated for 54 d at 37 °C in an incubator shaker (70 rotations per min) in the presence of sterile glass beads. The bacterial suspension was thoroughly vortexed and diluted to an optical density of 0.316 ± 0.015, which resulted in a bacterial count of 3.36 ± 0.14 * 105 cfu ml−1. Dilutions of 10−2, 10−4 and 10−6 were then prepared from the original bacterial suspension. Next, 100 µl of the bacterial suspensions of each dilution were inoculated onto each of 18 slants of HEYM. The vials were sealed with silicone/teflon septa and incubated at 37 °C in a horizontal position for one week and then further in an upright position. Sampling (see section 2.2) was performed after two, four, and six weeks of incubation. Afterwards, all vials were kept in incubation for 11 weeks in total to be able to assess any growth of MAP.
Vials of each medium inoculated with 100 µl PBS instead of bacteria served as control.
Bacterial growth in all vials was visually assessed at regular intervals until the end of the study (11 weeks in total) as shown in figure 1, and was scored from 0.5 to 5 points.
2.2. Sampling protocol
The headspace above MAP cultures and pure media control slants was pre-concentrated by means of needle trap microextraction (NTME), as described by Bergmann et al [16] and Fischer et al [17]. The triple-bed needle trap devices (NTDs, Shinwa Ltd, Japan) were packed with divinylbenzene (DVB, 80/100 mesh, 1 cm), Carbopack X (60/80 mesh, 1 cm), and Carboxen 1000 (60/80 mesh, 1 cm). The NTDs were conditioned in a heating device (PAS Technology Deutschland GmbH, Magdala, Germany) at 250 °C for at least 12 h under permanent nitrogen flow (1.5 bar) before first use, and re-conditioned at 250 °C for 30 min before being applied for pre-concentration of the samples. All vials were warmed up in a dry block heating bath (Unitek, Germany) at 37 °C for 20 min immediately before sampling. Needles were pierced through the septum (figure 2) and 20 ml of headspace was conducted through the needle by inflating and releasing a 1 ml disposable syringe (Transcoject GmbH, Neumünster, Germany). Each NTD was sealed using a Teflon cap (Shinwa LTD, Japan/PAS Technology Deutschland GmbH, Magdala, Germany) before and immediately after collecting the sample.
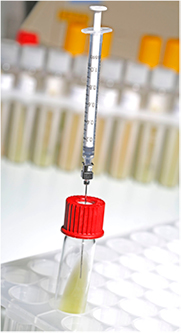
Figure 2. Experimental set up for sampling of headspace above culture media. Photo: FLI (W Maginot).
Download figure:
Standard image High-resolution image2.3. Identification and quantification of substances
VOC analyses were performed by means of GC-MS. VOCs desorbed from NTDs were separated by GC (Agilent 7890A) and detected by mass selective detector (Agilent 5975C inert XL MSD). This principle has been described previously [10, 16, 18]. VOCs were initially identified via a mass spectral library search (NIST 2005 Gatesburg, PA, USA). Subsequent identification and quantification was established by analysis of pure reference substances (the origin of the chemicals can be found in table S1 (stacks.iop.org/JBR/10/037103/mmedia)) and comparison of GC retention times and mass spectra of all selected marker substances.
Using a liquid calibration unit (LCU, Ionicon Analytik GmbH, Innsbruck, Austria), humidified standards of pure references in different concentration levels were produced for NTME calibration. By measuring 10 blank samples and integrating signal areas of baseline for each marker, the substance limit of detection (LOD, signal-to-noise ratio 3:1) and limit of quantification (LOQ, signal-to-noise ratio 10:1) were calculated. VOC concentrations below LOD were set to zero. Table S2 provides confirmed substances through retention time, mass spectra and quantitative parameters such as LOD and LOQ.
2.4. Selection of VOCs
NTME GC-MS measurements resulted in more than 100 individual substances detected in the headspace of vials and quantified by analysis and calibration of pure reference substances (section 2.3). The total concentrations of the volatiles in the headspace of the vials were considered. To differentiate between VOCs originating from the material or the media, the ones arising or being consumed from MAP cultures, and the ones existing in the surrounding air of the laboratory, we compared results from above cultures, above pure media slants and the laboratory room air. VOCs serving as potential marker substances for MAP growth were selected according to the following criteria. (i) The VOC profile was defined after 6 weeks of cultural incubation, based on the assumption that the bacteria underwent exponential growth throughout this period. (ii) The concentration of VOCs above MAP, disregarding strains and bacterial count, needed to be significantly higher than in the surrounding laboratory room air and needed to differ significantly from VOC emissions above pure media.
2.5. Statistical analysis
All 18 control vials and 123 inoculated vials from study I along with 28 control vials and 71 inoculated vials from study II were included in statistical data analyses. IBM SPSS Statistics 19 (version 19.0, IBM Corporation, NY, USA), Microsoft Excel 2010 (Microsoft Corporation, USA) and STATGRAPHICS Centurion XVI.I (version 16.1.18, Statistical Graphics Corporation) were used. Numerical data are presented as medians and percentiles (25–75%). To identify significant differences between two groups of unpaired data, the Mann–Whitney U-test (exact test) was applied. Multifactorial analysis of variance (ANOVA) was used to identify significant influences of methodological effects (different bacterial counts, different duration of incubation) and biological factors (inter-strain variability) on concentrations of selected substances. Values of p < 0.05 were considered statistically significant. For visualization, a three-colour heatmap with normalized values was used. To evaluate the influence of different culture media, a principal component analysis was applied and the scatterplot depicts variations in VOC emissions based on the primary ingredients of the media.
3. Results
3.1. Effects of culture media
Different culture media were associated with remarkable differences in VOC emissions (figure S1) and with significant differences in VOC concentrations.
Substances from all chemical classes were measurable above all five culture media. Some VOCs, like cyclohexane and 3-methylfuran, were emitted from all five culture media, but showed significantly different concentrations. Others were either highly concentrated above egg-containing media (figures 3 and S1) and minimally concentrated above synthetic media, like 3-methyl-1-butanol, or vice versa (e.g. benzene). In contrast, several VOCs were emitted in measurable amounts above some media yet showed concentration values below LOD above other media, for example 2-propylfuran and benzaldehyde. The ingredients of the culture media are listed in table S3. Figure 3 illustrates that the concentration and composition of VOC emissions depended on the ingredients of the media and that score two from the principal component analysis defined a VOC-profile linked to all egg-containing media. Eight VOCs showed significant differences between inoculated and control vials on HEYM, Sto, and LJ, and all inoculated vials had significantly higher or lower VOC concentrations than all individual control vials. The concentrations in MAP-inoculated slopes were lower for 1-propanol, benzaldehyde, and hexanal, and higher for 2-methyl-1-butanol, 3-methyl-1-butanol, 2-hydroxy-benzoate, methyl-acetate, and 3-pentanone.
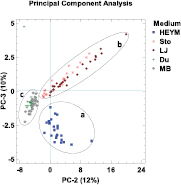
Figure 3. Effects of different culture media on VOC profiles emitted from Mycobacterium avium ssp. paratuberculosis (MAP) cultures. Main ingredients of media were (a) egg yolk, (b) whole eggs, and (c) synthetic nutrients. HEYM—Herrold's Egg Yolk Medium; Sto—Stonebrink Medium; LJ—Löwenstein Jensen Medium; Du—Dubos Medium; MB—Middlebrook Medium. Illustration is based on a Principal Component Analysis (PCA).
Download figure:
Standard image High-resolution image3.2. VOCs related to MAP
According to the criteria for potential marker substances (section 2.4), 43 VOCs assessed above MAP cultures could be identified as potential biomarkers. These marker substances belonged to the classes of alcohols, aldehydes, esters, ketones, nitrogen compounds, aliphatic hydrocarbons, and aromatic hydrocarbons. Table 1 shows absolute concentrations of selected VOCs. Three alcohols (1-propanol, 2-methyl-1-butanol, and 3-methyl-1-butanol), two esters (2-hydroxy-benzoate and methyl acetate), two ketones (2,3-butanedione and 3-octanone), and eight hydrocarbons (2,4-dimethyl-1-heptene, 2,4-dimethylheptane, 4-methyloctane, cyclohexane, ethylbenzene, heptane, octane, and styrene) were not detectable above control vials at all, but were highly concentrated above MAP cultures. In contrast, four VOCs (1-octen-3-ol, 2-methyl-2-butenal, heptanal, and 2-methyl-butanenitrile) had no detectable concentration above bacteria after six weeks of incubation, but showed significantly higher concentrations in control vials. Nine volatiles (1-octen-3-ol, 2-heptanone, all nitrogen containing compounds, and six aldehydes) were less concentrated above bacteria than in the headspace above pure media.
Table 1. Concentration ranges of selected VOC marker substances from all dilutions and all strains to each duration of incubation as well as concentration ranges of VOCs above pure media.
| VOC concnetrations (ppbV) | ||||||||||||||||
|---|---|---|---|---|---|---|---|---|---|---|---|---|---|---|---|---|
| Duration of incubation | ||||||||||||||||
| 2 weeks | 4 weeks | 6 weeks | ||||||||||||||
| Control vials n = 9 | MAP inoculated vials n=24 | Control vials n=9 | MAP inoculated vials n=24 | Control vials n=10 | MAP inoculated vials n=23 | |||||||||||
| VOCs | Median | 25%–75% | Median | 25%–75% | Median | 25%–75% | Median | 25%–75% | Median | 25%–75% | Median | 25%–75% | ||||
| Alcohols | 1-Hexanol | 0.00 | 0.00–0.00 | 0.00 | 0.00–0.00 | 0.00 | 0.00–1.07 | 0.00 | 0.00–17.28 | 1.39 | 0.97–1.78 | * | 16.67 | 8.91–26.87 | ||
| 1-Octen-3-ol | 3.75 | 2.95–4.35 | * | 2.65 | 1.26–3.39 | 8.82 | 6.12–31.66 | 5.81 | 0.00–26.17 | 15.23 | 13.82–17.52 | * | 0.00 | 0.00–0.00 | ||
| 1-Propanol | 0.00 | 0.00–0.00 | * | 56.68 | 41.93–66.69 | 26.32 | 24.73–82.39 | * | 197.66 | 171.38–257.25 | 0.00 | 0.00–0.00 | * | 312.10 | 233.53–365.94 | |
| 2-Methyl-1-butanol | 0.00 | 0.00–0.00 | 0.00 | 0.00–2.16 | 0.00 | 0.00–0.00 | * | 60.16 | 0.00–285.71 | 0.00 | 0.00–0.00 | * | 418.49 | 171.10–884.00 | ||
| 3-Methyl-1-butanol | 0.00 | 0.00–0.00 | * | 2.27 | 0.00–10.75 | 0.00 | 0.00–0.00 | * | 107.69 | 24.35–731.12 | 0.00 | 0.00–0.00 | * | 1111.23 | 441.55–2128.30 | |
| Ethanol | 15 1770.88 | 10 8339.85–16 1897.25 | * | 79 421.14 | 65 296.64–90 746.79 | 13 0143.41 | 11 8756.59–17 2184.93 | * | 18 6880.40 | 16 4514.54–20 4921.97 | 10 6001.65 | 97 647.12–11 9652.75 | * | 19 0886.27 | 16 7780.50–22 2602.97 | |
| Isopropyl alcohol | 2840.89 | 2242.78–2933.06 | * | 1316.80 | 1151.10–1508.69 | 2651.11 | 2193.44–8384.94 | * | 4866.77 | 4405.05–5539.28 | 2676.13 | 2462.09–3042.22 | * | 5160.92 | 4348.04–5957.95 | |
| Aldehydes | 2-Methyl-2-butenal | 11.42 | 8.82–14.18 | 10.28 | 0.81–13.15 | 15.16 | 11.25–53.17 | 0.00 | 0.00–84.44 | 20.38 | 19.47–21.40 | * | 0.00 | 0.00–0.00 | ||
| 2-Methylbutanal | 509.96 | 436.91–762.27 | * | 228.53 | 145.50–336.23 | 798.91 | 634.12–880.36 | 447.07 | 313.42–1349.63 | 950.35 | 908.34–1008.42 | * | 500.32 | 247.50–822.20 | ||
| 2-Methylpropanal | 989.57 | 802.37–1284.71 | * | 542.00 | 173.59–623.19 | 1298.88 | 903.87–1637.97 | * | 2133.89 | 1783.07–2825.36 | 1564.92 | 1366.03–1693.56 | * | 2305.64 | 1951.82–2949.64 | |
| 3-Methylbutanal | 889.73 | 828.34–1366.87 | * | 491.83 | 121.77–725.16 | 1368.65 | 1105.34–1512.17 | 734.33 | 412.52–2469.27 | 1601.98 | 1566.40–1705.13 | * | 677.98 | 331.05–955.59 | ||
| Benzaldehyde | 17.99 | 13.64–21.78 | 15.07 | 7.23–19.17 | 33.07 | 22.64–77.27 | 16.84 | 5.56–102.21 | 47.17 | 43.77–51.91 | * | 5.44 | 4.76–7.88 | |||
| Heptanal | 0.00 | 0.00–0.38 | 0.00 | 0.00–0.24 | 0.64 | 0.47–2.47 | 0.53 | 0.00–2.49 | 1.12 | 1.02–1.30 | * | 0.00 | 0.00–0.29 | |||
| Hexanal | 516.70 | 442.44–700.70 | * | 248.55 | 151.90–536.58 | 1035.60 | 756.99–1613.05 | 265.74 | 4.39–1927.11 | 1293.97 | 1222.15–1385.23 | * | 39.32 | 26.87–47.74 | ||
| Esters | 2-Hydroxy-benzoate | 0.00 | 0.00–0.00 | 0.00 | 0.00–0.00 | 0.00 | 0.00–0.00 | * | 0.87 | 0.00–2.61 | 0.00 | 0.00–0.00 | * | 1.25 | 0.87–1.68 | |
| Methyl acetate | 0.00 | 0.00–0.00 | 0.00 | 0.00–12.20 | 0.00 | 0.00–0.00 | * | 68.99 | 0.00–278.83 | 0.00 | 0.00–0.00 | * | 242.05 | 50.99–324.99 | ||
| Ketones | 2,3-Butanedione | 0.00 | 0.00–5.04 | 1.43 | 0.00–5.62 | 0.00 | 0.00–5.02 | * | 19.39 | 0.00–357.66 | 0.00 | 0.00–5.04 | * | 444.40 | 69.83–586.68 | |
| 2-Butanone | 109.34 | 95.54–154.45 | * | 85.65 | 80.64–92.17 | 185.02 | 135.25–296.06 | * | 495.82 | 447.03–647.94 | 237.79 | 233.95–246.81 | * | 791.22 | 677.04–889.84 | |
| 2-Heptanone | 3.27 | 2.97–4.46 | * | 2.62 | 2.12–3.02 | 14.68 | 9.35–43.22 | 25.77 | 7.49–45.91 | 37.55 | 34.35–43.23 | * | 16.97 | 13.50–19.73 | ||
| 2-Pentanone | 2.57 | 1.93–2.81 | * | 0.90 | 0.00–1.73 | 4.30 | 3.35–7.31 | * | 22.58 | 3.48–25.56 | 9.09 | 8.56–10.26 | * | 37.53 | 31.06–41.00 | |
| 3-Octanone | 0.00 | 0.00–0.00 | * | 6.95 | 0.23–9.10 | 0.00 | 0.00–0.00 | * | 38.20 | 17.27–92.76 | 0.00 | 0.00–0.00 | * | 28.22 | 22.90–48.12 | |
| 3-Pentanone | 1.08 | 0.00–1.30 | 0.00 | 0.00–2.29 | 1.34 | 1.16–2.22 | 44.06 | 0.00–90.86 | 2.38 | 1.79–2.87 | * | 101.00 | 67.95–108.60 | |||
| Acetone | 2234.01 | 1552.06–2566.38 | * | 1158.56 | 1018.42–1286.24 | 3214.39 | 2676.12–5407.98 | * | 5855.76 | 5046.14–6917.00 | 4019.93 | 3747.24–4497.59 | * | 10 488.94 | 9711.61–13 308.25 | |
| NC | 2-Methyl-butanenitrile | 6.82 | 2.70–9.50 | * | 2.81 | 1.93–4.09 | 9.97 | 7.72–13.49 | 14.05 | 0.00–20.75 | 11.59 | 11.27–12.00 | * | 0.00 | 0.00–0.00 | |
| Aliphatic hydrocarbons | 2,4-Dimethyl-1-heptene | 0.00 | 0.00–0.00 | 0.00 | 0.00–0.00 | 0.00 | 0.00–0.00 | * | 6.04 | 0.00–15.39 | 0.00 | 0.00–0.00 | * | 12.30 | 0.00–15.84 | |
| 2,4-Dimethylheptane | 0.00 | 0.00–0.00 | 0.00 | 0.00–0.00 | 0.00 | 0.00–0.00 | * | 6.17 | 0.00–8.05 | 0.00 | 0.00–0.00 | * | 6.12 | 0.00–6.90 | ||
| 4-Methyloctane | 0.00 | 0.00–1.20 | 1.00 | 0.00–1.33 | 0.00 | 0.00–2.87 | * | 6.62 | 5.69–8.62 | 0.00 | 0.00–2.40 | * | 5.82 | 4.97–6.71 | ||
| Cyclohexane | 0.00 | 0.00–0.00 | 0.00 | 0.00–0.00 | 0.00 | 0.00–0.00 | * | 0.46 | 0.38–0.53 | 0.00 | 0.00–0.00 | * | 0.47 | 0.41–0.57 | ||
| Heptane | 0.00 | 0.00–0.00 | 0.00 | 0.00–0.00 | 0.00 | 0.00–0.00 | * | 19.91 | 0.00–380.93 | 0.00 | 0.00–0.00 | * | 582.50 | 406.91–718.86 | ||
| Hexane | 376.45 | 235.24–522.10 | * | 201.96 | 161.19–244.20 | 347.25 | 331.49–374.18 | * | 1437.24 | 1170.67–2292.20 | 462.43 | 408.05–507.96 | * | 3476.58 | 2792.51–4115.54 | |
| Methylcyclopentane | 1.13 | 0.77–1.41 | * | 0.71 | 0.58–0.81 | 1.02 | 0.93–1.43 | * | 3.92 | 3.44–4.63 | 1.41 | 1.29–1.57 | * | 4.63 | 3.58–5.23 | |
| Octane | 0.00 | 0.00–0.00 | 0.00 | 0.00–0.00 | 0.00 | 0.00–0.00 | * | 24.36 | 0.00–191.63 | 0.00 | 0.00–0.00 | * | 274.56 | 197.44–359.03 | ||
| Pentane | 179.66 | 147.42–404.36 | 145.74 | 87.52–199.31 | 475.68 | 316.86–991.95 | * | 2583.12 | 1357.96–20 265.37 | 723.46 | 661.23–854.86 | * | 38 440.38 | 13 094.37–49 128.56 | ||
| Aromatic hydrocarbons | 2,3,5-Trimethyl furan | 0.74 | 0.69–1.16 | 0.00 | 0.00–1.11 | 1.34 | 1.08–2.70 | * | 14.37 | 11.45–16.67 | 1.71 | 1.44–1.91 | * | 22.23 | 19.61–24.02 | |
| 2,5-Dimethylfuran | 0.00 | 0.00–0.00 | 0.00 | 0.00–6.13 | 0.00 | 0.00–38.81 | * | 71.73 | 59.73–77.65 | 31.94 | 27.83–35.01 | * | 101.65 | 76.83–115.47 | ||
| 2-Ehtyl furan | 82.45 | 73.65–123.85 | * | 62.39 | 50.88–69.42 | 243.02 | 191.52–444.01 | * | 674.86 | 555.56–729.66 | 457.92 | 409.97–494.00 | * | 1053.07 | 783.05–1256.56 | |
| 2-Pentylfuran | 5.44 | 4.65–7.76 | * | 0.00 | 0.00–5.66 | 21.84 | 15.01–81.39 | * | 89.69 | 81.57–96.03 | 66.09 | 58.59–69.86 | * | 141.16 | 78.77–167.73 | |
| 2-Propyl furan | 0.00 | 0.00–0.89 | * | 0.00 | 0.00–0.00 | 1.98 | 1.57–7.46 | * | 9.42 | 7.76–10.37 | 5.78 | 5.34–6.40 | * | 15.50 | 7.16–20.83 | |
| 3-Methylfuran | 8.23 | 5.99–12.25 | * | 81.65 | 67.47–98.50 | 14.52 | 10.06–42.52 | * | 608.78 | 363.37–702.79 | 26.83 | 23.38–28.73 | * | 673.71 | 363.70–899.94 | |
| Furan | 239.66 | 168.17–319.91 | * | 44.77 | 37.71–56.79 | 194.94 | 141.41–245.70 | 234.10 | 170.89–291.59 | 221.10 | 179.77–251.01 | * | 411.76 | 283.54–495.78 | ||
| Benzene | 30.64 | 24.52–44.05 | 25.04 | 21.43–30.62 | 49.75 | 35.32–131.62 | * | 203.18 | 186.52–226.85 | 70.45 | 66.04–75.71 | * | 310.80 | 274.78–368.08 | ||
| Ethylbenzene | 0.00 | 0.00–0.00 | 0.00 | 0.00–0.00 | 0.00 | 0.00–0.00 | * | 0.30 | 0.27–0.38 | 0.00 | 0.00–0.00 | * | 0.29 | 0.24–0.32 | ||
| Styrene | 0.00 | 0.00–0.00 | 0.00 | 0.00–0.00 | 0.00 | 0.00–0.00 | * | 2.81 | 2.61–3.10 | 0.00 | 0.00–0.00 | * | 2.45 | 2.04–2.69 | ||
VOC—volatile organic compound; n—number of slants; ppbV—parts per billion by volume; *—indicates significant differences (p-value < 0.05) between inoculated and control vials; NC—nitrogen compound. Italic: MAP > control vials. Bold: MAP < control vials.
3.3. Homogeneity between different MAP strains
Multifactorial ANOVA (table 2) revealed no significant differences between the three MAP strains for 35 of the 43 VOCs, but eight volatiles showed significant differences between different MAP strains. This applied for the reference and the C-type field strain, which showed slightly lower values for some VOCs, for example 2,4-dimethylheptane (figure 4). The lower bacterial density tubes in particular presented higher variation in their VOC concentrations. Figure 4 also illustrates that VOCs above MAP showed significant differences in their concentration compared to control vials, regardless of strain.
Table 2. Effects of inter-strain variability, original bacterial count, and duration of incubation on emitted VOC concentrations above MAP cultures (p-values; multifactorial ANOVA).
| Chemical class | VOC | Strain | Original bacterial count | Period of incubation |
|---|---|---|---|---|
| Alcohols | 1-Hexanol | n.s. | <0.001 | <0.001 |
| 1-Octen-3-ol | n.s. | <0.001 | <0.01 | |
| 1-Propanol | n.s. | n.s. | n.s. | |
| 2-Methyl-1-butanol | n.s. | <0.001 | <0.001 | |
| 3-Methyl-1-butanol | n.s. | <0.001 | <0.001 | |
| Ethanol | <0.05 | n.s. | <0.001 | |
| Isopropyl alcohol | <0.01 | n.s. | <0.001 | |
| Aldehydes | 2-Methyl-2-butenal | n.s. | <0.001 | <0.001 |
| 2-Methylbutanal | n.s. | <0.001 | <0.001 | |
| 2-Methylpropanal | n.s. | n.s. | <0.001 | |
| 3-Methylbutanal | n.s. | <0.001 | <0.001 | |
| Benzaldehyde | n.s. | <0.001 | <0.001 | |
| Heptanal | n.s. | <0.001 | <0.001 | |
| Hexanal | n.s. | <0.001 | <0.05 | |
| Esters | 2-Hydroxy-benzoate | n.s. | <0.001 | <0.001 |
| Methyl acetate | n.s. | <0.01 | <0.001 | |
| Ketones | 2,3-Butanedione | n.s. | <0.001 | <0.001 |
| 2-Butanone | n.s. | <0.001 | <0.001 | |
| 2-Heptanone | n.s. | <0.001 | <0.001 | |
| 2-Pentanone | n.s. | <0.001 | <0.001 | |
| 3-Octanone | n.s. | <0.01 | <0.001 | |
| 3-Pentanone | n.s. | <0.001 | <0.001 | |
| Acetone | <0.01 | <0.01 | <0.001 | |
| Nitrogen compounds | 2-Methyl-butanenitrile | n.s. | n.s. | <0.05 |
| Aliphatic hydrocarbons | 2,4-Dimethyl-1-heptene | n.s. | <0.05 | n.s. |
| 2,4-Dimethylheptane | n.s. | n.s. | <0.01 | |
| 4-Methyloctane | n.s. | <0.001 | <0.001 | |
| Cyclohexane | n.s. | <0.001 | <0.001 | |
| Heptane | n.s. | <0.001 | <0.001 | |
| Hexane | n.s. | <0.001 | <0.001 | |
| Methylcyclopentane | <0.05 | <0.001 | <0.001 | |
| Octane | n.s. | <0.001 | <0.001 | |
| Pentane | n.s. | <0.001 | <0.001 | |
| Aromatic hydrocarbons | 2,3,5-Trimethylfuran | <0.05 | <0.001 | <0.001 |
| 2,5-Dimethylfuran | n.s. | <0.05 | <0.001 | |
| 2-Ehtylfuran | n.s. | <0.01 | <0.001 | |
| 2-Pentylfuran | n.s. | <0.001 | <0.001 | |
| 2-Propylfuran | n.s. | <0.001 | <0.001 | |
| 3-Methylfuran | n.s. | <0.001 | <0.001 | |
| Furan | <0.001 | <0.05 | <0.001 | |
| Benzene | <0.05 | <0.01 | <0.001 | |
| Ethylbenzene | n.s. | <0.05 | <0.001 | |
| Styrene | <0.001 | n.s. | <0.001 | |
VOC—volatile organic compound; n.s.—not significant (p-value ⩾ 0.05); strain—A reference strain from cattle, B field strain isolated from sheep, C field strain isolated from cattle; original bacterial count—original suspension 3.36 ± 0.14 * 105 cfu ml−1 and dilutions of 10−2, 10−4, and 10−6; duration of incubation—two, four or six weeks.

Figure 4. Effects of inter-strain variability on concentrations of emitted VOCs. ppbV—parts per billion by volume; #—significant difference in concentrations between inoculated slants and corresponding control vials (p-value < 0.05); MAP—Mycobacterium avium ssp. paratuberculosis; A—reference strain (bovine origin); B—field strain isolated from sheep; C—field strain isolated from cattle; °—values are 1,5-3 interquartile ranges (IQR) away from median; *—values are beyond 3 IQR.
Download figure:
Standard image High-resolution image3.4. Effects of initial inoculum and duration of incubation
Due to the different dilutions of the original bacterial suspension, an exponentially increasing bacterial count prevailed in inoculated vials which led to significantly different growth: the higher the original bacterial count, the better the bacterial growth. The original bacterial count ensured significant differences for 36 of the 43 VOCs, except for 2-methyl-1-butanol, ethanol, isopropyl-alcohol, 2-methyl-butanenitrile, 2,4-dimethylheptane, and styrene (table 2). The multifactorial ANOVA for the period of incubation resulted in significant concentration differences for 41 of the 43 VOCs, except 1-propanol and 2,4-methyl-1-heptene (table 2). After two weeks of incubation, visually apparent growth was already seen in vials with high bacterial count, while most vials with low bacterial count did not show apparent growth after four or even six weeks of incubation. After two weeks of incubation, VOC concentrations of different bacterial counts were all similar to each other (figure 5(a)), even though vials with high bacterial density showed visible bacterial growth. On the other hand, after four weeks of incubation there were several vials without visual bacterial growth, but significant emissions of 34 VOCs (figure 5(b)).

Figure 5. Effects of kinetics illustrated in a heatmap with normalized data of all selected VOCs from Mycobacterium avium ssp. paratuberculosis (MAP) cultures on Herrold's Egg Yolk Medium as well as from pure media slants pre-concentrated after two, four, and six weeks. Arranged by (a) duration of incubation and (b) visually assessed bacterial growth at time point of sampling; N.C.—nitrogen containing compounds.
Download figure:
Standard image High-resolution image3.5. Patterns of VOC profiles related to bacterial density
After two weeks of incubation, VOC concentrations of MAP resembled control vials, while most VOC concentrations changed significantly after four weeks of incubation. Three different patterns of MAP-related VOCs were obvious (figure 6). (i) Concentrations of 34 VOCs above MAP were directly related to increasing bacterial density, either by initial inoculum or by bacterial growth over time. Some of these substances decreased after reaching a peak, for example 2-hydroxy benzoate, and hexane (figure 6(a)). (ii) Other VOCs kept increasing without reaching a peak, for example 2-methyl-1-butanol and 2-butanone (figure 6(b)). (iii) In contrast, concentrations of nine VOCs decreased significantly with increasing bacterial density up to a concentration lower than LOD (figure 6(c)). A remarkable pattern was shown by 2-heptanone, which presented decreasing concentrations with increasing initial bacterial count, but increasing concentrations within the dilution with increasing duration of incubation. Also, 2-heptanone and six aldehydes (except 2-methylpropanal) represented a special instance of this pattern. VOC concentrations were significantly higher in vials with low bacterial density than controls and decreased further with increasing bacterial density to lower values than controls (figure 6(c), 2-methyl-2-butenal, figure 5(b)).

Figure 6. Effects of bacterial density (by original bacterial count and duration of incubation) on concentration of emitted VOCs. ppbV—parts per billion by volume; #—significant difference (p-value < 0,05) in concentration between inoculated slants and corresponding control vials; °—values are 1,5—3 interquartile ranges (IQR) away from median; *—values are beyond 3 IQR.
Download figure:
Standard image High-resolution image
Remarkable time-dependent changes in the VOC concentrations in the headspace above control slants were also noted. With increasing duration of incubation, all VOCs presenting concentrations higher than LOD increased (figures 5(b) and 6).
4. Discussion
4.1. Metabolism of MAP
As the bacterial density of MAP increased, either by initial inoculum or by bacterial growth over time, the concentrations of the volatiles emitted could be assigned to three different patterns (figure 6). We speculate that VOCs with decreasing concentrations originated from the media and were consumed by replicating MAP. Volatiles with increasing concentrations most likely originated from MAP and could be intermediates or metabolites of several pathways or could function as signaling substances. VOCs which reached a peak had similar origin but either the metabolic pathways stopped due to reduced replication, or synthesis and degradation of substances leveled out, because other metabolic pathways took over. Metabolic regulation always depends on ambient conditions such as available surface area on the medium, nutrient supply, competitors and messenger substances. High levels of emitted aldehydes above vials without visible bacterial growth pointed to the importance of these substances in metabolism of MAP. These could be messenger substances or metabolites in the signaling system for environmental adaptation, comparable with proteins responding to stress like heat, hypoxia or nutrient starvation [19, 20].
The literature contains some studies examining parts of metabolic pathways of Mycobacteria. The cell wall of Mycobacteria presents many specific molecules. As described by Dhimann et al and Appelmelk et al [21, 22], lipoarabinomannan (LAM) suppresses the host's macrophage functions. The core of the molecule is linked to α-arabinofuranan and D-galactofuran, and is mainly built during the logarithmic phase of bacterial growth. Furans can be generated during LAM synthesis. Mycolic acids, a formation of long-chain fatty acids, ketones and alcohols [23], are a special feature of the cell wall of Mycobacteria. During synthesis of mycolic acids, esters [24, 25] may also be generated. Due to the structure of mycolic acids, branched hydrocarbons may be generated via cleavage. However, the origin of VOCs is mostly unknown and is subject to speculation.
As described by many authors, Mycobacteria must adapt metabolically to in vitro conditions [26]. Russell et al [27] described primary carbon source changes from host-derived lipids in vivo to glucose and glycerol in vitro. This may explain differences in VOC emissions above different media. Future studies should focus on elucidating the origin of VOCs in metabolic pathways and the effects of different culture conditions.
4.2. VOCs indicating bacterial growth of MAP
For diagnostic purposes, VOCs above MAP need to differ significantly from VOCs above pure media slants. More than 100 different substances were detectable over MAP cultures. After applying the selection criteria, only 43 VOCs remained more concentrated than the surrounding laboratory room air and those differing significantly between inoculated and pure media slants. The concentration above MAP strains could be either higher or lower than those above control slants. Overall, we included 43 volatiles in the VOC profile. Our results agree with those from an earlier study by Trefz et al [10]. Both projects resulted in about 40 volatiles belonging to the same chemical classes. About half of these were included in both VOC profiles and showed the same concentration pattern. The variation could be due to numerically larger experimental groups or different culture media and incubation duration. In vitro VOC profiles of M. tuberculosis described by Syhre et al [28] differed from those defined in this project for MAP. To confirm the suitability of VOC analysis for diagnostic applications, more detailed studies comparing many other Mycobacterium species are necessary.
4.3. Importance as a diagnostic approach
To display a diagnostic benefit, VOCs need to be independent of biological (inter-strain variability) and methodological factors (culture media, bacterial count, duration of incubation).
4.3.1. Biological factors
For most selected VOCs, we were unable to find significant inter-strain variability between MAP type-II (strain A and C) and type-I/III (strain B). However, the VOC concentrations of the strains originating from cattle (A, C figure 4) seemed to reach slightly lower values than those isolated from sheep (B). This could simply be a sign of weaker growth, which could be partially verified by visual assessment of the slants. On the other hand, strains A and C presented similar VOC concentrations, especially at low bacterial density. A larger number of isolates needs to be investigated to clarify whether the distinct genotypic differences between type-II and type I/III [29, 30] contribute to significant differences in VOC profiles.
4.3.2. Methodological factors
To achieve good sensitivity of bacterial cultivation [5], a few different culture media adapted especially to MAP can be used. It is therefore necessary to define a VOC profile which is valid for all these media. Our results suggest this is only possible for egg-containing media or media with mainly synthetic ingredients.
Compared to control slants, the results of this project showed that VOCs were released in detectable and distinguishable amounts after a period of adapting to ambient conditions, regardless of the initially inoculated bacterial count. Those used in this project represented bacterial amounts in fecal samples collected from cattle for diagnostic reasons. Animals with about 104 colony forming units (cfu) of MAP per gram feces are considered super shedders [31, 32]. This complies with the original undiluted bacterial suspension (100) in this project. Hence, the dilutions 10−2, 10−4, and 10−6 represent bacterial amounts in samples of low shedding animals without symptoms. Thirty-four of 43 VOCs showed significant emissions above inoculated slants without apparent bacterial growth. VOCs which were not detectable over pure media slants at all require special attention. These 15 VOCs (three alcohols, two esters, two ketones, and eight hydrocarbons) are particularly promising for possible diagnostic use. These volatiles were not emitted from any medium, but were generated by all MAP strains.
Unfortunately, most of these VOCs seem to be emitted only after a particular incubation period. Thirteen VOCs displayed significant differences in concentration for all dilution stages after four weeks of incubation. Significant concentration differences compared to control vials, which were independent of bacterial density, are also particularly promising for possible diagnostic use. 1-propanol and 3-methylfuran already showed reliable concentration differences at all dilution stages after just two weeks of incubation. However, at this early stage VOC emissions were low and unstable. Some vials displayed visually detectable growth but no VOC emissions. This could be due to the persistence of MAP while adapting to the medium and ambient conditions, which can lead to reduced metabolism. On the other hand, the discrepancy between visually apparent growth and lack of detectable VOCs indicates a need to adjust the methodology to increase sensitivity by decreasing LOD and LOQ.
5. Conclusions
This study revealed a MAP-related VOC profile that included 43 volatiles. The composition of VOC emissions changed with increasing bacterial density, and therefore displayed different stages of growth and different stages of metabolism. Since each VOC presented unique courses of concentration, a fixed profile is unsuitable for future diagnostic purposes. Instead, a more flexible or floating system which considers different VOC patterns is needed. From a diagnostic perspective, inter-strain variability and initial inoculum are less important or even negligible. In contrast, methodological factors, such as duration of incubation and ingredients of the culture media need to be standardized very carefully because they significantly affect the VOC profile. Hence, different ambient conditions are causing different stages of metabolism and growth of bacteria as well as different VOC emissions. This is important information for future developments towards in vitro testing of bacterial growth.
The results also stress the importance of in-depth knowledge about influences on VOC composition before defining reliable and accurate marker sets for diagnostic purposes for any bacteria.
How conclusive the results are for other Mycobacteria than MAP or for MAP infections in vivo, respectively, remains to be elucidated in future research.
Acknowledgments
The authors are very grateful for the excellence assistance of Sandy Werner. We are also very thankful to all involved members from ROMBAT breath research team in Rostock. This project was funded by Deutsche Forschungsgemeinschaft (DFG) under Grant no. RE 1098/4-1, RE 1098/4-2, SCHU 1960/4-1 and SCHU 1960/-2. The funder had no role in study design, data collection and analysis, decision to publish or preparation of the manuscript. Finally, we wish to extend our gratitude to the anonymous referees for the careful reading of the manuscript.
Conflict of interest
None of the authors of this paper has a financial or personal relationship with other people or organizations that could inappropriately influence or bias the content of this paper.