

Abstract
The extreme precipitation during August 2018 in Kerala, India was catastrophic, triggering one of the worst floods in history. There is growing evidence of human-induced climate change in driving hydroclimatic extremes across the globe. However, whether and to what degree the 2018 flooding event in Kerala was influenced by climate change has yet to be fully understood. To this end, we present the first formal attribution analysis of the event, using the probabilistic event attribution (PEA) framework. Three methods using (i) Historical and HistoricalNat runs from CMIP6 (general circulation models-based method), (ii) observed records from 1901–2018 for two periods, split at 1950 (time-slice method) and (iii) observations that are scaled to 1901 and 2018 climates (scaling method), are considered for quantifying the risk ratio (RR) of the event. Using an objective approach, the 2018 precipitation event is defined by the return period of the 4 day cumulative precipitation over the Periyar River Basin (PRB), during 15–18 August, 2018. The subsequent flood event is characterized by the return period of the 1 day maximum streamflow at one of the outlets of the PRB, where maximum impact during the event was reported. The results from multiple methods are consistent, suggesting that the event is exceptionally less likely to have been caused by anthropogenic climate change, with RR for the precipitation and flood events ranging from 0.31 to 0.82 and 0.55 to 0.8, respectively. The role of wet antecedent soil moisture conditions, which is found to be the primary driving factor of floods in the PRB, is also found to be unchanged between simulations with and without climate change. Our results highlight the challenges in unequivocal discerning of the climate change signal on regional hydrological events and emphasize the importance of better consideration of local confounding interventions in PEA studies.
Export citation and abstract BibTeX RIS

Original content from this work may be used under the terms of the Creative Commons Attribution 4.0 license. Any further distribution of this work must maintain attribution to the author(s) and the title of the work, journal citation and DOI.
1. Introduction
Extreme precipitation and floods affect millions of people in India by resulting in loss of lives and property, and damage to agriculture. Such events are increasingly common in recent decades, and are expected to become more frequent under future climate change (Goswami et al 2006, Min et al 2011, Mukherjee et al 2018).
In August 2018, the state of Kerala (figure 1(a)) experienced the worst flood of the century (Sankar 2018, Hunt and Menon 2020), affecting 5.4 million people and claiming over 400 lives. The post-disaster assessment commissioned by the Government of Kerala estimated the economic loss to be more than $3.8 million (Central Water Commission 2018). The state received anomalously high precipitation (164% of the long-term average) during 1–19 August 2018, which occurred as two separate episodes from 8–10 August and 14–19 August (figures 1(e) and (f); Sudheer et al 2019). The second spell was characterized by an active depression over the coast of Odisha (figure 1(d)), which increased the moisture flux from the Arabian Sea and caused near-saturated atmospheric conditions over the Western Ghats region of Kerala, leading to heavy downpours (Vijaykumar et al 2021) that triggered the flood event. Mishra and Shah (2018) reported that the extreme precipitation and subsequent flooding in August 2018 in Kerala were unprecedented over a 66 year record.
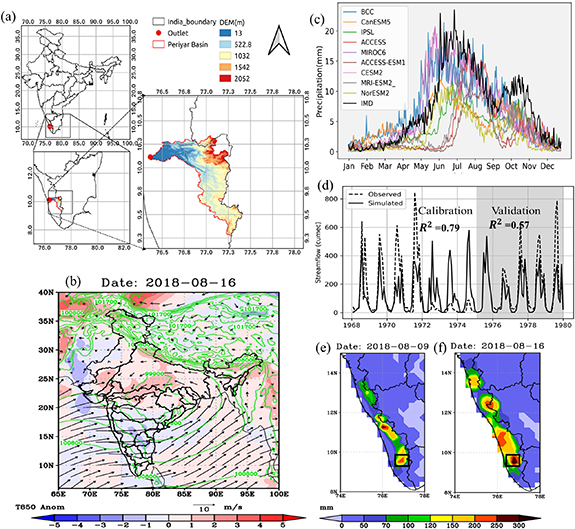
Figure 1. (a) Study area with topography of the PRB. (b) Winds (arrows) and mean sea level pressure (MSLP, contours) along with temperature anomaly at 850 hPa and on 16 August 2018 from ERA5 reanalysis data. (c) Basin-averaged historical climatological daily mean precipitation in the PRB from CMIP6 models (colors) and observations from the India Meteorological Department (IMD, black). (d) Comparison of monthly observed (dashed line) and variable infiltration capacity (VIC) simulated (solid line) streamflow at the Neeleshwaram gauge station in PRB for the calibration and validation periods. (e), (f) Observed precipitation by the IMD on 9 August and 16 August 2018 along with the center of the storm (black box, 9.375 N, 76.875E).
Download figure:
Standard image High-resolution imageFor extreme weather events, probabilistic event attribution (PEA) studies help answer the question: 'to what extent can the event be attributed to a particular cause?' (Philip et al 2020) and have been extensively used in the recent past for such events across the globe (Herring et al 2021).
The PEA framework uses observed data and climate model simulations of the factual (with climate change) and counterfactual (without anthropogenic emissions) worlds, for quantifying the risk of the event that is attributable to human-induced climate change (Pall et al 2011, Schaller et al 2016, Stott et al 2016). Widely applied to precipitation and flood events globally (Eden et al 2016, Schaller et al 2016, van Oldenborgh et al 2017, Philip et al 2019), previous applications of the PEA framework to Indian events include studying the 2013 heavy precipitation and flooding in Uttarakhand (Kumari et al 2019) and the 2015 heavy rainfall of Chennai (van Oldenborgh et al 2016).
In this study, we present the first formal PEA analysis of the 2018 heavy precipitation and flood event in Kerala, intended for attributing the event from the climate and impact perspectives, respectively. Some previous studies find the event unprecedented (Mishra and Shah 2018) or unusually rare (Sudheer et al 2019), and associate unique extreme meteorological processes with it (Vijaykumar et al 2021). While historical climate change is reported to have actually reduced the intensity of the event (Hunt and Menon 2020), future climate change might exacerbate such events under warming scenarios (Hunt and Menon 2020). PEA analysis is a global standard and accepted scientific protocol (Philip et al 2020) for investigating the role of anthropogenic climate change in individual extreme events, which motivates a PEA analysis of the 2018 heavy precipitation and flooding event in Kerala.
While Hunt and Menon (2020) present a storyline-based (Shepherd et al 2018) attribution analysis of the event, this study offers a complementary probabilistic approach (Philip et al 2020), bringing the additional components of (i) an objective event definition to determine the relevant spatio-temporal scales based on rarity of the hazard (Cattiaux and Ribes 2018) rather than a pre-defined large area where impacts were felt non-uniformly, (ii) accounting for changes in floods through streamflow with the use of a semi-distributed hydrologic model that has been calibrated to reproduce catchment-scale processes, (iii) the individual roles of extreme precipitation and initial hydrological conditions (IHCs) in flooding, and (iv) use of multiple attribution approaches based on both observations and model simulations, that can strengthen the robustness of the results (Lewis et al 2019b).
Previous studies analyzing this event differ in (i) the research question asked, (ii) the choice of spatial domain, (iii) the choice of hydrologic models for simulating streamflow and flood, and (iv) the duration over which the models are run, among other factors. While it is not possible to reconcile these differences in a single study, we present a structured analysis for investigating the change in likelihood of the precipitation and flood event due to anthropogenic climate change. The Periyar River Basin (PRB), which was one of the most impacted areas (Central Water Commission 2018, Sudheer et al 2019) is selected for this study. From figure 1, it can be seen that during the heavy precipitation spell centered on 16 August 2018, one of the storm centers was located over PRB, at 9.375°N, 76.875°E (shown by box in figure 1(e)). For defining the event, we adopt an objective approach that ensures selection of a spatio-temporal scale for the event such that the rarity of the event is the highest (Cattiaux and Ribes 2018). Using observed data and climate model simulations from the Coupled Model Intercomparison Project (CMIP6; Eyring et al 2016), we estimate the attributable risk of the event using multiple approaches outlined in the broader PEA framework intended for quantifying method-related uncertainty and improve the robustness of the findings (Philip et al 2018). Further, in addition to precipitation, streamflow which forms the most important variable for characterizing the associated flood event, is also considered in this study.
2. Observed data and model simulations
Gridded datasets of observations of daily precipitation at 0.25° × 0.25° lat-lon resolution and those of daily maximum and minimum temperatures at 1° × 1° lat-lon are obtained from the India Meteorological Department (IMD) for the period 1951–2018 (IMD; available at www.imdpune.gov.in/Clim_Pred_LRF_New/Grided_Data_Download.html; Pai et al 2014, Srivastava et al 2009). Daily wind speed at 0.25° resolution for 1951–2018 is obtained from the Global Meteorological Forcing Dataset (available at http://hydrology.princeton.edu/data/pgf/), which is constructed from a combination of observations and reanalysis products (Sheffield et al 2006). Hourly values of mean temperature at 850 hPa (T), and mean sea level pressure (MSLP) and wind velocity at the surface, are extracted for the region from ERA5, a global atmospheric reanalysis product from the European Centre for Medium-Range Weather Forecasts (ECMWF; available at https://cds.climate.copernicus.eu/cdsapp#!/dataset/reanalysis-era5-single-levels?tab=overview). We have used the observed global mean land temperature anomaly data from the National Oceanic and Atmospheric Administration (NOAA), available at: www.ncei.noaa.gov/access/monitoring/global-temperature-anomalies/references; anomalies are with respect to the 20th-century mean (1901–2000). A comparison of this dataset with another commonly used global temperature data from National Aeronautics and Space Administration—Goddard Institute for Space Studies (NASA-GISS) show good correlation (supplementary figure S10).
Daily precipitation, maximum and minimum temperature and wind speed are extracted from a subset of global climate models that contribute to the Coupled Model Intercomparison Project (CMIP6; Eyring et al 2016), for two scenarios- Historical (Hist) and HistoricalNat (Nat) for the period 1951–2018 (available at https://esgf-node.llnl.gov/search/cmip6/) based on data availability. While the Hist scenario represents the observed world, Nat corresponds to a hypothetical scenario without anthropogenic emissions. The details of CMIP6 models used in the study are provided in supplementary table S1.
Figure 1(c) shows the daily climatology of precipitation in the PRB region, from both IMD observations and the CMIP6 models. While BCC-CSM2-MR, MIROC6 and IPSL-CM6-LR reasonably simulate both the seasonal cycle and magnitudes, CanESM5 and ACCESS-ESM are seen to reproduce only the magnitudes during the monsoon (JJAS), but the cycles are out of phase during the monsoon onset and retreat. Although the average JJAS precipitation is found to be underestimated in all of these models for the Indian region (supplementary figure S1), the observations and the model simulations are found to be spatially correlated over Kerala (supplementary figure S2 significant at 5% significance level). We note here that the climate model simulations used in this study are not bias-corrected. This is a valid action, given that the systematic biases in the model due to inaccurate parameterization of the thermodynamic process (Srivastava et al 2020) are intrinsic to all scenarios, and we focus on the probability of the event rather than the magnitude (Kumari et al 2019).
Observed monthly streamflow data, required for calibrating the hydrological model that is used for simulating streamflow for attribution of flood, is obtained from the global river discharge database from the Centre for Sustainability and the Global Environment (SAGE; https://nelson.wisc.edu/sage/data-and-models/riverdata/), for the gauge station in the PRB located at Neeleshwaram (10.17°N, 76.65°E, shown in figure 1(a)). The global river discharge database is acquired by collecting data from gauging stations around the world. RivDIS v2.0 (used in this study), comprises 3500 worldwide gauging stations. This dataset is used in many studies around the world and in India (Gupta et al 2016, Shah and Mishra 2016). This is a judicious choice considering that the highest population density in the region in the metro city of Cochin is situated just downstream of this outlet. Incidentally, this city was one of the most affected areas during the 2018 floods, with the airport and most of the important road networks flooded, in addition to the residential areas (Dave et al 2021). The streamflow data is available for a short, 11 year period from 1968 to 1978 (with missing data from 1972 to 1974) that has been subjectively divided for calibration and validation of the hydrological model (figure 1(d)). Soil parameters are obtained from the Harmonized World Soil Database (FAO-HWSD; Nachtergaele et al 2009; available at www.fao.org/soils-portal/data-hub/soil-maps-and-databases/harmonized-world-soil-database-v12/en/).
Variable infiltration capacity (VIC) hydrological model (Liang et al
1996) is used in this study for simulating streamflow at the selected outlet. The VIC model is chosen for its open-source availability, ease of implementation, and wide applicability for hydrological modeling in the Indian subcontinent (for example, Shah and Mishra 2016, Garg et al
2017, Shah and Mishra 2020). The model is set up at 25 km-resolution for PRB and calibrated for monthly streamflow at the selected outlet for the 1968–1972 period without including the data deficient years of 1972–1974 (figure 1(d)), resulting in acceptable values of coefficient of determination ( and Nash-Sutcliffe Efficiency (NSE) of 0.79 and 0.64, respectively. The model is also found to perform reasonably well for the validation period (1976–1978) with
  and NSE values of 0.57 and 0.34, respectively (figure 1(d)). The coefficient of determination and NSE reported are within the acceptable range according to (Moriasi et al
2007) as used in other hydrological studies (Shah and Mishra 2016, Nanditha and Mishra 2022).
and NSE values of 0.57 and 0.34, respectively (figure 1(d)). The coefficient of determination and NSE reported are within the acceptable range according to (Moriasi et al
2007) as used in other hydrological studies (Shah and Mishra 2016, Nanditha and Mishra 2022).
3. Methodology
3.1. Event definition
In general, an extreme event is characterized by a very small probability of occurrence (P1), which is a measure of its extremeness. If  is the random variable corresponding to the climate variable, say, annual maximum precipitation, and if
  is the precipitation observed during the extreme event, then, the probability of occurrence of an event equal to or more severe than
  is given by
  and its return period
  . Here, the generalized extreme value (GEV) distribution is fitted to the annual maximum precipitation and streamflow series for obtaining the return periods.
Event definition in PEA analysis requires careful attention since attribution results can be sensitive to the choice of definition of the event (Otto et al
2018, van Oldenborgh et al
2021), which in turn can affect communication of the outcome (e.g., Otto et al
2012). In this study, we adopt the objective approach outlined by Cattiaux and Ribes (2018) for defining the 2018 heavy precipitation and flooding event in the PRB. This method (supplementary figure S3) provides an automated framework for choosing the spatiotemporal scale of the event such that  is minimized (RP maximized) over possible space–time windows. This approach is increasingly implemented in attribution studies (e.g., Leach et al
2020, Ren et al
2020) due to its distinct advantage of avoiding subjective biases.
is minimized (RP maximized) over possible space–time windows. This approach is increasingly implemented in attribution studies (e.g., Leach et al
2020, Ren et al
2020) due to its distinct advantage of avoiding subjective biases.
3.2. PEA analysis
Three approaches that use observed records and climate model simulations are used in this study for the PEA analysis, as explained below.
3.3. GCM-based method
We use precipitation and streamflow simulations from one ensemble member each of the CMIP6 models, for two experiments. The first experiment, Hist, is available for 1851–2014 (we use runs for 1901–2018), which follows the historical CMIP6 protocol until 2015 and the SSP5-RCP8.5 scenario from 2016. The second one, Nat, follows the CMIP6 historical-natural protocol where the emission and boundary conditions are fixed at pre-industrial levels (Eyring et al
2016). From the GEV-distribution fitted to Hist runs, the magnitude of the event corresponding to the pre-defined observed probability  is estimated. Finally, the return period of this magnitude in the Nat scenario (
 is estimated from the GEV distribution fitted to Nat scenario simulations. Then, risk ratio (RR) for quantitative assessment of the occurrence probability of the 2018 event under anthropogenic forcing is calculated, as follows of the event is given by
  (Stott et al
2016, Kim et al
2018).
(Stott et al
2016, Kim et al
2018).
3.4. Scaling method
Probability distributions of extreme events are dependent on increase in global temperature (IPCC AR6 2021); therefore, attribution analyses can be attempted based on observed records by scaling the model distribution parameters to reflect this dependency (Otto et al
2018). In this approach, the GEV distribution fitted to extreme precipitation and streamflow are allowed to vary with a covariate. Precisely, non-stationary GEV distribution parameters (location  , and scale
  ) are assumed to scale with the exponential function of the global mean temperature anomaly (T) to reflect the Clausius–Clapeyron relation (equations (1) and (2)), (Philip et al
2020), where
) are assumed to scale with the exponential function of the global mean temperature anomaly (T) to reflect the Clausius–Clapeyron relation (equations (1) and (2)), (Philip et al
2020), where  (dispersion parameter) and
  (shape parameter) are assumed to be constant to keep the distribution positive definite. It should be noted that the records are smoothed with a 4 year running mean before scaling to dampen the interannual variability
The distribution scaled to the 2018-climate (T corresponding to 2018) and the 1901-climate (T corresponding to 1901) are considered as the factual and pseudo-counterfactual periods, respectively. This approach is previously applied to PEA studies and is preferred for its simplicity and reliability on only observed data (Philip et al 2019, Eden et al 2018).
3.5. Time-slice method
The time-slice method for PEA is also based on observed records alone. In this method, the observation period of 118 years is divided into two periods based on the change point detected using the statistical Pettitt's test. The 10 year moving averages of the basin-averaged monsoon season precipitation is considered for detection of change point, to dampen the internal climate variability signals. Next, we assumed the period before the change point, which is less affected by anthropogenic climate change as compared to the period after it, as a proxy to natural climate. Therefore, the pre- and post-change periods act as the factual and pseudo-counterfactual scenarios, respectively. Finally, we repeat the process of calculating the probability, return period and RR as described earlier.
3.6. Investigating the role of IHCs in flooding
During the 2018 heavy precipitation and flood event in Kerala, there was a high level of river discharge on August 17th and 18th, which coincided with saturated soil moisture conditions (Sudheer et al 2019). In order to better understand the potential impact of climate change on the likelihood of such flood events that are caused by both extreme precipitation and wet IHC, it is important to examine this relationship further. supplementary figure S8 shows the detailed schematic for identification of flood events driven by various antecedent hydrological conditions. As shown in the schematic, the threshold for an extreme precipitation event is defined as the 99th percentile of all 4 d independent precipitation events in the observed record, while that for extreme streamflow is assumed to be the 99th percentile of all 1 d independent VIC-simulated streamflow events. A flood event is assumed to be caused by extreme precipitation, if the extreme streamflow occurs within 0–4 d of the extreme precipitation. Further, based on the soil moisture condition, we can quantify the number of events which are caused by extreme precipitation and wet IHC individually and in conjunction with each other.
4. Results
4.1. Event definition
For achieving an objective definition of the 2018 heavy precipitation event over the PRB, we calculate observation-based return periods of the event, defined on four spatial scales—25 km × 25 km, 50 km × 50 km, 75 km × 75 km and 100 km × 100 km—centered at 9.375 N, 76.875 E, and thirty temporal scales of 1–30 d, centered on 1st August to 31st August, as shown by the heatmaps in figures 2(a)–(d). The 4 d extreme precipitation event (RX4D) centered on 16 August 2018, for the 25 km × 25 km spatial domain (highlighted by yellow star in figure 2(a)) is found to have the highest return period, among all space-time windows, and is selected as the defined event for the PEA analysis.

Figure 2. Return period of the precipitation event for different spatial resolutions (a) 25 km × 25 km, (b) 50 km × 50 km, (c) 75 km × 75 km, (d) 100 km × 100 km, centered at 9.375 N, 76.875°E, and different durations (y-axis), centered at individual dates in August, 2018 (x-axis). The chosen heavy precipitation event of 2018, based on highest return period, is marked by the yellow star. (e) Time series of precipitation at the chosen scale (25 km × 25 km, centered at 9.375 N, 76.875°E) and streamflow at the outlet of PRB for the month of August 2018.
Download figure:
Standard image High-resolution imageSimilarly, streamflow at the selected outlet on the downstream of PRB (figure 1(d)), that contributed to the heavy flooding was used for defining the 2018 flood event. Based on the time of concentration for the catchment (∼6.1 d), the maximum 1 d streamflow within one week of the precipitation event is used for attributing the 2018 event from the impact perspective. Figure 2(e) shows the magnitude of the precipitation and streamflow for August, 2018; peak streamflow can be observed within a couple of days of peak precipitation. supplementary figure S4 (a) shows the annual maximum RX4D series over Kerala, from 1951 to 2018. Consistent with previous evidence (Varikoden et al 2019), most parts of the state show decreasing trends (supplementary figure S4(b)). However, the PRB is found to be an exception, with small, but statistically significant increasing trends. The trend in RX4D, averaged over the PRB is 0.61 mm y−1 (significant at 5%; supplementary figure S4(a)). Annual maximum daily streamflow at the catchment outlet also shows positive trend (supplementary figure S4(c)) for the 1951–2018 period, though such trend is not statistically significant. Supplementary figures S6(c) and S7(c) shows the return levels for the maximum 4 d precipitation and the simulated maximum 1 d streamflow events, based on observed records for 1951–2018 period. The 2018 precipitation event is found to be a rare, 1-in 373 year event, whereas the streamflow event is not as rare, with a return period of 35 years. We note that this estimate may be biased on account of the VIC model being validated at monthly timesteps.
4.2. PEA analysis based on GCMs
Figure 3(a) shows the return period curves obtained from fitting GEV distribution to the general circulation model (GCM) ensemble mean precipitation series, for the Hist and Nat scenarios, along with the 5%–95% envelopes from 1000 bootstrapped samples. These curves show that climate change has reduced the likelihood of extreme precipitation events in Kerala, in general. In particular, the 373 year event under Hist scenario would have been a more frequent, 1-in-88-year event in Nat scenario (figure 3(a)). Further, the event has an RR of 0.31(0.23,1.83), which suggests that the event would have been about three times more likely in the absence of human-induced climate change. RRs for individual GCMs are presented in supplementary figure S9 and table S3 that provide the uncertainty across the CMIP6 models. Though some models show RR values greater than one, the magnitudes are still insignificant, leading to small (but positive) values of fractional attributable risk (FAR). We use the multi-model ensemble mean for calculation of FAR since that is believed to be more reliable than that from a single model (van Oldenborgh et al 2021). Multi-model ensemble mean is generally known to represent climate response better than simulations produced with individual models (Sillmann et al 2013). The event is found to be made 12.3% less intense in the current climate (uncertainty: −9.62% to 20.69%). This is consistent with the results from a previous study by Hunt and Menon (2020) that reported that the event would have been 18% heavier in a pre-industrial scenario. It may be noted that their study focused on a different event definition (6–18 August 2018) and a different study region; therefore, these results are not directly comparable.

Figure 3. Return levels and RR of annual maximum precipitation ((a), (c), (e)) and streamflow ((b), (d), (f)) for factual (blue) and counter-factual (orange) scenarios and the return period of the 2018 flooding event (vertical line) based on the GEV distribution, using (a), (b) GCM-based method, (c), (d) scaling method, and (e), (f) time-slice method. Envelopes represent the 5–95th percentile ranges for each run, estimated using bootstrapping with 1000 realizations.
Download figure:
Standard image High-resolution imageConsequently, the 35 year streamflow event would also have been more frequent in the Nat scenario with a shorter return period of 29 years with a RR of 0.82 (0.24, 2.48), implying that event would have been about 1.2 times more likely in the absence of human-induced climate change (figure 3(b)). Thus, in calibrated language (Lewis et al 2019a), the 2018 precipitation and flooding event in Kerala is found to be made exceptionally less likely due to climate change.
4.3. PEA analysis based on scaling method
Figure 3(c) shows the GEV-based return period curves for RX4d precipitation scaled to the 1901 and 2018 climates. These curves indicate that extreme precipitation events have become less frequent in the 2018-climate, consistent with the behavior observed for the GCM model scenarios in section 5.2, where the recurrence of precipitation in the Natural scenario is seen to be more likely.
The return period curves for RX1d streamflow series scaled to 1901 and 2018, are shown in figure 3(d). The return period of the Kerala 2018 flood event scaled to 1901 climate is found to be 1-in-26 years and 35 years in 2018 climate. The RR of 0.82 (0.76,0.97) associated with the 2018 precipitation (flooding RR is 0.64 (0.43,0.89)) event imply that 1.2 times for precipitation (1.5 times for flooding) of the reduction in risk in the present climate is attributable to anthropogenic climate change. In other words, it is exceptionally less likely that the 2018 precipitation and flooding event is a manifestation of climate change.
4.4. PEA analysis based on the time-slice method
Figures 3(e) and (f) shows the return period plots for precipitation and streamflow, respectively, for two time slices- 1901–1958 and 1959–2018. The split-point of 1958 is chosen, based on change-point detection test carried out on the decadal moving average precipitation series from 1901–2018 (supplementary figure S5). The return period curves are found to be consistent with the other two methods in that both precipitation (figure 3(e)) and streamflow (figure 3(f)), are expected to become less frequent in the recent climate (1959–2018), as compared to the earlier (1901–1958) climate. With expected shorter return periods of 1-in 286 and 1-in-17 year in 1901–1958 climate, for the 2018 precipitation and flood events respectively, the RR suggest that the respective 1.3 times and 1.8 times of the reduction in risk of these events in the recent climate is attributable to climate change.
Based on the results from the multiple methods presented in this study, it can be concluded that the 2018 extreme precipitation and flooding event in Kerala is not the result of anthropogenic climate change. On the contrary, such an event would have been more frequent in the absence of anthropogenic emissions. Our results are consistent with existing evidence on the role of climate change in reducing the 2018 Kerala flood impacts (Hunt and Menon 2020) lead by long-term weakening trends in the monsoon low-pressure systems South Asia (Roxy et al 2015, Krishnan et al 2016, Paul et al 2016).
4.5. Role of IHC in flooding
Figure 4(a) shows the total number of extreme streamflow events above 99th percentile threshold and the number of flooding events resulting from extreme precipitation (green), wet IHC (pink), and concurrence of both (brown) for historical simulation and natural simulation respectively. The probability of flooding due to extreme precipitation ( ranges between 0.32 and 0.58 (average 40%) for the historical, and 0.29 and 0.38 (average 34%) for the natural scenario, across the GCMs (figure 4(b)). On the other hand, the probability of flooding driven by wet IHC (
 ) averages 30% (range: 0.18–0.38) for historical that is very close to the average 33% (0.3–0.36) for natural (figure 4(c)), which suggests that the role of IHC remains unchanged across these two scenarios.

Figure 4. A comparison of flood events driven by extreme precipitation  , wet IHCs (
 ) or both
  . (a) The numbers inside each section of the Venn-diagram reflect the number of flooding events for that condition, while the total number of flooding events are provided in the top left (factual) or right (counter-factual) scenarios. (b)–(d) Probabilities of flooding driven by (b) extreme precipitation
  , and (c) wet IHCs
  ) or (d) both (
 ), for factual (blue) and counter-factual (orange) scenarios.
Download figure:
Standard image High-resolution image
Further, the probability of flooding driven by the concurrence of extreme precipitation and wet IHC ( conditions (figure 4(d)) is also found to be similar in the historical (range: 0.2–0.32) and natural (range: 0.24–0.35) scenarios. About 26% (31%) in historical (natural) flood events are almost always accompanied by extreme precipitation and antecedent wet soil moisture conditions in the PRB. These results imply that the relevance of extreme precipitation or IHC as drivers of floods in the PRB remains unchanged between the natural and historical scenarios. It is to be noted, however, that in our simulations of historical and natural worlds, the same land-use land-cover (LULC) patterns are retained because of lack of LULC data corresponding to the counterfactual scenario. LULC driven changes in IHC are therefore not accounted for in this analysis.
5. Discussion and conclusions
This is the first event attribution study in the Indian context, that analyzed an extreme event from both climate and impact perspectives, focusing not only on precipitation but also on hydrological variables such as streamflow. The event definition was arrived at objectively over the space-time extent where the return period of the event is maximized (Cattiaux and Ribes 2018), thus avoiding subjective biases. Streamflow series at a selected outlet on the PRB were simulated using the hydrologic model, VIC, for attribution of the flood event that followed the 2018 extreme precipitation event in the PRB. In a first, we also analyzed how the fraction of floods caused by the concurrence of extreme precipitation with wet IHC alters between the Hist and Nat scenarios, for a comprehensive attribution of the event.
Attribution analysis of these events under multiple frameworks suggested that the event is exceptionally less likely to have been due to anthropogenic climate change, with RR ranges of 0.31 to 0.82 and 0.55–0.8, for the 2018 precipitation and flood events, respectively, from the different methods. Further, the roles of extreme precipitation and wet antecedent moisture conditions in driving floods in the PRB seemingly remained unchanged between the factual and counterfactual scenarios.
The difference between the RR estimates from the climate models and the observations-based attribution frameworks is likely due to the general tendency of GCMs to underestimate extreme precipitation in the Indian sub-continent due to limitations in Indian Summer Monsoon precipitation representation (Singh et al 2019, Gusain et al 2020). These differences are also transferred to the VIC simulations, thus reflecting on the RR estimates of the 2018 flood event too. It should also be noted that the streamflow-based results reported in this study does not reflect the effects of external anthropogenic interventions such as dams and irrigation practices that were not considered in the hydrological model. Further, it is possible to investigate the effect of choices of other hydrological models or other performance metrics for calibration of such models. However, it is to be noted that our main finding of lack of evidence of climate change worsening the event is overall consistent with earlier studies (Hunt and Menon 2020) since flooding in this event is largely driven by rainfall. Therefore, choice of calibration data, hydrological model or calibration performance metric is unlikely to alter our conclusions.
Future studies may consider an end-to-end framework, for quantifying the loss and damage due to anthropogenic climate change. This study can also be considered as a case study for informing targeted disaster risk reduction action plans. Extending the framework to understand how the risks are expected to change under future climate change will be beneficial for updating climate adaptation policies.
Acknowledgments
The authors acknowledge the India Meteorological Department for making precipitation and temperature data freely accessible to the public. They also acknowledge the CMIP6 modeling groups for availability of output of climate model simulations, University of Washington for availability of the VIC model, and ECMWF for availability of ERA5 dataset. The research received funding from the SPLICE-Climate Change Programme, Department of Science and Technology, Government of India, through the Project DST/CCP/CoE/140/2018.
Data availability statement
The data that support the findings of this study are available upon reasonable request from the authors.
Code availability
All the codes that contribute to the data preparation, simulation output analysis, and statistical analysis will be provided by the corresponding author upon reasonable request.
Supplementary data (1.7 MB PDF)