

Abstract
Climate change is impacting global crop productivity, and agricultural land suitability is predicted to significantly shift in the future. Responses to changing conditions and increasing yield variability can range from altered management strategies to outright land use conversions that may have significant environmental and socioeconomic ramifications. However, the extent to which agricultural land use changes in response to variations in climate is unclear at larger scales. Improved understanding of these dynamics is important since land use changes will have consequences not only for food security but also for ecosystem health, biodiversity, carbon storage, and regional and global climate. In this study, we combine land use products derived from the Moderate Resolution Imaging Spectroradiometer with climate reanalysis data from the European Centre for Medium-Range Weather Forecasts Reanalysis v5 to analyze correspondence between changes in cropland and changes in temperature and water availability from 2001 to 2018. While climate trends explained little of the variability in land cover changes, increasing temperature, extreme heat days, potential evaporation, and drought severity were associated with higher levels of cropland loss. These patterns were strongest in regions with more cropland change, and generally reflected underlying climate suitability—they were amplified in hotter and drier regions, and reversed direction in cooler and wetter regions. At national scales, climate response patterns varied significantly, reflecting the importance of socioeconomic, political, and geographic factors, as well as differences in adaptation strategies. This global-scale analysis does not attempt to explain local mechanisms of change but identifies climate-cropland patterns that exist in aggregate and may be hard to perceive at local scales. It is intended to supplement regional studies, providing further context for locally-observed phenomena and highlighting patterns that require further analysis.
Export citation and abstract BibTeX RIS

Original content from this work may be used under the terms of the Creative Commons Attribution 4.0 license. Any further distribution of this work must maintain attribution to the author(s) and the title of the work, journal citation and DOI.
1. Introduction
Climate change is altering the distribution of global climate regimes and threatening ecosystems that are adapted to specific conditions, requiring species to either move or adapt (Loarie et al 2009). As an ecosystem, modern agriculture may be both uniquely adaptable, thanks to generations of scientific and technical advancements (Evenson and Gollin 2003), and particularly vulnerable, due to the prevalence of low-diversity monocultures bred for highly specific conditions (Teixeira et al 2013). Globally, variations in seasonal weather are responsible for approximately one-third of observed variability in crop yield (Ray et al 2015). Changing climate conditions have already impacted global crop productivity, lowering corn and wheat yields by ∼4%–5% in recent decades relative to a steady-climate scenario (Lobell et al 2011), and have been linked to a 21% reduction in global agricultural total factor productivity since 1961 (Ortiz-Bobea et al 2021). Agricultural productivity may become increasingly climate-sensitive, requiring increasing inputs to maintain current outputs under adverse climate circumstances (Liang et al 2017, Ortiz-Bobea, Knippenberg, and Chambers 2018). Globally, a 1 °C temperature increase could lower crop yields by up to 10%, despite yield improvements in high latitudes (Lobell et al 2011). Increasing frequency of extreme events such as droughts and heatwaves may also threaten food production (Yinpeng et al 2009). Li et al (2009) estimated that droughts currently cause annual global yield reductions of 6%–11%, and that by 2100, these losses will increase to 9%–26%.
Projected climate changes may alter the amount of arable land, potentially increasing amounts in Russia, China, and the United States while decreasing amounts in Africa, South America, India, and Europe (Zhang and Cai 2011). To maintain food productivity, agriculture is continually adapting through improved technologies, altered management strategies, or outright land use conversion. However, while climate impacts on yield have been extensively studied, impacts on other aspects of crop production, particularly land use, are less well understood (Iizumi and Ramankutty 2016, Sloat et al 2020). Ordonez et al (2014) estimate that land use change in the U.S. moves an order of magnitude slower than climate change, with pasture and cropland moving more quickly than other land uses. Historically, crop migration has been linked to yield improvement. For example, ∼20% of total U.S. corn yield improvement over the 20th century may be linked to changes in production area (Beddow and Pardey 2015). In recent decades the migration of global rainfed cultivation may have mitigated the strongest temperature impacts on yield; while growing season temperatures for rainfed wheat, maize, and rice increased by ∼1 °C from 1973 to 2012, the average temperature of the hottest 5% of cultivation area grew much less or decreased (Sloat et al 2020). Given this history of shifting cultivation, further land use change seems likely in response to escalating future climate change. Whether via intensification or extensification, these changes are likely to be unequally globally distributed, and will significantly impact both biodiversity and food security (Zabel et al 2019).
Cropland change tends to be directly driven by political/institutional, economic, cultural, and technological factors (Bieling et al 2013, Plieninger et al 2016), which range in scale from global (food demand, market competition) to national (public policy, market chains) to local (property rights, employment, and market access) (Hazell and Wood 2008). Regional land use change attribution studies frequently identify climate and climate changes as secondary factors (e.g. Lotsch 2007, Feres et al 2008, Tsegaye et al 2010, Osawa et al 2016, Smaliychuk et al 2016, Paudel et al 2019), and highlight the complexity of cropland-climate relationships. In some regions drought drives cropland abandonment (as farmers convert land to pasture or switch livelihoods) and in others expansion (where extensification compensates for yield deficits) (Tsegaye et al 2010, Biazin and Sterk 2013, Plieninger et al 2016, Azadi et al 2018). Thus, while cropland area shows climate sensitivity, the diverse regional responses (impacted by context, culture, economics, and geography) make it challenging to represent at larger scales. Many global economic models suggest that climate shocks will significantly impact agricultural production area in addition to trade and prices, but differ greatly in terms of the magnitude and type of these impacts: some predict expansion and others intensification; some primarily local responses, others strong cross-regional land reallocation (Nelson et al 2014). Further analysis of broad patterns in historical cropland change is therefore valuable, both to understand impacts on food security and environmental health and to facilitate identification of regions more likely to shift cultivation in response to climate. Additionally, large-scale analyses may capture patterns that exist in aggregate but are difficult to identify at fine scales where other factors are dominant.
Remote sensing data provides spatially and temporally explicit records of land cover conversions at large scales (Song et al 2018). Satellite data analyses suggest that cropland area expanded by ∼9% from 2003 to 2019, primarily driven by extensification in Africa and South America. Gross conversion rates were even higher; in 2019, ∼17% of croplands were newly cultivated, while ∼10% of 2003 croplands were removed from production (Potapov et al 2022). These conversions occurred within a changing climate, but while many studies examine the impact of climate on yield (Lambin et al 2001, Lobell et al 2011, Ray et al 2015, Vogel et al 2019), the effect of climate changes on cropping area remains highly uncertain (Iizumi and Ramankutty 2016, Sloat et al 2020).
This study combines land cover data derived from the Moderate Resolution Imaging Spectroradiometer (MODIS) with climate data from the European Centre for Medium-Range Weather Forecasts Reanalysis v5 (ERA5, Hersbach et al 2020) to analyze the relationship between climate trends and cropland change between 2001 and 2018. Identifying the impact of climate change on land use is challenging due to the dominance of socioeconomic and political factors which more directly impact land use transitions, and which may themselves have complex interactions with climate. By looking at global cropland changes in aggregate, we attempt to identify whether climate trends are associated with significant production changes, independent from any socioeconomic or political context. We then evaluate the extent to which these climate-cropland relationships are maintained at smaller geographic scales.
2. Methods
The climate metrics evaluated here (summarized in table 1) were largely derived from ERA5 at 0.25° resolution (Hersbach et al 2019), and were selected based on their relevance to crop production. Temperature and water availability metrics are strongly linked to crop yield (Porter and Semenov 2005, Lobell et al 2011, Ray et al 2015), with impacts due both to mean growing season conditions and climate extremes (Vogel et al 2019). High temperatures are particularly dangerous to crop health (Schlenker and Roberts 2009). This study evaluated annual mean temperature as a measure of overall patterns and changes, and the cumulative number of days above a crop failure threshold of 30 °C (CFT30). Crop failure temperatures vary significantly by crop and cultivar; CFT30 was selected for its higher sample size, since trends in higher CFTs were relatively rare during the study period.
Table 1. Climate metrics and physical data sources.
| Data | Metrics | Res | References |
|---|---|---|---|
| MODIS MCD12Q1 | Land cover type | 500 m | Friedl and Sulla-Menashe (2019) |
| ERA5 | Annual mean temperature, CFT30, annual precipitation, PET | 0.25° | Hersbach et al (2019) |
| SPEI | Cumulative water deficit/surplus | 0.5° | Vicente-Serrano et al (2010) |
Water availability to crops is impacted not only by precipitation amount and timing, but by the rate of evaporation and soil water holding capacity. Here, annual precipitation was used to capture general water supply. Potential evapotranspiration (PET) calculates atmospheric water demand and can be used to estimate water stress. Droughts are highly associated with yield loss (Li et al 2009) and potential land-use shifts (Bhattacharya et al 2004). The Standardized Precipitation-Evapotranspiration Index (SPEI) was selected to represent drought because it represents long-term conditions (here using a 12 month lag), includes temperature impacts, and is calibrated to regional climate; it also allows for spatiotemporal comparability, as it is standardized against global reference data (1910-present) (Vicente-Serrano et al 2010). Since it considers not only current conditions but the cumulative water deficit, we evaluate both trend and the whole period mean.
Land cover data came from the MODIS Terra + Aqua Combined Land Cover product (MCD12Q1 Version 6) International Geosphere-Biosphere Programme (IGBP) classification, which divides the global land surface into 17 categories at 500 m resolution (Friedl and Sulla-Menashe 2019). MODIS was selected both because of its long temporal coverage and because its land cover classification is available annually. This allowed us to evaluate linear trends in cropland classification rather than taking the simple difference between 2 years, an approach that has the potential to amplify errors in both the starting and finishing maps. Since classification accuracy remains a concern, both temporal and spatial aggregation were used to reduce the effect of misclassified pixels. The IGBP cropland class was converted into a binary value (crop/no crop) and aggregated to 0.25° resolution as the crop fraction of the total cell. This was used to calculate the per-pixel linear regression trend in net cropland area over the 18 year period. Only grid cells with at least 3 years of non-zero crop fraction were considered, to reduce error from single years of false classification. To evaluate the impact of the cropland classification, as well as the method used to calculate change, results were compared to a secondary analysis completed using cropland change estimations from Potapov et al (2022) (SM-1a).
Simple Pearson correlation and linear trend estimations were applied to identify cropland-climate relationship patterns. Since land use in many highly-established cropland regions tends to be relatively static, we analyzed cropland-climate relationships in cells with changing cropland areas, focusing on grid cells with three levels of cropping area change: less than 1%/decade, 1%–5%/decade, and greater than 5%/decade.
3. Results
3.1. Geospatial patterns in cropland area and climate change
Figure 1 shows the linear trends in climate variables from 2001 to 2018. Temperature and CFT30 generally increased, with very few reductions. Increases in mean temperature were strongest in higher latitudes, while increasing hot days were most common in equatorial regions. Except in India, PET increased widely across the globe; the strongest increases occurred in the Middle East, Central Africa, and northern South America. Precipitation and SPEI varied regionally. Localized increases in precipitation occurred across much of the Americas and northern Africa, with decreases in central Africa and central Asia.

Figure 1. Linear trend in climate variables from 2001 to 2018: (a) Mean temperature trend (°C/decade); (b) Trend in days above 30 °C (days/decade; (c) PET trend (mm/hr/decade), where negative PET represents decreased evaporation, and therefore decreased water loss; (d) Precipitation trend (mm/day/decade); (e) SPEI trend, where negative SPEI trend represents increasing water deficit and positive increasing water surplus; and (f) Mean SPEI across the period, in which negative values represent cumulative water deficit relative to long-term climatology, and positive values suggest cumulative water surplus.
Download figure:
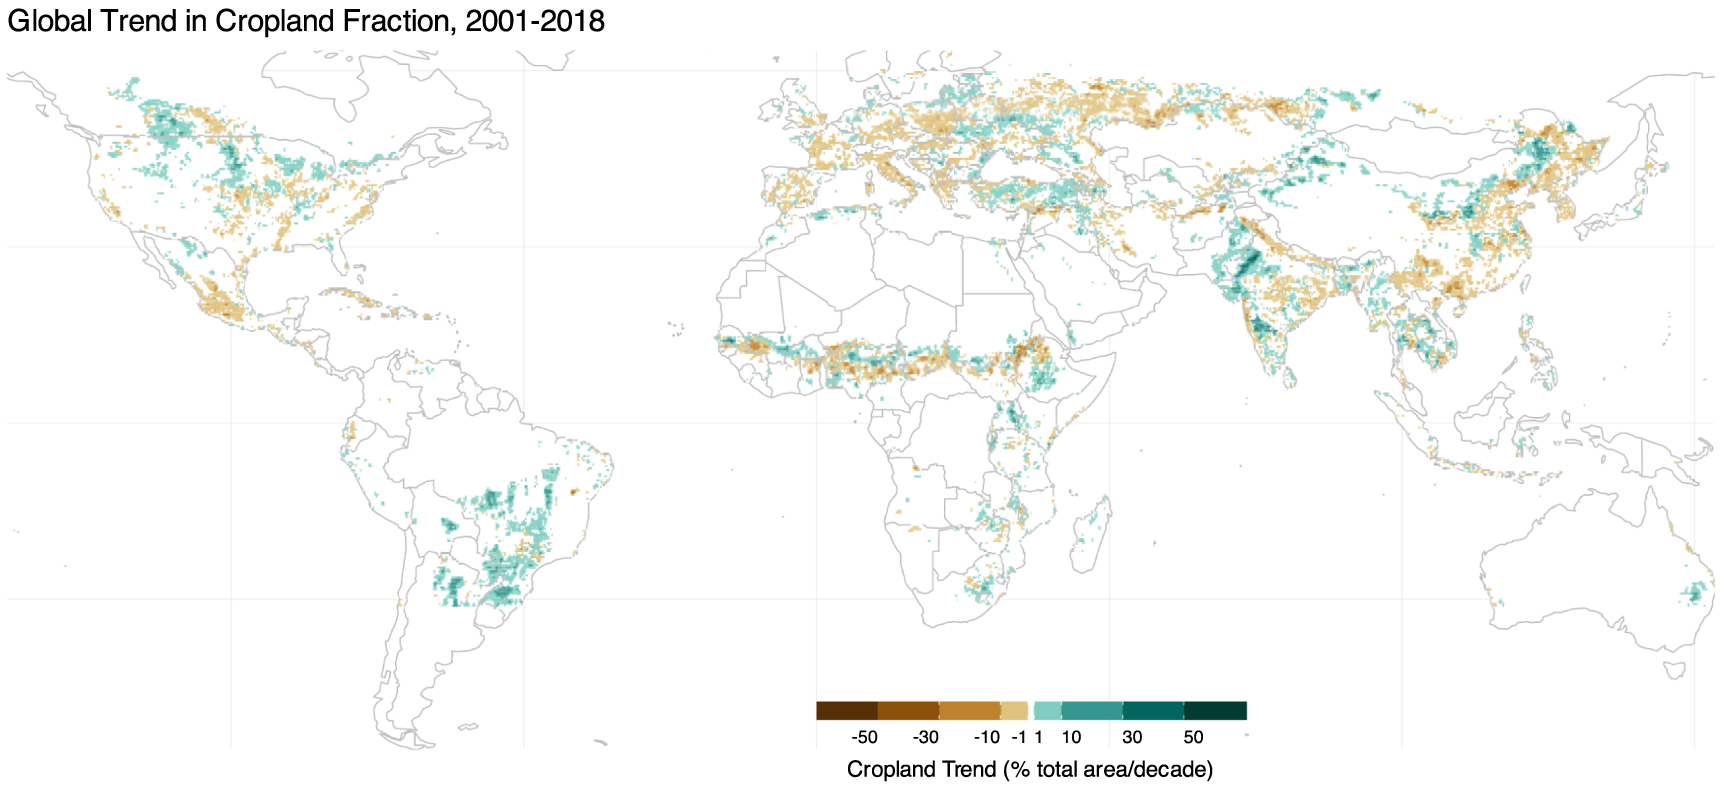
Standard image High-resolution imageCropland area increased in South America, western India, and the northern United States, and declined across much of western and northern Europe, central America, and southern China (figure 2). These changes were driven by wide-ranging factors including global demand, land availability and competition, and technological advances allowing for cultivation in new regions; for example, technological advances, high soybean prices, and government policies have been linked to intensification and extensification of cropland in Brazil (Zalles et al 2019), while urbanization in southeastern China has been linked to cropland abandonment (Hou et al 2021). Figure 2 shows MODIS-derived cropland trends from 2001 to 2018; the trends represent the slope of the linear regression line, indicating change in crop fraction, and have been converted to percent (of the total grid cell area) per decade. Thus, a 1% change indicates that 0.01 of the total grid cell changed over a decade. (See SM-2 for discussion of distribution trends.) Only grid cells that experienced statistically significant (95% confidence) trends in cropland area and in at least one climate variable were evaluated.

Figure 2. Global trend in crop area (percent of the total area of the grid cell that contains cropland). Calculated using grid cells that contained cropland in at least 3 years and had trends above/below ±1%/decade. Only trends significant at the 95% confidence level shown here. Note that due to the sparseness of the data, grid cells are represented here as slightly enlarged points to improve readability.
Download figure:
Standard image High-resolution image3.2. Global climate-crop relationships
Figure 3 shows global relationships between climate and cropland area trend (in grid cells with >1% decadal change). Variance explained was low (table 2), which is unsurprising since cropland change is primarily driven by non-climatic factors. However, all climate metrics other than annual precipitation correlated to cropland changes from 2001 to 2018. Both increasing mean temperature (3(a)) and CFT30 (3(b)) correlated with decreasing cropland area. A 1 °C/decade increase in temperature was associated with cropland loss of ∼3% of total grid cell area (∼23 km2), despite explaining only ∼1% of the variance. (This relationship was slightly amplified by outlier grid cells with decreasing temperatures; when excluded, the linear coefficient is −2.6% of grid cell area per degree temperature increase). Increasing CFT30 was similarly associated with cropland loss (0.13%/decade per additional hot day). Precipitation trends were not significantly correlated to cropland changes, but a decadal PET increase of 1 mm hour−1 was associated with a decadal cropland decrease of 0.17% of grid cell area, while a one-point increase in the SPEI index (indicating increasing water surplus) linked to a 0.74% increase in cropland share. Cropland loss was also associated with lower mean SPEI (indicating cumulative water deficit relative to the local normal). Overall, cropland area changes correlated positively with increasing water availability and negatively with increasing temperature. These patterns held true for temperature, PET, SPEI trend, and precipitation when using cropland change data from Potapov et al (2022), though there were some differences in CFT30 and mean SPEI relationships (SM-1b).
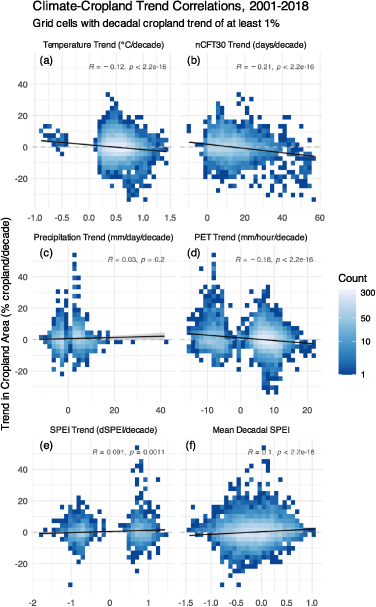
Figure 3. Global correlation between climate trends and changes in cropland area from 2001 to 2018. The y-axis shows the decadal trend in the percent of the grid cell containing cropland, while the x-axis shows the annual trend in each climate variable: (a) temperature, (b) days above 30 °C, (c) precipitation, (d) PET, and (e) SPEI. (f) Shows mean SPEI across the period. A logarithmic color scale is used to demonstrate the number of grid cells that fell along each point, with light blue representing high concentrations of points. The black line shows the linear trend across all data points.
Download figure:
Standard image High-resolution imageTable 2. Statistical relationships between cropland area trend and climate trends. Coefficient refers to the coefficient of the linear trend, indicating the change in cropland area per unit change in the climate variable.
| Single-variable linear regressions with cropland trend, global | ||||
|---|---|---|---|---|
| Variable | Coefficient | R-squared | p-value | Significance |
| Temperature trend (°C) | −3.014 | 0.014 | 0.000 | *** |
| PET trend (mm hour−1) | −0.169 | 0.032 | 0.000 | *** |
| nCFT30 trend (days) | −0.134 | 0.043 | 0.000 | *** |
| Precipitation trend (mm day−1) | 0.038 | 0.001 | 0.199 | . |
| SPEI trend | 0.744 | 0.008 | 0.001 | ** |
| Mean SPEI | 1.673 | 0.010 | 0.000 | *** |
Significance codes: *p < 0.1; **p < 0.05; ***p < 0.01.
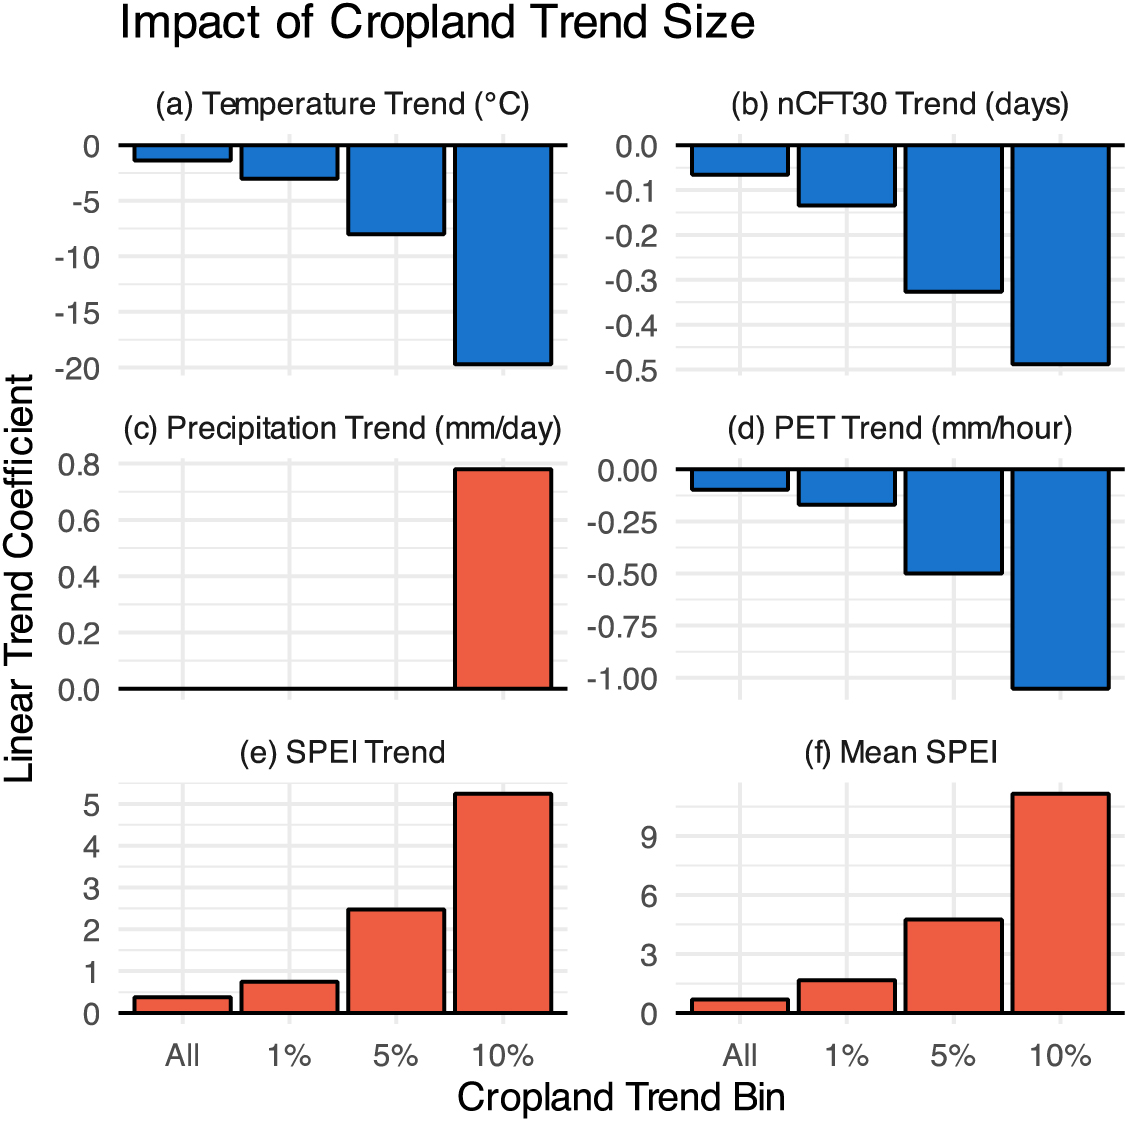
Cropland-climate relationships were stronger in regions with more cropland change. Figure 3 shows crop-climate relationships in all grid cells that gained or lost >1% of their total cropland per decade. When considering all grid cells (even those with negligible trends), magnitude decreased but directionality was maintained. However, the linear relationships dramatically increased when considering grid cells with greater cropland area changes. Figure 4 shows the distribution of the linear correlation coefficient for each climate variable across four different thresholds: all grid cells, and grid cells that gained or lost >1% (∼10 km2/decade at the equator), >5% (∼40 km2/decade), and >10% (∼100 km2/decade). Correlation magnitude increased in more dynamic regions for all climate variables; precipitation, which was not significantly correlated in grid cells with low cropland change, became positively correlated in regions with >10% cropland change.

Figure 4. Impact of cropland trend size threshold on climate-cropland relationships. For each climate variable, the y-axis shows the linear trend coefficient between the trend in the variable and the trend in cropland area (representing mean cropland change per unit climate change), while the x-axis shows four different thresholds for trend in crop area. These include the entire dataset (All), along with grid cells that gained or lost different percentages of their cropland: >1% (∼10 km2/decade at the equator), >5% (40 km2/decade), and >10% (∼100 km2/decade).
Download figure:
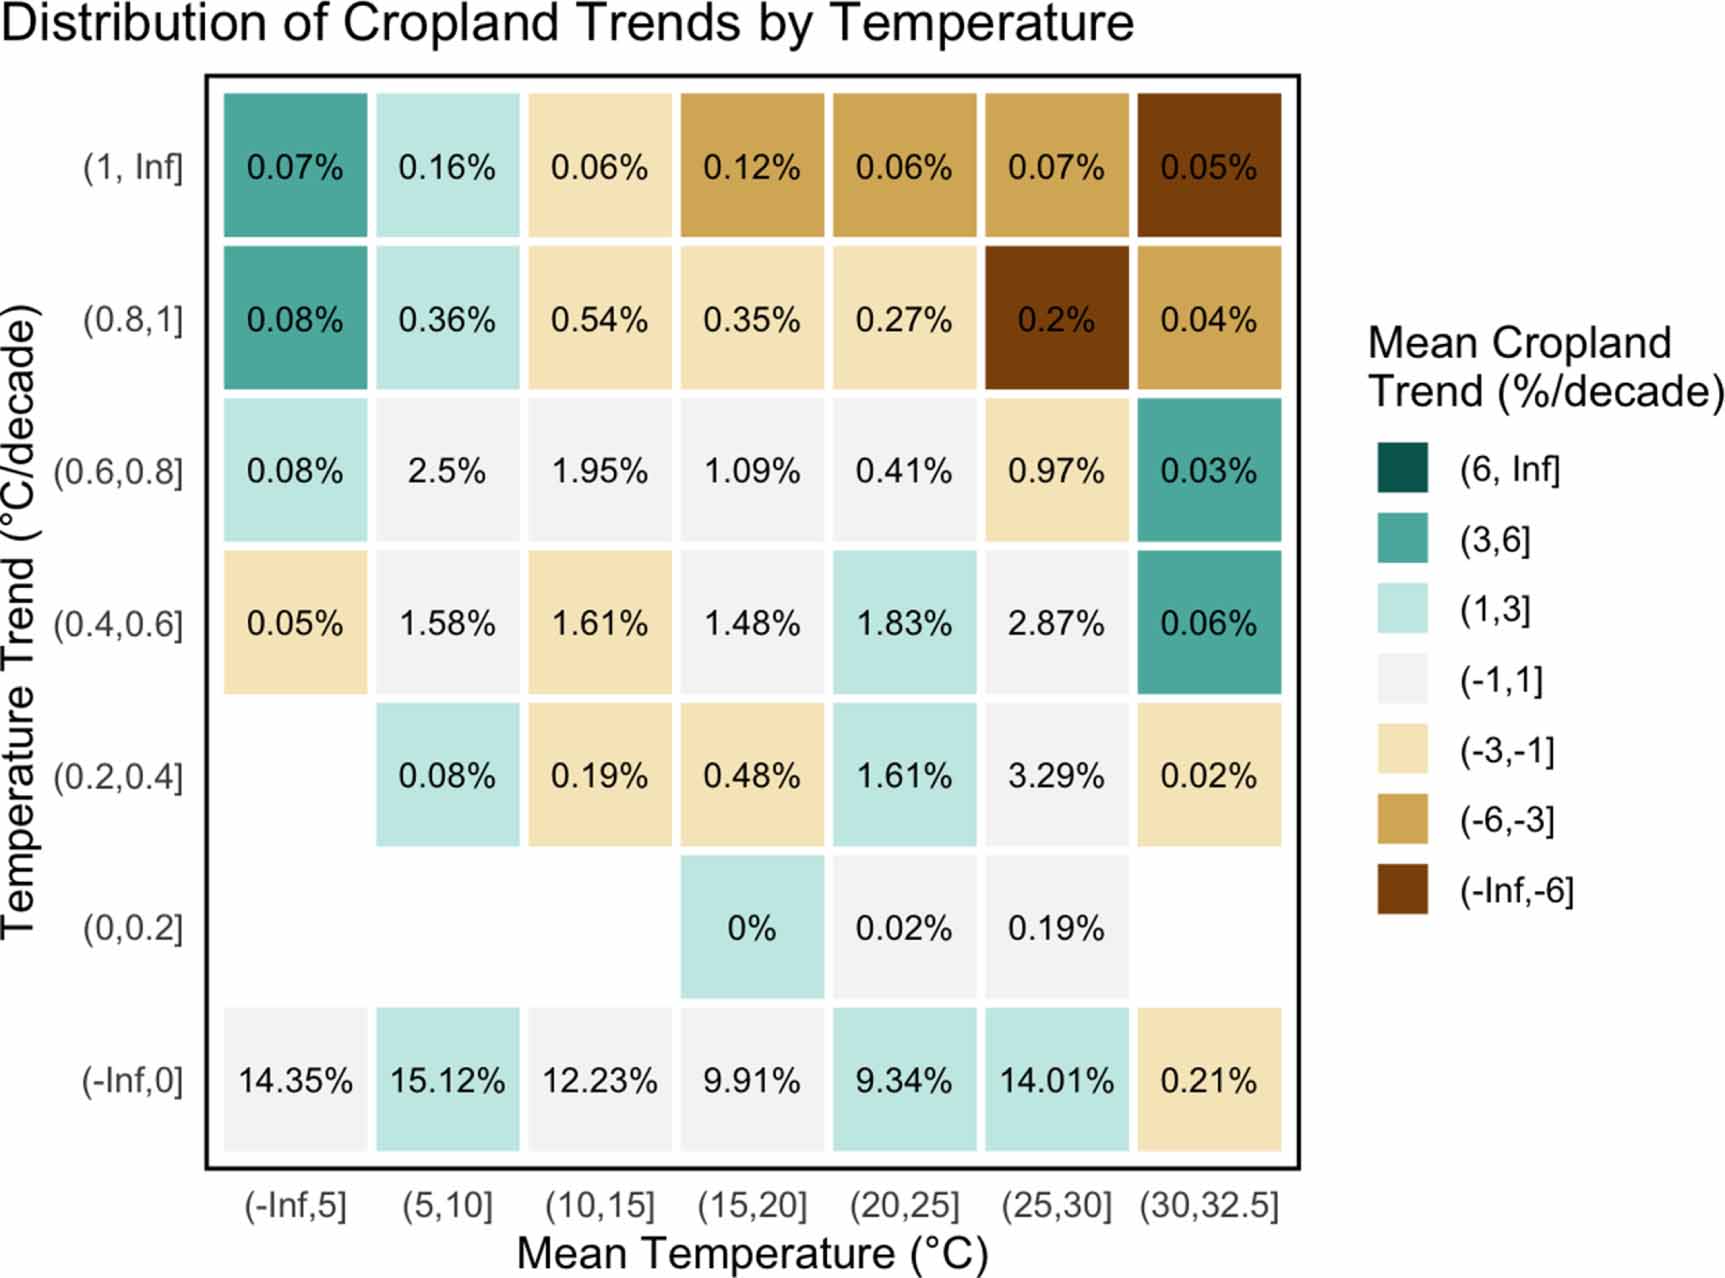
Standard image High-resolution imageThese patterns were strongly impacted by underlying climate. In cooler regions (mean temperature below the global cropland median), temperature-cropland relationships were reversed (figures 5(a) and (c)). Cropland tended to increase in warming regions, with a positive linear increase of 1.12% cropland area per additional day above 30 °C, and an increase of 2.8% area per additional 1 °C. In warmer areas, the relationships with temperature were even stronger (figures 5(b) and (d)). A 1 °C temperature increase was associated with an 4.55% decrease in percent cropping area. Hot days deviated less from the global pattern: an increase of one day above 30 °C was associated with a relatively slight cropland area loss of 0.14%. Figure 6 further examines the dependence of cropland area/temperature relationships on underlying climate. The greatest reductions in cropland area occurred in warming regions already at the upper range of mean temperature (top right), while cropland tended to increase in warming regions with cooler climates (top left). In regions where temperature did not change (bottom row), cropland tended to stay steady or increase, except in the hottest regions. These patterns were relatively consistent regardless of underlying rainfall or precipitation trend (SM-3).

Figure 5. Impact of mean temperature on climate-cropland relationships between 2001 and 2018. The top row shows the correlation between cropland area and CFT30 trends, in cooler regions (left) and warmer regions (right). The bottom row shows the correlation between temperature trend and cropland trend in cooler (left) and warmer (right) regions. The color represents the number of grid cells in each position.
Download figure:
Standard image High-resolution image
Figure 6. Distribution of cropland trends according to mean temperature and temperature trend. The top right corner summarizes cropland trends in regions where mean temperature is already high and strongly increasing; the top left shows regions where mean temperatures are lower and increasing; the bottom row indicates regions where temperature is decreasing or had no statistically significant trend (primarily the latter). Color indicates the mean cropland trend in each bin (blue indicates cropland reduction, red expansion); the number indicates the percent of total grid cells in that category.
Download figure:
Standard image High-resolution imagePET also varied with underlying climate, displaying opposite trends in wet and dry regions (below/above median precipitation) (figure 7). In dry regions, increasing PET (indicating increasing water stress) was associated with three times the amount of cropland loss identified globally (−0.50%), while in wet regions it was associated with mild cropland increase (0.11%). Increasing SPEI corresponded to slightly increased cropland in dry areas but had no significant relationship in wet regions. Figure 8 separates the distribution of cropland-PET relationships across regions with differing base precipitation. As with temperature, cropland changes dominated the tails of the climate distributions. In regions with no PET trend (most croplands), mean cropped area remained largely unchanged (except in the driest regions, where cropland increased). The greatest mean cropland gains occurred in dry regions with decreasing PET; expansion also occurred in wet areas with increasing PET. Wet regions with decreasing PET saw moderate losses.

Figure 7. Impact of mean precipitation on climate-cropland relationships between 2001 and 2018. The top row shows the correlation between cropland area and PET trends, in drier regions (left) and wetter regions (right). The bottom row shows the correlation between precipitation trend and cropland trend in drier (left) and wetter (right) regions. The color represents the number of grid cells in each position.
Download figure:
Standard image High-resolution image
Figure 8. Distribution of cropland trends according to mean temperature and temperature trend. The top right corner summarizes cropland trends in regions where mean precipitation is high and PET is strongly increasing; the top left shows regions where mean precipitation is lower and PET is increasing. The bottom left indicates regions where precipitation is low and PET decreasing. Color indicates the mean cropland trend in each bin (blue indicates cropland reduction, red expansion); the number indicates the total grid cells in that category.
Download figure:
Standard image High-resolution image3.3. Impact of spatial scale and region on climate-crop relationships
In addition to global cropland-climate relationships, this study explores two further themes. First, at what scales are climate-cropland relationships apparent? Even if cropland area is globally responsive to climate, different factors may play stronger or weaker roles at regional or national levels. Second, how do cropland-climate relationships differ regionally? Do some regions show higher climate sensitivity, or does climate responsiveness look different in different regions? A country with strong economic incentives towards cropland expansion may respond differently to climate pressures than one that is relatively stable, and responses may be significantly altered by factors such as market demand, regional land availability, the magnitude of climatic variability across available land, or access to adaptive infrastructure and technology. To explore these questions, we evaluated climate-crop relationships across geographical (continents) and political (countries) boundaries.
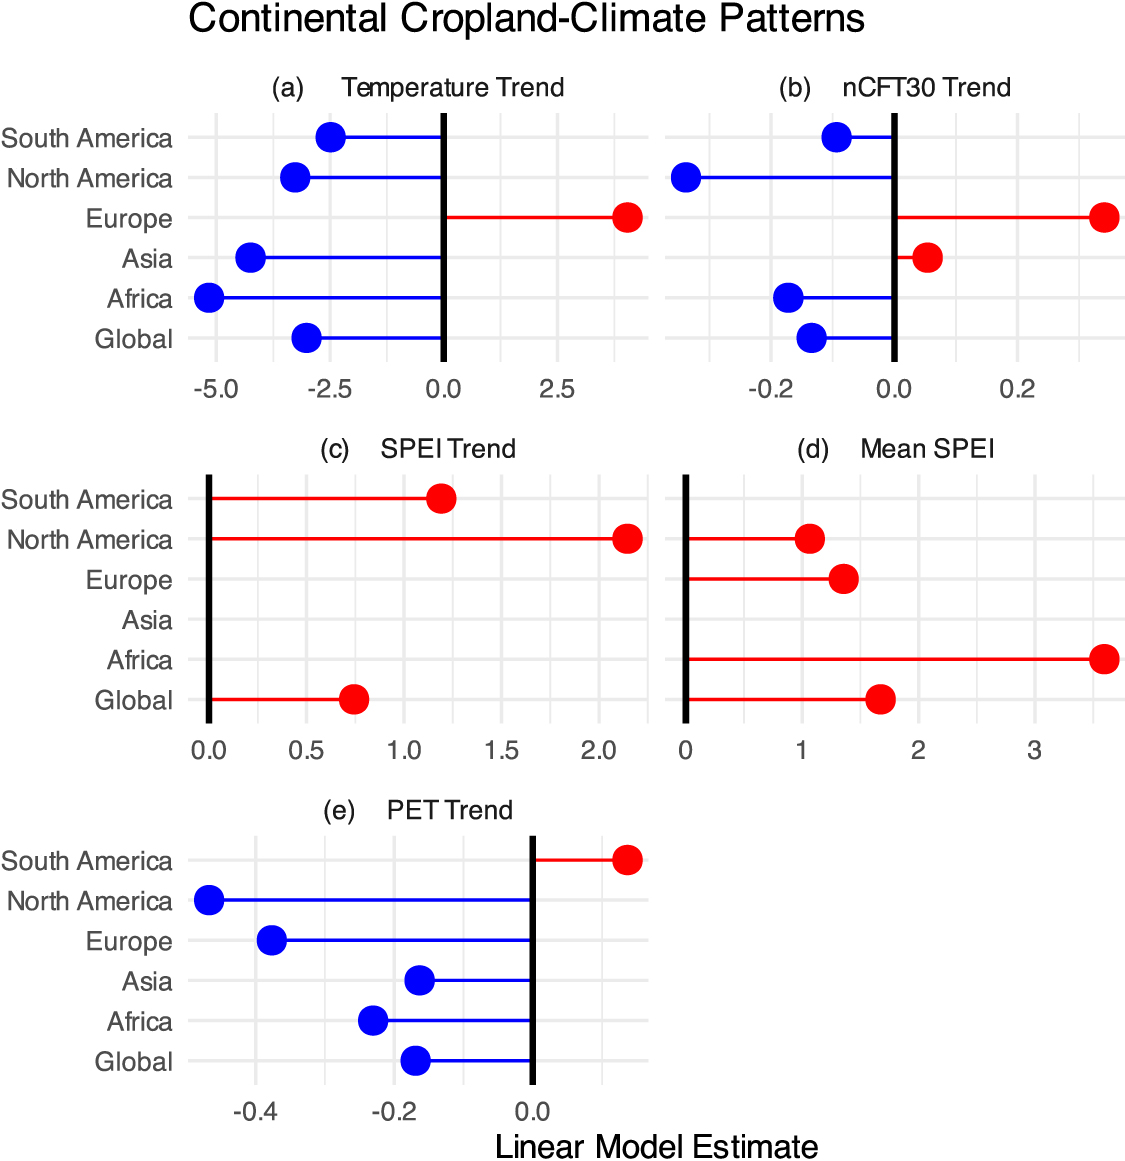
Global trends were largely reflected at continental scales, with a few outliers possibly due to differences in regional climates and the relative benefit or harm of climate trends (figure 9). Exceptions included Europe (where cropland increased in warming regions) and South America (where cropland increased with PET). Additionally, CFT30 patterns varied in direction and magnitude between continents. (See SM-4 for further discussion of continental patterns).

Figure 9. Continent scale crop-climate relationships. The circles represent the linear model estimate of the relationship between cropland trend and (a) temperature trend, (b) the trend in days above 30 °C, (c) SPEI trend, (d) mean SPEI, and (e) PET trend for each continent (excluding Australia due to small sample size). Blue indicates negative relationships and red positive. Precipitation-cropland relationships were not significant in any continent and are not displayed.
Download figure:
Standard image High-resolution imageAt national scales, climate-cropland relationships were inconsistent. Figure 10 compares national crop area trends to climate trends (only countries with >150 grid cells containing significant cropland and climate trends are shown). Many countries exhibited climate-cropland relationships opposite global patterns. For example, Chad, Mexico, India, and Tanzania tended to increase cropland more in the regions with the greatest warming (10(a)), while China and Mexico both expanded cropland in regions with increasing hot days (10(b)). With a few exceptions (including Turkey, Ecuador, and Iran), cropland generally decreased in regions where PET increased the most (10(d)); however, national SPEI-cropland relationships were mixed, with countries such as Ethiopia, Nigeria, India, and the United States expanding into areas of water surplus, and Ukraine, Mexico, China, and Canada expanding in regions with greater cumulative water deficits (10(c)).

Figure 10. Crop-climate relationships by country (only countries with at least 150 grid cells with significant trends in cropland area shown). The bar length indicates the estimated linear coefficient, with red indicating positive relationships (increasing climate metric corresponds to increasing cropland area), and blue negative. (a) Temperature trends, (b) critical heat day trends, (c), mean SPEI, and (d) PET trends are shown here; precipitation and SPEI trends are not shown due to the limited number of countries with statistically-significant relationships.
Download figure:
Standard image High-resolution image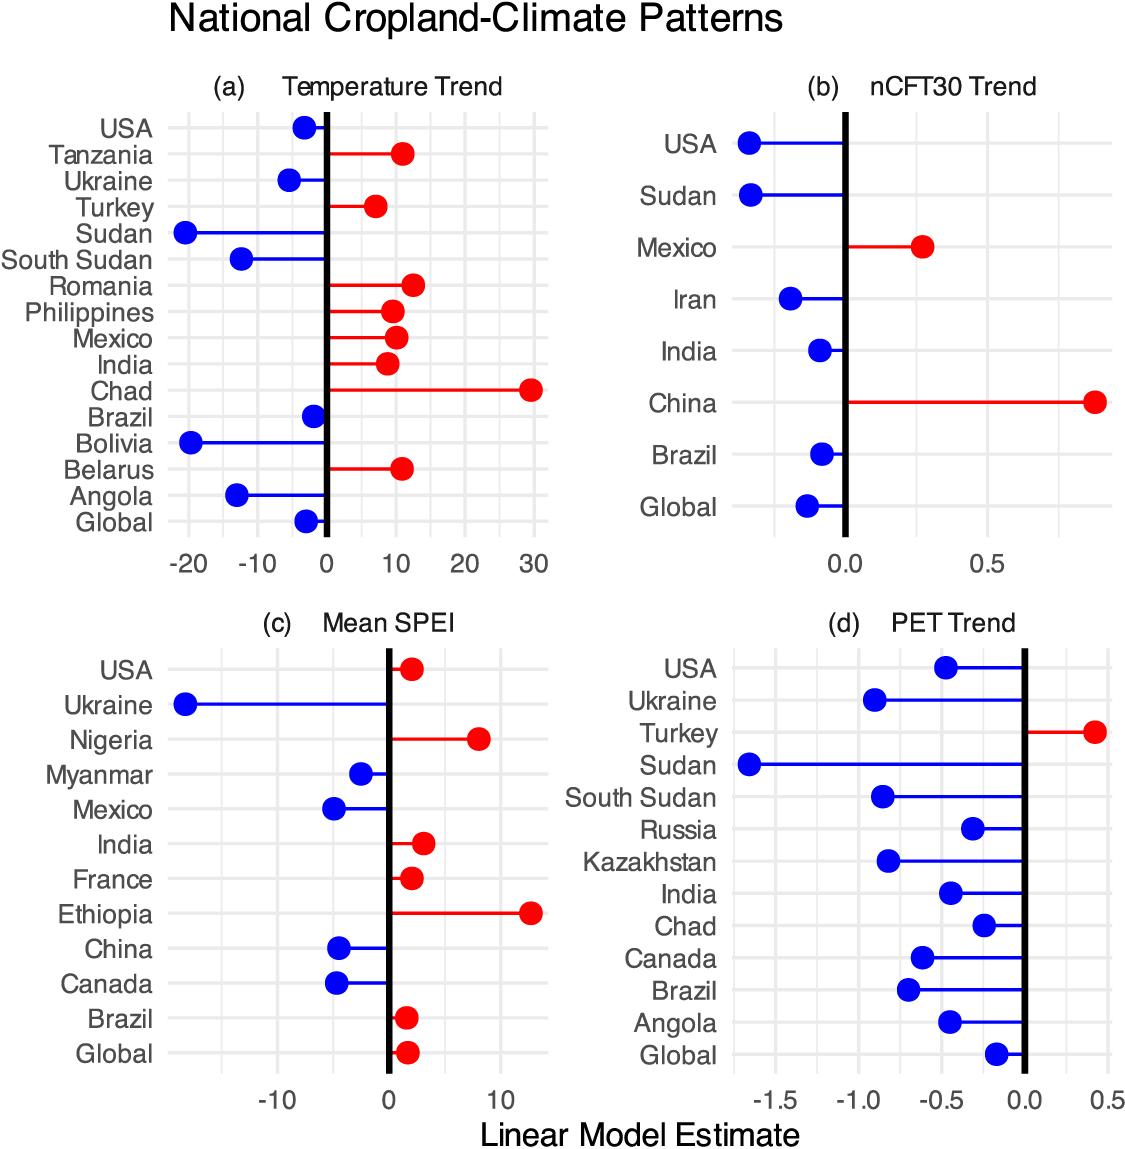
The national-scale variability did not reflect obvious geographical or climate patterns; even some of the hottest countries tended to increase cropland more in grid cells with the strongest warming. Even in Africa, which showed the strongest continental temperature-cropland change relationship (figure 9), there was little country-to-country coherence. Cropland expansion in Sudan, Ethiopia, and South Africa negatively correlated to increasing temperature, but Chad and Cameroon markedly increased cropland in areas that warmed the most. This emphasizes that cropland sensitivity to climate varies based on regional factors and may also reflect different strategic responses to climate stress.
4. Discussion
The global-scale patterns generally align with physical understanding of how climate impacts crop yields. Increased temperature and decreased water availability are associated with reduced yields (Porter and Semenov 2005, Lobell et al 2011, Ray et al 2015). Temperature impacts crop yield non-linearly; increases are often beneficial at lower temperatures but harmful above crop-specific thresholds (Schlenker and Roberts 2009). We found that cropping area increased in cooler regions with warming trends, and decreased in warming regions with warming trends, reflecting this non-linear relationship. The high concentration of cropland area changes along the tails of the temperature distributions (the hottest and coldest regions, and those with the strongest trends) shows that these relationships are strongest in more extreme circumstances (figure 6); this will be critical to evaluate as climate changes escalate in the future.
Crop yield is closely tied to water availability, particularly in rainfed regions (Hanks 1983). Droughts can cause yield loss or complete crop failure (Vogel et al 2019), sometimes extending over years, while increasing PET raises crop water demand, threatening rainfed crop and increasing irrigation costs. Thus, cropland reductions in dry regions where PET increased may represent response to water limitation. The lack of significant precipitation-cropland relationships (except in the most dynamic grid cells) may reflect that the effects are harder to capture due to its high spatiotemporal variability. Precipitation often varies greatly at scales smaller than 0.25°, and exhibits significant interannual variability that may outweigh the impact of gradual long-term trends. Additionally, beyond providing sufficient water for crop growth, fluctuations in precipitation may have relatively little impact on land use decisions, particularly when supplemental irrigation is available. Precipitation effects may appear primarily in regions at the borderline of water sufficiency (SM-5). The appearance of a significant cropland-precipitation relationship in highly dynamic grid cells (>10% change per decade; figure 4) may be due to small scale effects becoming detectable at higher levels. Alternatively, cropland conversion can itself drive precipitation changes (e.g. He et al 2022), an effect likely only observable at higher levels of change.
Generally, cropland change correlated most strongly with climate in grid cells with larger cropland area changes (figure 4), and in those on the outer bounds of mean climate (figures 6 and 8). Regions with large changes in both climate and cropland may have high climate sensitivity, suggesting that cropland area changes in direct response to climate stress or increasing suitability. Alternately, large cropland changes may occur for reasons exogenous to this study (socioeconomics or policy). This might imply that cropland changes in transitional agricultural areas are more likely to fall along climatically-beneficial lines, such as preferentially abandoning land that is climate stressed or becoming less profitable. These transitions may be driven by local factors or at larger scales through globalized markets, which may transmit price signals reflecting climate suitability (and associated growing costs). Global economic models vary significantly in how they translate climate shocks into production changes, with some predicting high international reallocation and others local expansion independent of global price transmission; this remains a key area of uncertainty in agricultural projection (Nelson et al 2014). Further study analyzing the geospatial and socioeconomic characteristics of these highly-correlated grid cells may help better identify potential causal factors driving change.
Overall, the patterns suggest a minor but statistically-significant tendency for cropland decreases in regions that became less climatically suitable and increases in those that became more. However, this study focused on correlation and cannot conclusively indicate directionality. Land cover change can itself impact regional climate. Deforestation for agricultural land clearing may be associated with decreased precipitation, while cropland may directly increase PET (Han et al 2012). In the U.S., cropland intensification and increased irrigation have been linked to cooling patterns (though this effect was not present in newly converted croplands) (Mueller et al 2016). Thus, land cover changes may cause at least part of these patterns; further investigation of temporal relationships and lag times is required to establish any causal relationship.
Climate trends explained relatively little of the total variance in land use change trends. This is unsurprising, since socioeconomic and policy factors (e.g. Bieling et al 2013, Plieninger et al 2016) tend to be more direct drivers of land use change than socioeconomic factors, though they may affect the likelihood of land abandonment given socio-economic pressures (Benayas et al 2007). The patterns identified here suggest that like other ecological variables, climate trends play a secondary role. However, while cropland expansion and contraction are primarily driven by changes in demand exogenous to environmental variables, changes in climate suitability may influence their geographic distribution.
The variability between national patterns may reflect the primacy of non-climate land use drivers, limitations of geography and food production, and differences in adaptive capacity and responsive strategies. First, many socioeconomic and political drivers operate nationally, and may drive counter-climate change. These include incentives to expand specific crops or retire ecologically vulnerable land. In the U.S., mandates to promote biofuel growth have been linked to higher crop prices, expansion into ecologically vulnerable, lower yield land, and increased environmental costs (Wright and Wimberly 2013, Lark et al 2020, 2022). While such expansion is primarily policy-driven, changes in climate may raise or lower the opportunity cost associated with cropping, thus potentially still influencing the geographic distribution of the changes.
Second, geographic or climatic constraints may limit cropland change in some areas. For example, in countries where most agricultural land is significantly warming, there may be limited ability for adaptive land use change. Finally, adaptive capacities and response strategies vary regionally. Some areas may be able to mitigate many climate impacts through strategies such as irrigation or introduction of new cultivars. In others, a primary response to climate stress may be expansion to compensate for lost yields. Responses such as adaptive extensification or irrigation expansion may explain why even in some warm regions where temperature is already a limiting factor, grid cells with the largest increases in temperature were sometimes associated with substantial cropland expansion (figures 6 and 10). Combinations of these geographic, socioeconomic, and political factors may amplify or reduce potential climate responsiveness, or even change the direction of the response. These processes must be better understood at regional levels; at the same time, identifying broad global and national trends is helpful to recognize aggregate patterns and behaviors that may be less visible when looking at smaller areas, and to identify regions that significantly deviate from expected patterns. Further analysis of the contextual factors will be key to understanding cropland responses to climate in the future.
5. Conclusion
From 2001 to 2018, trends in global cropland area corresponded to changes in temperature and water availability. Greater cropland loss occurred in warming and drying regions, particularly those with already warm and dry climates. These patterns were strongest in regions with more cropland change or more extreme climates. At national scales these patterns fluctuated substantially, with many countries exhibiting correlations opposite to the global patterns. This may reflect different adaptive capacities or strategies to yield loss, or different land use pressures. The high variability in response and the frequent presence of these opposing patterns highlights the central importance of other causes of land use change, both in directly driving cropland changes and in mitigating or exacerbating the impact of climate factors.
Hersperger et al (2010) note that correlative studies quantifying effects of specific driving forces on land change are useful primarily as exploratory analyses; they allow development of hypotheses about drivers of change, but are insufficient to determine causation or account for decision-makers' responses to interactions between the many driving forces. As climate change escalates, it is important to understand its impact on cropland use, and to identify regions that do (or do not) experience climate-associated cropland conversion. While exploratory, this study demonstrates aggregate relationships between cropland area and changing temperatures and water availability, particularly in regions with high cropland conversion rates and those already at the upper and lower bounds of climate suitability. Further analysis is needed to identify the directionality of these relationships and the role of socioeconomic and geographic factors in modifying cropland responsiveness; however, these findings highlight the need to consider climate change as a factor in cropland change, and may identify key climate-sensitive areas for further regional study.
Acknowledgments
We thank the anonymous reviewers for their constructive feedback, which helped revise this paper. This research was primarily supported by the National Oceanic and Atmospheric Administration, Educational Partnership Program with Minority-Serving Institutions, U.S. Department of Commerce, under Agreement NA16SEC4810006. Additional support came from NSF Innovations at the Nexus of Food, Energy and Water Systems under Grants EAR1639327 and EAR1903249, NRT-INFEWS: UMD Global STEWARDS (STEM Training at the Nexus of Energy, WAter Reuse and FooD Systems) Grant No. 182891, and NASA Carbon Monitoring System Grant No. 80NSSC21K1059.
Data availability statement
All data that support the findings of this study are included within the article (and any supplementary files).
Supplementary data (1.4 MB PDF)