

Abstract
The annual minimum Antarctic sea ice extent (SIE) in February 2022 hits a record low in the satellite era, with less than 2 million square kilometres observed on 25 February 2022, contrasting with the slightly positive trend in the Antarctic SIE prior to 2014. However, the preceding Amundsen Sea Low (ASL) in austral spring 2021 was the deepest since 1950. According to a linear regression model, the very low ASL contributed about 60% to the record low SIE in 2022. This study further investigates the underlying mechanism. The investigation of the lagged impact of the ASL on Antarctic SIE is based on observational data and state-of-the-art simulations. We found that (a) the deepened ASL associated with strengthened southerly winds accelerates the sea ice export away from the western Antarctic continent in spring, leading to the expansion of coastal polynyas (open water areas); (b) through the positive ice-ocean albedo feedback, the lack of the sea ice off the coastline enhances solar heating in the upper ocean and further sea ice melting in summer can occur. Specifically, in spring 2021, the deepest ASL is accompanied by a large sea-ice area flux of about 17.6 × 10³ km2 across 70° S over the Ross Sea in October and November, contributing to a significant increase in net surface radiation of 20–30 W m−2 and upper ocean warming of about 0.5 K in summer. Therefore, the deepened ASL in spring 2021 plays a crucial role for the record low Antarctic SIE in February 2022. In addition, it is found that both the La Niña conditions and the strong stratospheric polar vortex contributed significantly to the very strong ASL in 2021. Currently, nearly 2/3 of Earth system models in the Coupled Model Intercomparison Project Phase 6 have difficulties capturing the relationship between the ASL and the Antarctic SIE.
Export citation and abstract BibTeX RIS

Original content from this work may be used under the terms of the Creative Commons Attribution 4.0 license. Any further distribution of this work must maintain attribution to the author(s) and the title of the work, journal citation and DOI.
1. Introduction
Sea ice is an essential component in the Earth's climate system, which regulates heat, momentum and gas exchanges between the atmosphere and the ocean [1, 2] and helps prevent ice shelf disintegration from ocean waves [3]. Its regional expansion trends in the Southern Ocean over the period 1979–2014 [4, 5] and the substantial retreat over the past few years (2015–2022) are raising great scientific interest in recent studies [6–8].
With a marked seasonal cycle, Antarctic sea ice expands to its largest extent from the Antarctic coastline to around 60° S in September, and then retreats rapidly towards the Antarctic coastline around February and March. On 25 February 2022, the Antarctic sea ice extent (SIE) reached its annual minimum, hitting a record low with values below 2 million square kilometres (figure S1). From the regional perspective, this event is accompanied by a substantial sea ice retreat over the Bellingshausen Sea, the edges of the Weddell Sea and a complete absence of sea ice over the Ross Sea (figure 1(a)). On weather timescales, the sea ice evolution and anomalous atmospheric and oceanic conditions during the event are clearly illustrated in [9]. Over the past decades, the February Antarctic SIE displays a clear positive trend prior to 2015 (figure 1(d), blue line). After 2015, the February SIE experienced a record low in 2017, interrupting the positive trend, returning to near-average levels in 2020 and 2021, and declining to a new record low in 2022, deviating from its climatology by more than two standard deviations. While previous studies have suggested that atmospheric (e.g. zonal wavenumber-3) and oceanic factors (e.g. upper ocean warming) are responsible for the record low SIE in 2017 [10–12], the direct causes for this new record low are not yet clear.
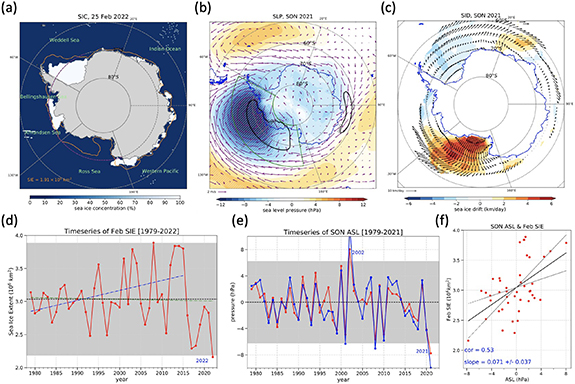
Figure 1. (a) Snapshot of Antarctic sea ice distribution on 25 February 2022, the day when Antarctic SIE reaches its annual minimum. The yellow solid contour lines represent the climatological SIC at 15% (average over 1979–2018). (b) Sea level pressure (SLP) (unit: hPa) and wind vectors at 10 meter anomalies (unit: m s−1) in SON 2021 relative to climatology. The black contour denotes the SLP climatology of ERA5 at 980 hPa. The ASL domain is encircled by green lines (170° E–298° E and 80° S–60° S). Stippling denotes that the SLP anomalies exceed two standard deviations of the climatology (1979–2018). (c) Sea ice drift (SID) (vector) and meridional component of SID (shading) anomalies in SON 2021 relative to climatology (unit: km d− 1). (d) Timeseries of Feb Antarctic SIE from 1979 to 2022 and (e) timeseries of ASL strength (red) and depth (blue) in austral spring (SON) from 1979 to 2021. The gray shading denotes the range of two standard deviations of 1979–2018. The gray and green lines in (d) denote trends during 1979–2014 and 1979–2022, respectively. (f) Scatter plot between the SON ASL and Feb SIE in the following year over the 43 years. Black line is the linear regression and gray lines denote the uncertainty range of the slope based on 95% confidence intervals.
Download figure:
Standard image High-resolution imageThe Amundsen Sea Low (ASL) is a prominent zonal asymmetric circulation pattern in the southern hemisphere (SH), with its low-pressure centre over the Amundsen and Bellingshausen Seas [13]. A large number of studies have demonstrated the significant impact of the ASL variability on the regional Antarctic climate and sea ice changes [13–16]. Compared to its climatological longitudinal position (∼30° W), the anomalous sea level pressure (SLP) in September, October and November (SON) 2021 is centred at 45° W, indicating an eastward shift of the ASL (figure 1(b)). As shown in figure 1(e), the SON ASL strength anomaly minimum is around –8 hPa, exceeding the climatological two standard deviation threshold. Based on the ERA5 extended reanalysis, the ASL in 2021 also appears to be the deepest since 1950 (figure S2). Similarly, the SON ASL depth anomaly in 2021 is around –10 hPa, which is the lowest in the last 43 years. Consistent with the deep ASL in SON 2021, there are southwesterly wind anomalies over the northern Weddell Sea and southerly wind anomalies over the eastern Ross Sea (figure 1(b)), which have been suggested to be essential to regional sea ice changes [17]. In response to the strengthened southwesterly wind over the Ross Sea, there is a substantial increase in the meridional sea ice drift (figure 1(c)). Recent work also indicates that the ASL has significant lagged impacts on the regional Antarctic sea ice via zonal/meridional wind changes [18, 19]. However, the actual impact of ASL on the overall Antarctic SIE during the summer months remains unclear.
This study addresses the question whether the deepest ASL on record in spring 2021 has contributed to the record low minimum Antarctic SIE in February 2022. The paper is organized as follows: Firstly, based on observations and CMIP6 simulations, we demonstrate the close relationship between the ASL in austral spring and the evolution of Antarctic sea ice from spring to summer. Secondly, we illustrate that the lagged impact of ASL on the summer Antarctic sea ice is due to wind-driven sea-ice/heat advection, which further triggers subsequent amplification of ice-ocean albedo feedback. Finally, we point out that the combination of La Niña conditions and the strong stratospheric polar vortex significantly contributes to the occurrence of the very strong ASL in 2021.
2. Data and methods
2.1. Data
Sea ice & SST: Monthly mean sea ice concentration (SIC) for the period 1979–2022 is obtained from the National Snow and Ice Data Center (NSIDC). This dataset is derived from Special Sensor Microwave Imager/Sounder (SSMIS) on board the Defense Meteorological Satellite Program (DMSP) satellites using the NASA team algorithm [20]. The daily SIC is obtained from the NASA team near-real time product. The data are provided on the polar stereographic projection with a spatial resolution of 25 km. Monthly sea ice drift is from the similar 25 km Polar Pathfinder Equal-Area Scalable Earth (EASE)-Grid, which is based on optimal interpolation scheme to combine satellite imagery, reanalysis winds and buoy position data [21]. Monthly sea surface temperature (SST) for the period 1982–2022 is taken from the National Oceanic and Atmospheric Administration (NOAA) with a grid resolution of 1° × 1° [22].
CERES: Monthly surface radiative fluxes are obtained from the Clouds and the Earth's Radiant Energy System (CERES) from March 2000 to February 2022. The surface radiative fluxes are extracted from level-2B FLXHR product [23], which are provided at the 1° by 1° grid.
ERA5 & ORAS5: The atmospheric circulation fields used in this study are from the ERA5 reanalysis for the period 1979–2022, including the monthly mean sea level pressure (SLP), 10 meter zonal and meridional winds, geopotential height (GPH) at 500 hPa and 50 hPa, shortwave and longwave radiative fluxes at the surface [24]. The SLP over the period 1950–1978 is retrieved from the ERA5 extended reanalysis. The ocean temperature data for the common period are from the ocean and sea-ice reanalyses (ORAs, or ocean syntheses) of version 5 (ORAS5), which is a global eddy-permitting ocean and sea-ice ensemble reanalysis [25]. We calculated the mean temperature above 50 m depth to represent the upper ocean temperature variability.
CMIP6 historical run: A key element of CMIP Phase 6 (CMIP6) [26] is the simulation of climate change observed during the so-called historical period from 1850 to 2014. Simulations of 30 models available in CMIP6 historical run and the model outputs of SIE, SIC and atmospheric variables are used. The salient information of these models is listed in the supplementary material (table S1).
CESM2-WACCM: CESM2 represents the Community Earth System Model version 2, while the WACCM is the atmospheric component model and represents the Whole Atmosphere Community Climate Model version 6, which considers interactive stratospheric chemistry and gravity wave parameterizations in the upper atmosphere [27]. Compared to its previous version CESM1, Antarctic sea ice area in CESM2 is in better agreement with the satellite era observations, particularly in terms of maximum and minimum area [28]. Overall, the CESM2-WACCM simulates a very consistent representation of the seasonal minimum and maximum of the Antarctic SIE compared to the observations, which are still not well represented in many Earth system models (figure S3) [29].
2.2. Methods
Sea-ice advection: Similar to previous studies [30, 31], the wind-driven sea-ice advection is calculated as follows,
where the variables  and
and  denote the SIC and the meridional component of sea ice motion, respectively. The original curvilinear grids are firstly interpolated to rectangular grids of 0.5° × 0.5° by distance weighted interpolation. Then, the sea-ice area flux across the longitude band at 70° S over the eastern Ross Sea (180° E–230° E) is estimated as follows,
where  and
and  denotes the SIC and sea ice motion at each grid point, respectively; n denotes the number of intervals along the longitude band at 70° S and
  denotes the length of each interval.
Climate indices: Sea ice extent (SIE) is defined as the total area covered by at least 15% sea ice concentration (SIC). For the satellite record, Antarctic SIE is obtained from the NSIDC; for the CMIP6 historical simulations, the SIEs are manually calculated or retrieved from the webpage (https://esgf-node.llnl.gov/search/cmip6/). Similar to [32], ASL metrics including ASL position in latitude and longitude, ASL strength, ASL depth and relative strength are applied. Here, the ASL strength is defined as the average of SLP over the domain: 170° E–298° E and 80° S–60° S, and ASL depth is defined as the minimum SLP over the same domain. The data are obtained from https://github.com/scotthosking/amundsen-sea-low-index. We define the near-surface southerly winds over the eastern Ross Sea as the area-averaged meridional wind at 850 hPa (V850) over the domain (180° E–230° E and 80° S–60° S). The Niño 3.4 index is the area-averaged SST anomaly from 5° S–5° N in latitude and 170° E–120° W in longitude. The strength of the stratospheric polar vortex in the SH is computed as the polar-cap-averaged (poleward of 70° S) geopotential height at 50 hPa (PCH50) [33, 34]. Surface radiative fluxes, including net radiative flux (NetRad), net shortwave and longwave radiative flux (NetSW and NetLW), downward and upward shortwave radiation (DSW and USW), downward and upward longwave radiation (DLW and ULW), are applied and defined positive downward.
Composite analysis: Based on the CESM2-WACCM, the response of Antarctic sea ice and circulations to the ASL is estimated by the composite difference according to the 10th/90th percentile of the ASL strength.
3. Results
3.1. Association between the SON ASL and the following summer SIE
To start with, for the 43 years from 1979 to 2022, the observed correlation coefficient between the SON ASL strength and Feb Antarctic SIE is about 0.53, regression coefficient or slope is 0.072 with uncertainty range of ±0.037 (figure 1(f)), estimated by 95% confidence intervals (grey lines). According to the linear regression model, corresponding to –8 hPa decrease in ASL strength, there is about 0.58 (±0.30) 106 km2 decrease in Feb Antarctic SIE, and thus contributing to about 60% of the Antarctic SIE anomaly in Feb 2022. While we examine the range of ASL metrics, we find that the ASL depth displays the strongest correlation (r = 0.63), and ASL latitude and longitude do not show a significant correlation with February SIE (not shown). It is also important to note that the correlations between SON ASL strength and monthly Antarctic SIE (September to the following August) are largest in February and statistically significant only in February and March (figure S4). This is when SIE generally reaches the annual minimum and regional sea ice variations in the Ross-Amundsen-Weddell Seas dominate the overall Antarctic SIE changes (figure 1(a)). Regionally, SON ASL strength is also highly correlated with the Weddell Sea SIE, but to a lesser extent with the Ross Sea SIE (figures 2(b) and (c)). Secondly, the lagged relationships are also examined in CMIP6 historical simulations. The correlations between SON ASL and Feb Antarctic, Ross Sea and Weddell Sea SIE over 1979–2014 (36 years) based on 30 CMIP6 models are shown in figure 2 (blue bars). Overall, compared to the other models, the CESM2 family represents well the relationship between the ASL and regional and total Antarctic SIE, which is consistent with the observations. Of the 30 models, 25 have a lower correlation than the observations, and 19 have a confidence interval that does not even overlap with that of the observations.
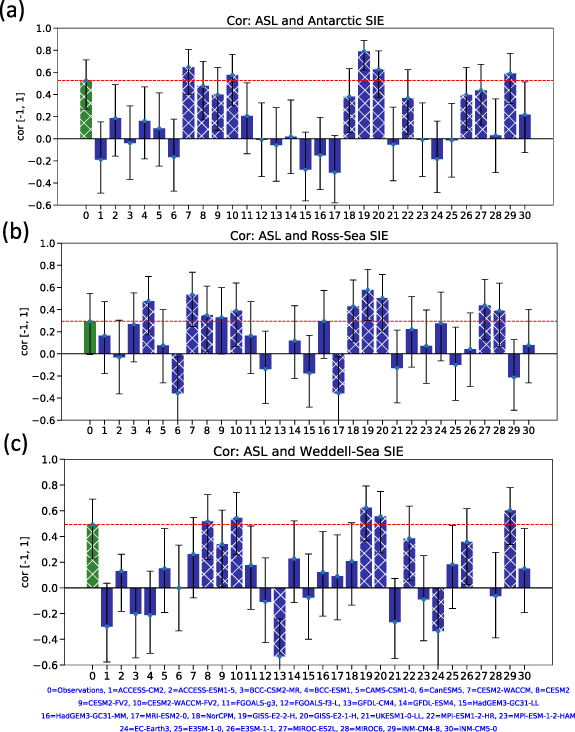
Figure 2. (a) Linearly detrended correlation coefficients between the SON ASL and the following February SIE based on observations (43 years) (green bar) and 30 CMIP6 models (1979–2014) (blue bars). Stippling denotes that their relationship is statistically significant (P < 0.05). The uncertainty of the correlation coefficients (95% confidence intervals) is displayed by the error bars. Red-dashed line denotes the correlation coefficients of the observations. Figures(b) and (c) are the same as (a), but for the correlations between the SON ASL, and Ross-Sea SIE and Weddell-Sea SIE in February.
Download figure:
Standard image High-resolution imageThe observed and well-simulated significant correlations between the SON ASL and the following Feb SIE indicate that the local circulation changes associated with a deepened ASL may have an impact on the seasonal transitions of Antarctic sea ice from spring to summer. To explore the underlying mechanism of this lagged impact, both observational data and CESM2-WACCM simulations are further examined.
3.2. Impact of ASL on the seasonal transition of Antarctic sea ice
In comparison with the deepest ASL in 2021, the 2002 ASL anomaly peaks with positive 8 hPa SLP anomalies, i.e. the shallowest ASL (figure 1(e)). Consistently, it is related to anticyclonic wind anomalies centred in the Amundsen Sea (not shown). To better depict the role of extreme ASL phase in shaping the regional sea ice, the evolution of SIC anomalies from SON to February (in the following year) in 2021/2022 and 2002/2003 are shown in figure 3 (upper panel). Over the Bellingshausen and northern Weddell Seas, there is statistically significant SIC decrease by 30% (>1 standard deviation of the interannual variability) in SON 2021 (figure 3(a)). Following the seasonal retreat of Antarctic sea ice from Dec to Feb, the sea ice margins continue to shrink southwards (figures 3(b)–(d)), while the sea ice over the interior (southward of 70° S, close to the Antarctic continent) starts to grow. Over the northern Ross and Amundsen Seas, the SON sea ice increases slightly at the edge and decreases over the interior. In the following Dec, Jan and Feb (DJF), the sea ice retreat in the interior of the Ross Sea becomes notable and significant (>40% SIC). As a result, the drastic sea ice loss at the edge of northern Weddell Sea and the inner eastern Ross Sea leads directly to the record low Antarctic SIE (figure 1(d)). In contrast to the deepest ASL in SON 2021, the ASL is shallowest in SON 2002 (figure 1(e)). Accordingly, there is a significant sea ice gain at the edge of the northern Weddell Sea and in the interior of the Ross Sea in DJF 2003.

Figure 3. Upper panel: evolution of sea ice anomalies in 2021/22 from September–October–November (SON) 2021 to February 2022. Middle panel: evolution of sea ice anomalies in 2002/03 from September–October–November (SON) 2002 to February 2003. Stippling denotes that the sea ice anomalies exceed two standard deviations of the climatology. Lower panel: composite difference of Antarctic SIC based on the 90th and 10th percentile of the ASL over the period 1850–2014. Stippling denotes that the composite sea ice difference significant at the 95% confidence level. The black contours denote the climatological sea ice edge at 15% SIC.
Download figure:
Standard image High-resolution imageThese relationships are further examined in CESM2-WACCM historical simulations (165 years). Based on the 10th/90th percentile of the ASL in CESM2-WACCM, we calculated the composite SIC anomalies from SON to February (in the following year). The 10th percentile corresponds to a deep ASL whereas the 90th percentile corresponds to a shallow ASL. The corresponding sea ice anomalies from spring to the following Feb are strongly consistent with observations (figure 3 lower panel vs. Figure 3 upper panel). For example, in response to the deeper ASLs of the simulations, the Feb sea ice experiences a substantial decrease over the northern Weddell and eastern Ross Seas and a notable sea ice increase in the interior of the Bellingshausen and Weddell Seas. These results indicate that the two extreme phases of the ASL can have opposing effects on sea ice evolution in the interior and exterior of the Weddell-Ross Seas.
3.3. Ice-ocean albedo feedback induced by ice export over the Ross Sea
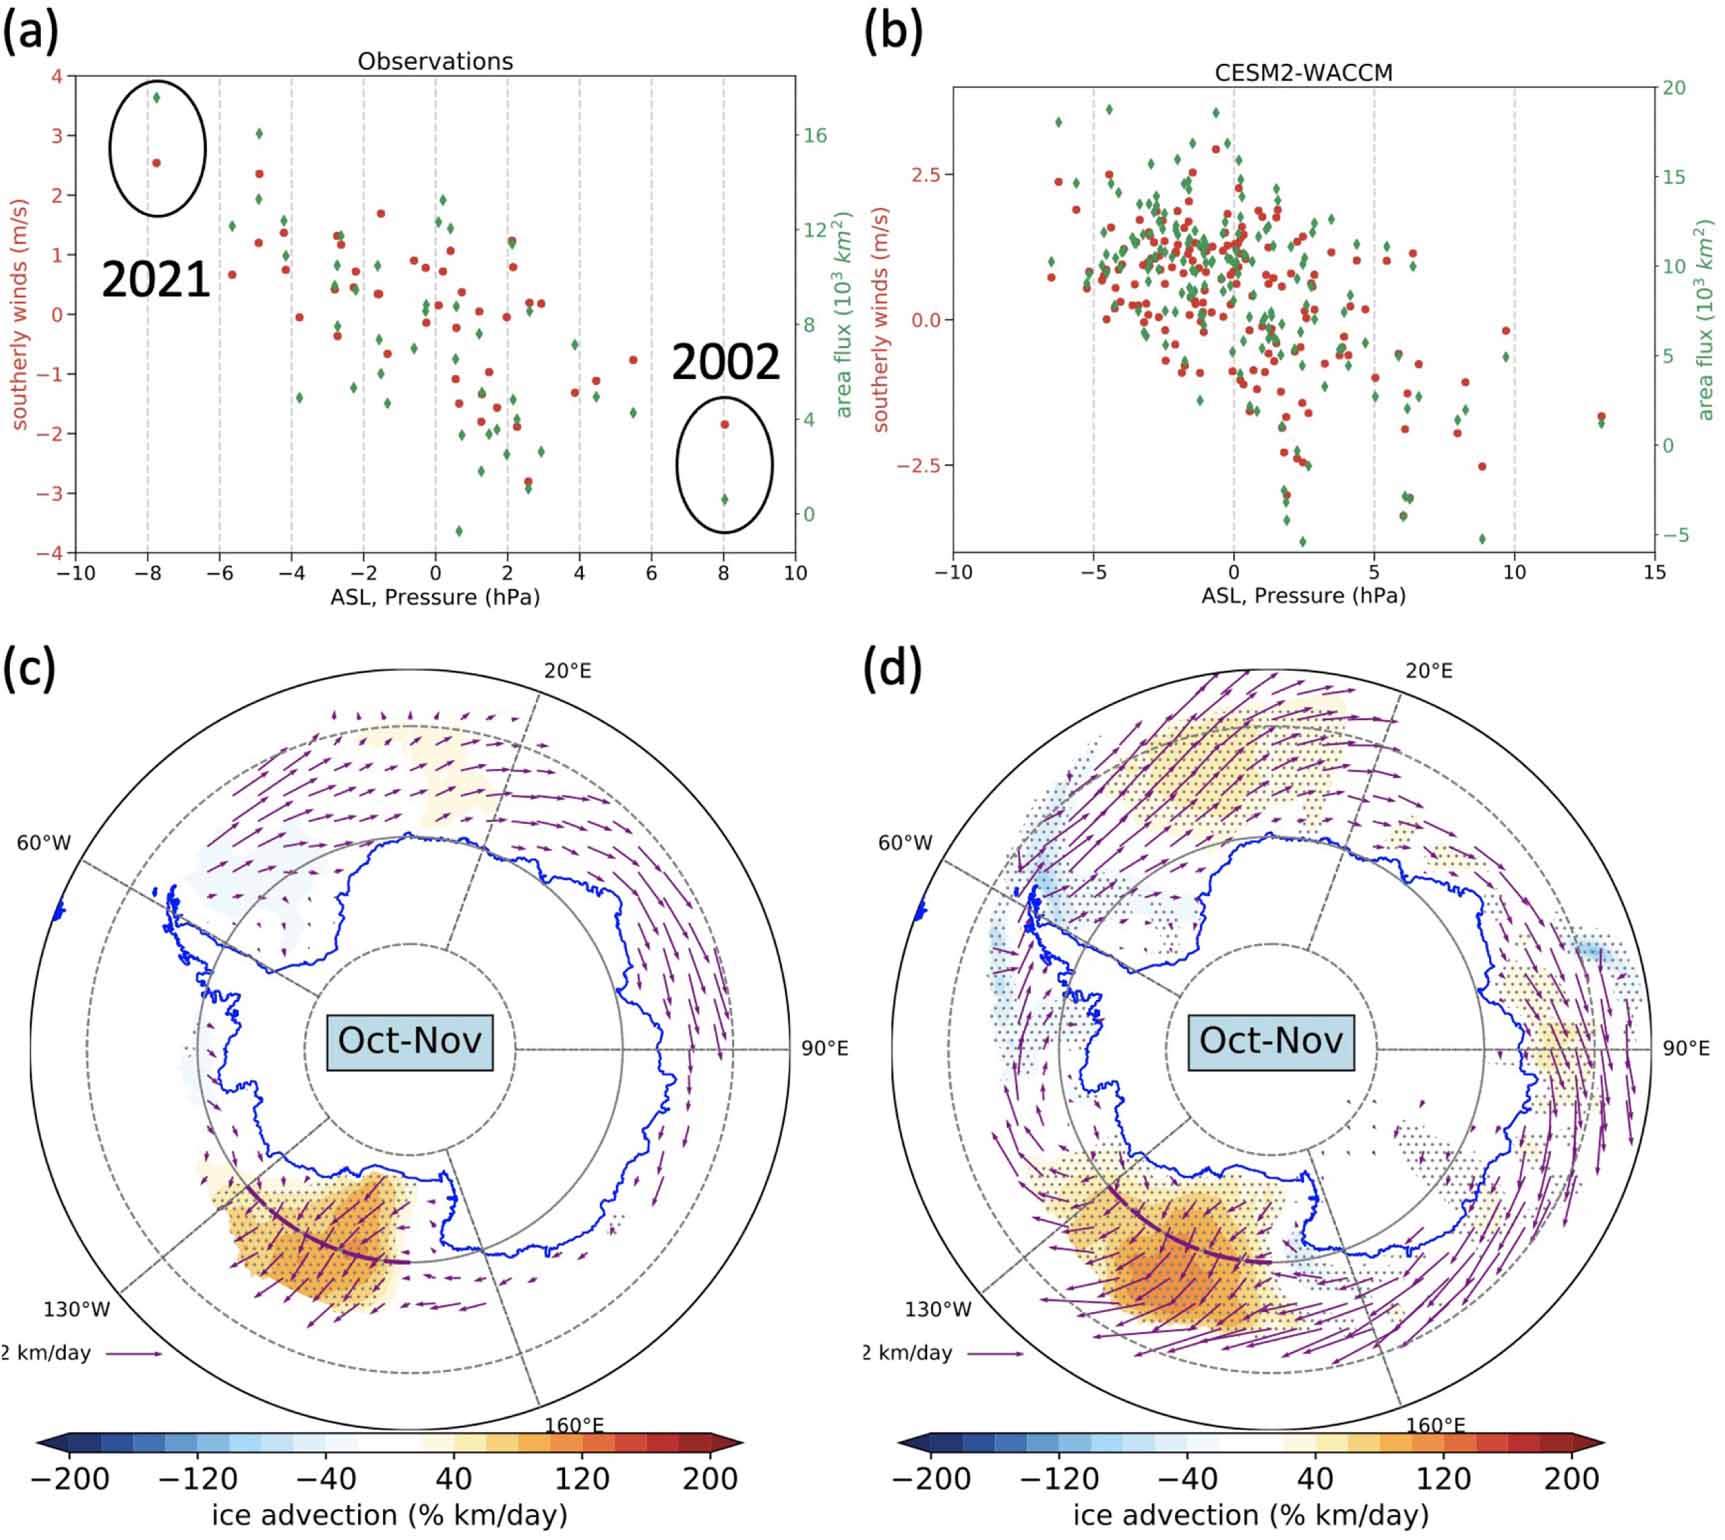
We hypothesize that the lagged Antarctic SIC responses to the preceding ASL variability are related to wind-driven sea ice export over the Ross Sea. Firstly, corresponding to strong (deep) ASLs, there is a significant increase in southerly winds over the Ross Sea with correlations about –0.67 for observations and –0.51 for CESM2-WACCM, respectively (figures 4(a) and (b)). Associated with the deep ASL and the enhanced southerly winds, there is significant northward sea-ice advection over the eastern Ross Sea in spring (figures 4(c) and (d)). The correlation between the ASL and sea-ice area flux across the latitude band at 70° S is –0.63 in observations (and –0.57 in CESM2-WACCM). The deepest ASL in 2021 is associated with substantially enhanced meridional sea ice drift over the Ross Sea with values about 5.7 km day−1 and sea-ice area flux across 70° S with values about 17.6 × 10³ km2 in October-November; in contrast, the weakest ASL in 2002 is accompanied by meridional sea ice drift of about 0.4 km d−1 over the Ross Sea and sea-ice area flux of about 0.6 × 10³ km2 in October-November.

Figure 4. (a), (b) Scatter plot between the SON ASL, Oct–Nov mean near-surface southerly over the Ross Sea and sea ice flux across 70° S (purple line in c and d). (c), (d) Regression maps between the SON ASL and sea ice drift (unit: km d− 1) and sea ice advection (unit: % km d− 1) of October-November over the period 1979–2021 and 1850–2014, respectively. The first column is for the observation and the second column is for the CESM2-WACCM historical simulations. Stippling denotes regression coefficients significant at the 95% confidence level.
Download figure:
Standard image High-resolution imageSecondly, as the sea ice is expelled away from the coastline in spring, it is associated with an increase in open water areas near the coastline, i.e. the expansion of coastal polynyas. The 'ice factory' of coastal polynyas loses its effectiveness, when the temperature rises above freezing point from spring to summer. Then, less upward shortwave would be reflected to space in summer (figures 5(a) and (i)), resulting in an increase of solar radiation absorption by the open water areas (figures 5(b) and (j)). Consequently, it leads to a substantial warming in the upper ocean (figure 5(c)), which in turn accelerates the sea ice melting. This positive ice-ocean albedo feedback sustains the surface ice melting in subsequent months. In the month-latitude plane, associated with a deep ASL, a meridional dipole structure is observed over the Ross Sea with sea ice gain in the exterior from Oct to Jan but sea ice loss in the interior from Nov to March. Analogously, the model (CESM2-WACCM) reproduced the whole process chain as seen in observations (figure 5, upper panel vs. lower panel) as well as the sea ice dipole distribution over the Ross Sea. In response to the strongest (weakest) ASL in 2021 (2002), there is about 20–30 W m−2 gain (loss) of net surface radiation (40% more than the climatology), and about 0.5 K upper ocean warming (cooling) over the eastern Ross Sea (figure S5).
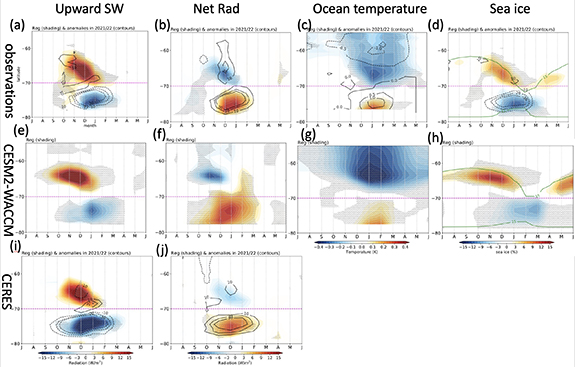
Figure 5. Upper panel: regression coefficients (shading) between the SON ASL and the evolution of the zonal mean (a) upward SW (unit: W m−2), (b) net radiation at the surface (unit: W m−2) and (c) upper ocean temperature (above 50 meters depth) (unit: K) and (d) zonal mean sea ice concentration (unit: %) over the longitude band of the Ross Sea (180°–230° E), which is based on the reanalysis datasets. The black contours are the radiation, ocean temperature and sea ice concentration anomalies for 2021/2022 and the green contours denote the climatological sea ice edge. The second panel is the same as the upper panel but for the regression coefficients in CESM2-WACCM historical simulations (1850–2014). The lower panel is for the regression coefficients between the ASL and surface radiation anomalies in CERES (2000–2022). Stippling denotes regression coefficients significant at the 95% confidence level.
Download figure:
Standard image High-resolution imageAs for the northern Weddell Sea, the sea ice evolution over the Weddell Sea is different, with a continuous sea ice decrease at the edge from spring to summer and a slight increase in the interior Weddell Sea during DJF (figures S6(d) and (h)). The ice-ocean albedo feedback also sustains the loss of sea ice from spring to summer, associated with a stronger ASL (figure S6). However, this ice-ocean albedo feedback is initiated by warmer and moister air and northerly winds, and the accompanying increase of downward longwave radiation over the Weddell Sea in spring (figure S7), which has been well documented in previous studies [35, 36].
3.4. Why is there such a strong ASL in SON 2021?
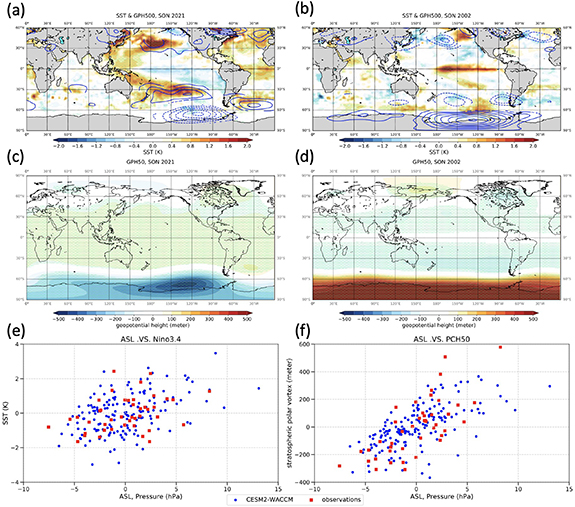
Previous studies have suggested that tropical SST variability is a major contributor to the ASL variability by generating Rossby wave trains that propagate to SH high latitudes [7, 37]. The spatial pattern of SLP anomalies in 2021 resembles the Pacific–South American (PSA) pattern. The equatorial SST over the Niño 3.4 region in SON 2021 shows significant cold anomalies (figure 6(a)), indicating La Niña conditions. The eastern and central Pacific cooling would induce a horizontal convergence in the upper troposphere with descending air, exciting a Rossby wave train that travels to the extra-tropics and deepens the ASL [38]. In comparison, the equatorial SST over the Niño 3.4 region in SON 2002 shows significant warm anomalies (figure 6(b)), indicating El Niño conditions, which leads to a shallower ASL. In 2002, the anomaly pattern is slightly different from that of 2021, which is related to Central Pacific El Niño conditions [39]. The eastward wave propagation from mid-to-high latitudes excited by the tropical SST anomalies heavily depends on the sub-tropical and polar front jets [40]. As for the long-term relationship, the SON ASL is positively correlated with the Niño 3.4 index with values of 0.35 in the observations (over 43 years) and 0.47 in CESM2-WACCM (over 165 years) (figure 6(e)), which further validates the teleconnections between La Niña and a deepened ASL.
Figure 6. Anomalous SST (shading; unit: K) and GPH500 (blue contour at 20 m) in (a) SON 2021 and (b) SON 2002. The middle panel is the same as the upper but for GPH50 anomalies. Stippling denotes that the anomalies exceed one standard deviation. GPH500 anomalies exceeding one standard deviation are displayed. Lower panel: (e) scatter plots of the SON ASL and Niño 3.4 index, (f) the SON ASL and PCH50 index. The blue dots denote the relationship in CESM2-WACCM (1850–2014), while the red squares denote that of observations (1979–2021).
Download figure:
Standard image High-resolution image
Another factor contributing to the strong ASL is the stratospheric polar vortex, which is strongly coupled with the ASL in austral spring [33, 41]. The year 2021 has a very strong and stable polar vortex (figure 6(c)), which is also reflected in the very low Antarctic ozone in austral spring [42]. The generally weakening of the polar night jet allows for the stratosphere-troposphere coupling through planetary waves [33]. The deepened ASL weakened the planetary wave-1 forcing leads to a stronger polar vortex and later polar vortex breakup [43]. Through stratosphere-troposphere coupling, this is associated with the stronger westerly wind anomalies in the lower troposphere, contributing to the stronger ASL through its interaction with the topography [44]. In contrast, the year 2002 shows the only major sudden stratospheric warming in the SH, relating to a very weak stratospheric polar vortex (figure 6(d)). Their long-term relationship is shown in figure 6, with the correlation between the SON ASL and PCH50 up to 0.74 in observations and 0.67 in CESM2-WACCM (165 years). The correlations are not sensitive to the definition of polar vortex strength (not shown). Based on the above evidence, it is proposed that La Niña conditions in 2021, along with the strong stratospheric polar vortex favoured the occurrence of the very strong ASL.
4. Summary and discussion
The annual minimum Antarctic SIE in February 2022 hits a record low in the satellite era, with less than two million square kilometres observed on 25 February 2022. A few months before, in austral spring 2021, the ASL was the deepest since 1950. According to a linear regression model, corresponding to –8 hPa decrease in ASL strength, there is about 0.58 (±0.30) 106km2 decrease in Feb Antarctic SIE, contributing to about 60% of the Antarctic SIE anomaly in February 2022. This study further addresses the links of the two extreme events, with a focus on the underlying mechanism. Firstly, we find that on the interannual timescales, there are statistically significant correlations between them with correlations of about 0.53. Only five of the thirty CMIP6 models have a higher correlation than the observations, and nearly 2/3 of them have a confidence interval that does not even overlap with that of the observations. Secondly, based on observations and CESM2-WACCM historical simulations, we find that the austral spring ASL has significant impacts on the seasonal transition of Antarctic sea ice from spring to summer, particularly over the Ross and Weddell Seas. The lagged impact of ASL on the summer Ross Sea ice is explained by wind-driven sea-ice advection, which further triggers the positive ice-albedo feedback: the reduced ice cover in spring enhanced solar heating of the upper ocean, and subsequently delayed ice freeze-up in late summer. Thirdly, in the specific case, the deepest ASL in spring 2021 is accompanied by a large sea-ice area flux of about 17.6 × 10³ km2 across 70° S over the Ross Sea in October and November, contributing to a significant increase in net surface radiation of 20–30 W m−2 and upper ocean warming of about 0.5 K in summer. This highlights the crucial role of the deepest ASL for the record low Antarctic SIE in February 2022. Finally, we point out that the La Niña conditions and the strong stratospheric polar vortex in 2021 led to the occurrence of the deepest ASL.
The wind-driven sea ice drift largely explains not only the regional sea ice concentration trends around the Antarctica [17], but also the trends of overall Antarctic SIE [45]. For example, in the Ross Sea, the yearly trend in ice transport from the region displays a positive trend during the 1992–2008 period, consistent with the general increase in the Ross sea ice area [46]. The circumpolar lows in the southern hemisphere, e.g. ASL, largely determines the sea ice drift patterns through the associated surface winds [30]. The ASL not only affects the contemporaneous distribution of Antarctic sea ice, but also has lag effects with a lead time of up to 8 months (e.g. [13, 18, 19, 47]). Deepening of the ASL is related to enhanced wind-driven zonal sea ice advection due to the associated positive phase of the Southern Annular Mode (SAM) [48]. It is suggested that associated with a deep ASL in October, the enhanced zonal winds in spring dynamically drive ice transport anomalies and resulting ice retreat variations that are retained through the summer by increased shortwave absorption and ocean heat content anomalies in the western Ross Sea [19]. Built upon previous work, in this study we demonstrate that deepening of the ASL can lead to sea ice decline over the Ross Sea in summer by transporting sea ice away from the coastline, increasing the open water areas and triggering ice-ocean albedo feedback. Moreover, we find that this mechanism plays an important role for the record low Antarctic SIE in February 2022. Thus, this study offers a new perspective on spring ASL variability relevant to Antarctic sea ice loss in summer, which is still poorly simulated in the nearly 2/3 of the CMIP6 models.
Acknowledgments
We thank two anonymous reviewers for their valuable and constructive comments. This work was supported by the National Natural Science Foundation of China (No. 41830536), the National Natural Science Foundation of China (No. 42206251), and Innovation Group Project of Southern Marine Science and Engineering Guangdong Laboratory (Zhuhai) (No. 311021008).
Data availability statement
All the data analysed here are openly available. The satellite-retrieved sea ice concentration, sea ice drift, and sea ice extent are obtained from the NSIDC. Both ERA5 and ORAS5 are retrieved from https://cds.climate.copernicus.eu/. The CERES data from March 2000 to February 2022 are obtained from https://ceres.larc.nasa.gov. CMIP6 historical simulations are obtained from https://esgf-node.llnl.gov/projects/cmip6/. The monthly SST is obtained from NOAA.
All data that support the findings of this study are included within the article (and any supplementary files).
Supplementary data (1.0 MB PDF)